
収録コレクション: 投資家向けプレゼン資料の実例
Takashimaya H1 FY2026 Earnings Presentation: the Japanese department store group's first-half results for the fiscal year ending February 2027, an upward revision to its full-year plan, and its capital-policy direction toward the company's 200th anniversary in 2031. The 52-slide deck is in Japanese and was published on TDnet (Tokyo Stock Exchange) on 2026-10-15 as the company's interim earnings briefing material (決算説明会資料). First-half consolidated gross operating revenue was ¥517.5 billion (¥5,175 億円, +6.2%), operating profit ¥27.5 billion (¥275 億円, +¥3.9 billion), with full-year operating profit raised to ¥59.0 billion and the dividend raised to ¥44 per share.
このスライドの表紙をスタイルの参考にして、ご自身の内容からスライドを作成します。 下のページから好きな1枚を選び、そのレイアウトを参考にすることもできます。
クイックナビゲーション
タグ
スライドを共有
Takashimaya H1 FY2026 Earnings Presentation: the Japanese department store group's first-half results for the fiscal year ending February 2027, an upward revision to its full-year plan, and its capital-policy direction toward the company's 200th anniversary in 2031. The 52-slide deck is in Japanese and was published on TDnet (Tokyo Stock Exchange) on 2026-10-15 as the company's interim earnings briefing material (決算説明会資料). First-half consolidated gross operating revenue was ¥517.5 billion (¥5,175 億円, +6.2%), operating profit ¥27.5 billion (¥275 億円, +¥3.9 billion), with full-year operating profit raised to ¥59.0 billion and the dividend raised to ¥44 per share.
レイアウト、主要コンテンツ、視覚要素を含む各スライドページの詳細ビュー。
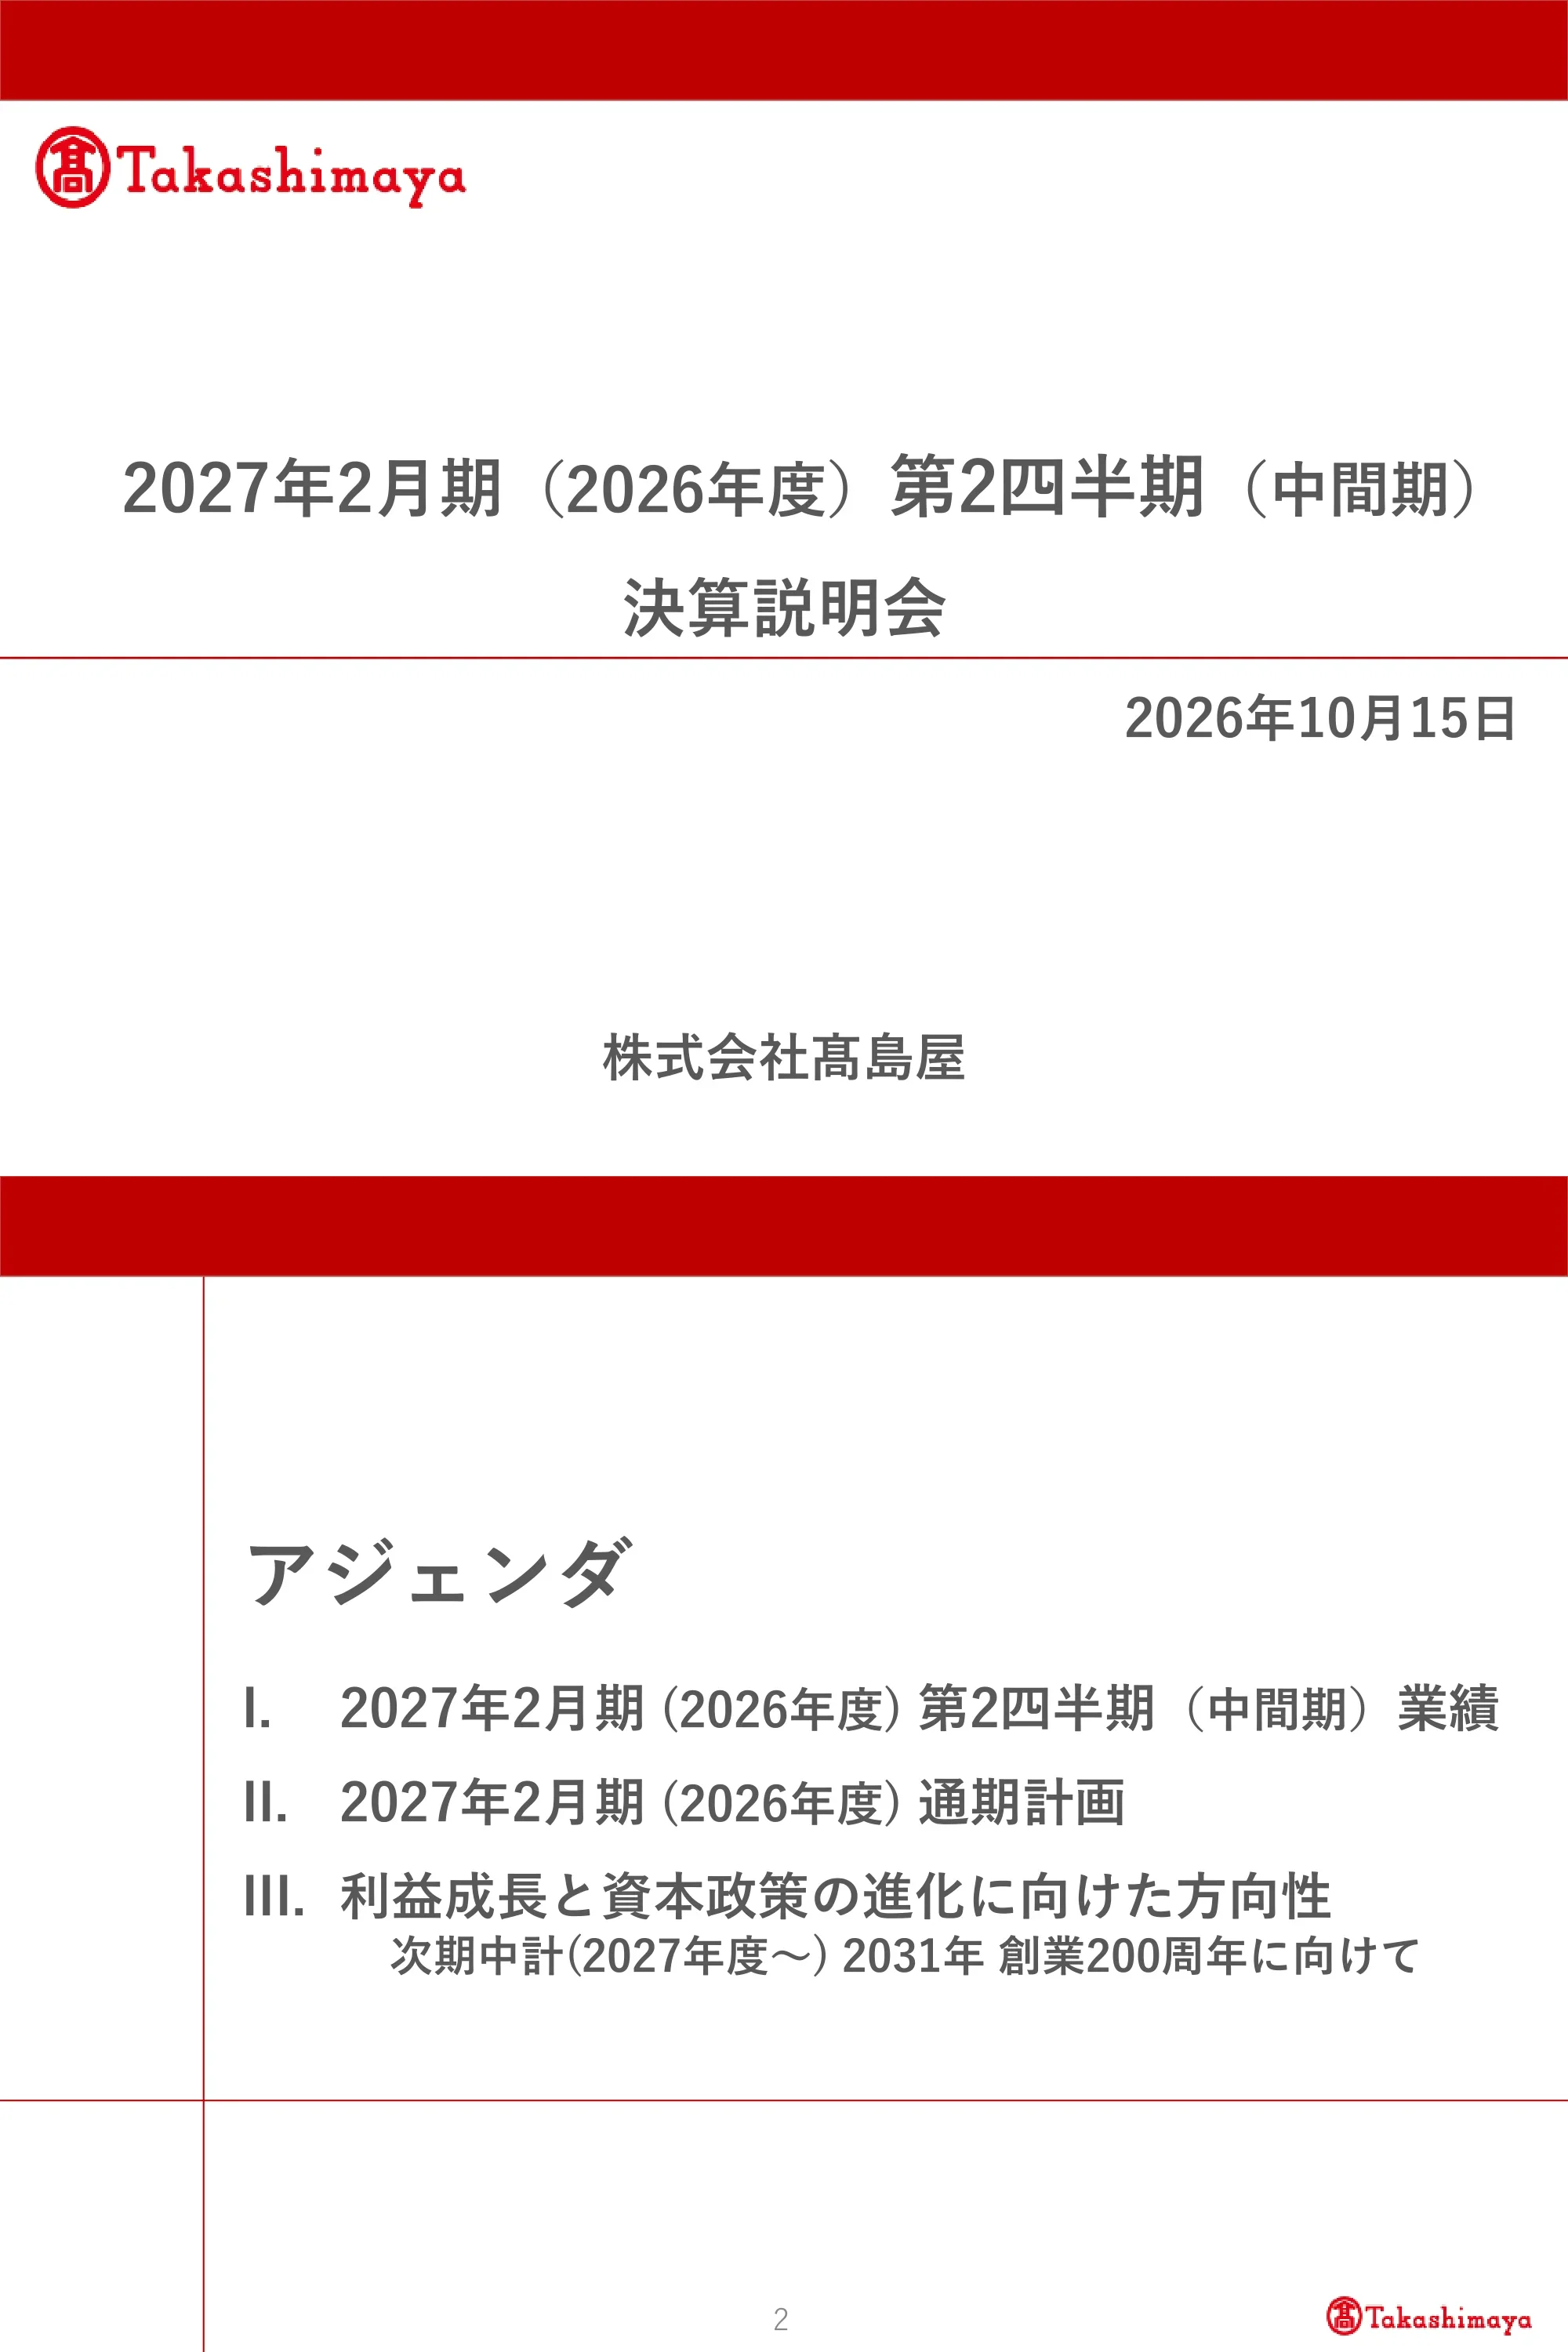
Title slide for Takashimaya Co., Ltd.'s interim (second-quarter) earnings briefing for the fiscal year ending February 2027 (FY2026), dated October 15, 2026.
Solid red header band across the top, Takashimaya logo at upper left, centred two-line title over a thin red rule, date right-aligned below and company name centred at the bottom.
Three-part agenda: I. FY2026 Q2 (interim) results; II. FY2026 full-year plan; III. Direction for profit growth and capital-policy evolution, looking toward the next medium-term plan (FY2027 onward) and the company's 200th anniversary in 2031.
Red top band with a red vertical and horizontal rule framing a large 'Agenda' heading and a Roman-numeral list.
Section divider listing five sub-topics: results highlights, consolidated results, results by segment, consolidated balance sheet and consolidated cash flow.
Red top band, large red Roman numeral 'I.' with section title on a full-width red rule, numbered sub-topic list right of centre.
Every profit line landed above the April plan; domestic department stores beat plan on operating profit thanks to higher sales to domestic customers and inbound tourists plus cost control; overseas department stores, overseas commercial development and finance stayed solid; groundwork for growth under the next medium-term plan (FY2027 onward) progressed steadily.
Slide title with red underline, four check-marked statements, the first highlighted in red as the headline message.
H1 gross operating revenue ¥5,175 億円 (+6.2%, +2.9% vs April plan); gross operating profit ¥1,520 億円; SG&A ¥1,244 億円 with SG&A ratio down 0.6 pt to 24.0%; operating profit ¥275 億円 (+¥39 億円, +¥11 億円 vs plan); business profit ¥305 億円 (+¥53 億円); ordinary profit ¥281 億円 (+¥61 億円, helped by FX gains from a weak yen); net profit ¥160 億円 (−¥52 億円 on last year's one-off asset-sale gain, but +¥7 億円 vs plan). Quarterly split: 1Q operating profit ¥160 億円, 2Q ¥116 億円.
Two check-mark summary lines above a financial table with columns for H1, YoY, vs April plan, 1Q and 2Q; key variances circled in red and profit rows boxed.
Of the ¥39 億円 operating profit increase, domestic department stores contributed ¥29 億円; growth pillars (overseas department stores +¥8 億円, overseas commercial development +¥5 億円, finance +¥5 億円) added ¥18 億円 combined; equity-method income rose ¥11 億円 to ¥21 億円. Consolidated revenue ¥2,441 億円 (+3.7%), operating profit ¥275 億円, business profit ¥305 億円; construction fell ¥5 億円 to ¥11 億円.
Two side-by-side segment tables (operating revenue upper row, operating profit lower row) with H1, YoY and vs-plan columns; reconciliation from operating profit to business profit at bottom right.
Gross operating revenue ¥4,254 億円 (+5.9%, +2.6% vs plan) on solid domestic demand and higher inbound sales; merchandise margin fell 0.22 pt to 22.01% as low-margin luxury goods took a larger share, yet gross operating profit rose ¥37 億円 to ¥957 億円; SG&A ratio improved 0.9 pt to 19.6%; operating profit ¥125 億円 (+¥29 億円), in line with plan despite higher procurement costs.
Three check-mark lines above a P&L table with H1, vs plan, 1Q and 2Q columns; key cells circled and boxed in red.
H1 SG&A of ¥832 億円 rose ¥8 億円: +¥6 億円 human-capital investment (base pay increases), +¥8 億円 sales-capability spending ahead of the next plan, +¥12 億円 procurement costs and +¥4 億円 variable costs, offset by ¥22 億円 of cost reductions. SG&A ratio 19.6%, down 0.9 pt year on year.
Expense table with rows for personnel, advertising, general administration and accounting costs; a bridge of YoY drivers with investment columns outlined in blue and cost-reduction column outlined in red.
Overseas department store revenue ¥191 億円 (+15.4%), operating profit ¥46 億円 (+¥8 億円). Takashimaya Singapore fell slightly in local currency but rose in yen terms (revenue ¥138 億円, profit ¥37 億円); Shanghai Takashimaya returned to profit through tenant leasing; Takashimaya Vietnam grew revenue 32.1%; Siam Takashimaya narrowed its loss after renovation. Yen exchange-rate effect added ¥4 億円 to profit (SGD ¥123.98 vs ¥111.79).
Store-by-store table with H1, YoY, vs plan, local-currency growth, 1Q and 2Q columns; small FX-rate and FX-impact tables along the bottom.
Domestic commercial development (Toshin Development) held operating profit flat at ¥35 億円 despite renovation work at Tamagawa Takashimaya S.C.; overseas commercial development grew revenue 14.5% to ¥90 億円 and profit ¥5 億円 to ¥32 億円, led by Toshin Development Singapore (¥25 億円 profit) and Vietnam companies. Total commercial development profit ¥67 億円; including Vietnam dividends, ¥70 億円 (+¥9 億円).
Segment table with subsidiary rows (revenue over profit), red boxes highlighting overseas growth, and a bottom line adding dividend income.
Finance (Takashimaya Financial Partners) grew in cards and payments, life-partner and investment businesses: revenue ¥123 億円 (+5.4%), profit ¥29 億円 (+¥2 億円). Construction (Takashimaya Space Create) fell to ¥175 億円 revenue and ¥11 億円 profit as soaring building costs forced some planned orders to be revisited. Other businesses (restaurants, staffing, advertising, wholesale) were roughly on plan.
Company-level table with a segment label column, H1, vs plan, 1Q and 2Q figures, red boxes on finance and construction rows.
Total assets rose ¥130 億円 to ¥13,592 億円 (end-Aug 2026 vs end-Feb 2026) on more cash (+¥167 億円) and growth-strategy investments (+¥95 億円). Current liabilities fell ¥1,290 億円 as short-term borrowings were refinanced into long-term loans and bonds (non-current liabilities +¥1,293 億円); shareholders' equity rose ¥110 億円 to ¥4,068 億円.
Twin stacked-bar charts comparing two dates: assets on the left, liabilities and net assets on the right, with colour-coded annotations beside each bar segment.
Operating cash flow ¥486 億円 (+¥340 億円 YoY on lower receivables); investing cash flow −¥283 億円 (−¥148 億円 as last year included asset-sale proceeds); financing cash flow −¥81 億円 (+¥54 億円); cash and equivalents rose ¥140 億円 from ¥774 億円 to ¥914 億円.
Four framed headline figures above a clustered bar chart for operating, investing and financing CF (prior vs current year) and a separate bar chart for cash balance.
Section divider listing plan highlights, consolidated plan, plan by segment, consolidated balance sheet and consolidated cash flow.
Same divider layout as Section I with a red Roman numeral 'II.'.
Reflecting first-half results, operating, business and ordinary profit forecasts are revised upward; net profit is held despite a one-off extraordinary loss, offset by asset sales. Domestic department stores expect more domestic and inbound sales but build in risks to margin and unavoidable cost increases; overseas businesses and finance are revised up.
Three check-marked statements with the first block in red as the headline.
Full-year gross operating revenue ¥10,800 億円 (+4.6%); operating profit ¥590 億円 (+¥55 億円, raised ¥15 億円); business profit ¥660 億円; ordinary profit ¥600 億円 (raised ¥30 億円 despite higher interest costs); net profit ¥380 億円 held (+¥462 億円 YoY, as last year included a one-off loss from the convertible-bond buyback and cancellation). Second-half operating profit planned at ¥315 億円.
Full-year, vs plan, H1 and H2 columns in a P&L table; red boxes on revised figures and a callout explaining the net profit rebound.
All segments roll forward the April plan; overseas businesses and finance are expected to add ¥34 億円 of profit combined and are revised up ¥15 億円. Full-year segment profit: domestic department stores ¥277 億円, overseas department stores ¥104 億円 (+¥19 億円), domestic commercial development ¥64 億円, overseas commercial development ¥66 億円, finance ¥63 億円, construction ¥19 億円 (−¥6 億円).
Paired segment tables mirroring page 6 but for the full year, red boxes on revised growth segments.
Revenue raised to ¥8,854 億円 (+4.1%) on solid domestic customers and growing inbound; gross operating profit ¥1,979 億円 raised despite margin pressure; operating profit held at ¥277 億円 with margin improving to 3.1%. Store sales plan: domestic customers +6%; inbound now +7% for the year (April plan −11%), totalling ¥1,020 億円 versus ¥845 億円 originally.
Full-year P&L table with H1/H2 split, plus a red-bordered box detailing store sales plans by customer type.
Full-year SG&A ¥1,702 億円 (+¥22 億円): human-capital investment +¥15 億円, sales-capability +¥20 億円, procurement costs +¥21 億円 (geopolitical risk, the main gap vs the April plan), variable costs +¥11 億円, offset by ¥43 億円 of cost reductions. SG&A ratio 19.2%, improving 0.5 pt year on year and 0.3 pt vs plan.
Same SG&A bridge table format as page 8 for the full year.
Singapore revised up on merchandising (revenue ¥297 億円, profit ¥88 億円, +¥5 億円 vs plan); Shanghai and Siam expected to grow and turn profitable; Vietnam, marking its 10th anniversary, revised up to ¥14 億円 profit. Overseas department store total: revenue ¥406 億円 (+15.4%), profit ¥104 億円. FX assumptions updated (SGD ¥121.78 vs ¥116.00 in April).
Store-level forecast table with H1/H2 columns, plus FX rate and FX impact tables at the bottom.
Domestic commercial development secures the April-plan profit of ¥64 億円 despite renovation; overseas commercial development revised up to ¥66 億円 (Toshin Development Singapore ¥53 億円, Vietnam ¥19 億円). Total ¥131 億円; including Vietnam dividends of ¥24 億円 (up from ¥13 億円), ¥154 億円.
Forecast table with subsidiary rows, red circle on the ¥154 億円 total and a callout explaining dividend growth.
Finance revised up on card transaction growth and contributions from life-partner and investment businesses (revenue ¥251 億円, profit ¥56 億円); construction revised down to ¥325 億円 revenue and ¥20 億円 profit on a tougher order environment from rising building costs; other segments roughly on the April plan.
Company-level forecast table with segment tags, full-year, vs plan, H1 and H2 columns.
Total assets planned to rise ¥338 億円 to ¥13,800 億円 by end-February 2027 on investment for sustained profit growth; liabilities kept in use while diversifying funding to lower the cost of capital; shareholders' equity up ¥266 億円 to ¥4,223 億円 and cash allocated to growth investment at an appropriate level.
Twin stacked-bar charts (assets vs liabilities and net assets) with colour-coded annotations, mirroring page 12.
Full-year operating cash flow ¥810 億円 (+¥272 億円 on higher pre-tax profit); investing cash flow −¥820 億円 (−¥471 億円 as growth investment peaks in the plan's final year); financing cash flow +¥120 億円 (+¥438 億円); cash rises ¥75 億円 to ¥850 億円.
Four framed headline figures over a clustered bar chart and a cash-balance bar chart, matching page 13.
Section divider for the strategy part, framed toward the next medium-term plan (FY2027 onward) and the 200th anniversary in 2031: group growth strategy, group seamless integration, cash allocation, unlocking asset value, shareholder returns and financial KPIs.
Divider with red Roman numeral 'III.', two-line title and six numbered sub-topics.
Looking beyond the 200th anniversary, the group will rebuild its portfolio around three growth areas built on the TAKASHIMAYA brand: next-generation shopping centres (Toshin Development's Futako-Tamagawa know-how), overseas business (trust earned in ASEAN through Singapore and Ho Chi Minh City) and finance. Non-department-store share of profit rises from 41% (FY2025) to 47% (FY2031); overseas share from 26% to 32%.
Three red-headed pillar boxes over an infinity-loop background with a brand bar beneath; four pie charts at the bottom showing business and regional mix shifts.
By 2031 next-generation SCs target ¥310 億円 of business profit (from ¥251 億円), and overseas (Vietnam) and finance each target about ¥100 億円 (from ¥37 億円 and ¥56 億円). Drivers include department store renovations (+¥36 億円), seamless integration (+¥22 億円), Vietnam commercial and office leasing and residential sales, and card payments (+¥17 億円) and investment business (+¥20 億円) in finance. FY2027 milestones: Hanoi opening and a finance intermediate holding company.
Three stacked-bar comparisons (FY2025 actual vs FY2031 target) each with a stack of labelled driver boxes alongside.
Tamagawa Takashimaya S.C., the flagship of the next-generation SC concept, reopens in 2027: an adult leisure floor and men's sauna opening March 2027 (visitors +273.0%, operating profit +177.5% vs FY2023) and a basement food floor at the June 2027 grand opening (sales +7.0%, profit +43.6%). Three features: varied reasons to visit, community infrastructure, and department store integrated with specialty stores.
Feature banner across the top, two red date headers over interior renderings with KPI boxes and bullet notes, and a red summary bar at the bottom.
Saigon Centre and Ho Chi Minh Takashimaya achieved double-digit average growth and cleared accumulated losses in 2025, turning profitable within three years. Hanoi Takashimaya S.C. opens in autumn 2027 inside West Lake Square Hanoi (35,000 m² of retail), targeting ¥24.7 億円 operating revenue in 2028; Saigon Centre phase III expansion after 2030 will create a 90,000 m² shopping centre larger than Singapore's.
Profit-trend bar chart (2016-2025) on the left with an overlay arrow, project renderings and red-bordered milestone boxes on the right, red summary bar at bottom.
Finance subsidiaries will be consolidated under Takashimaya Financial Holdings, an intermediate holding company to be set up in March 2027, uniting three pillars: cards and payments (including Takashimaya Neo Bank), life-partner services (asset building, insurance, inheritance, IFA) and investment and lending. A synergy committee links it with group companies, balancing growth ('offence') with governance ('defence').
Bordered three-pillar box at top, funnel to a group org chart with subsidiary logos, and two grey-cell grids for offence and defence priorities.
Connecting the three growth areas seamlessly to widen customer touchpoints: foundations in data and systems, digital experience, organization and people, stores and facilities, and marketing; building a unified customer-data platform by 2028; and common group services such as dual card-and-app membership, shared coupons and points, one common app and cross-group events.
Infinity loop with three area headers at top, icon row of five enablers, a red banner for the 2028 data platform, and a row of six service tiles.
Seamless integration targets a profit contribution of ¥30 億円 + α in FY2031. A customer-experience cycle (longer stays, more touchpoints, higher purchase frequency, more repeat visits, deeper loyalty) drives more cross-group users, more customers spending three times the average, and more dual app-and-card members.
Circular arrow cycle around a family icon on the left, stacked value boxes with upward arrows on the right, headline target box at top.
The app is the entry point for converting prospects into members: app membership to grow from 1.3 million to 5 million by 2031. Retention through a loyalty programme (from 2029); acquisition through Takashimaya Digital Points (from September 2026, 2% on general merchandise) and docomo and Ponta point campaigns; dual membership with the Takashimaya card, Neo Bank and EC.
Pyramid composition with a phone mock-up in the centre, retention measures on the left, acquisition on the right and source tiles along the base.
Expanding contact with affluent overseas customers across ASEAN: SNS and in-journey advertising (from April 2024), alliances with card companies (August 2026) and foreign hotels (spring 2027), cross-referrals with overseas stores and shared points (March 2026), dedicated concierges (Osaka from August 2026, Shinjuku and Kyoto to follow) and a partnership with a tax-free operator (October 2026), using CRM for one-to-one communication.
Circular cycle around an Asia map with four corner panels for awareness, contact creation, store visits and relationship deepening.
Strengthening gaisho (external sales to affluent clients) in three steps: deepen department store gaisho (lower eligibility age from March 2026, alliances from August 2026), expand into group gaisho (finance proposals with IFA, specialty stores and fashion EC) and broaden to global gaisho with overseas stores, referring wealthy overseas clients to domestic stores and events.
Three circles linked by arrows over three photo columns with bullet lists, red summary bar at bottom.
Investment of ¥2,200 億円 (including ¥1,470 億円 growth investment) is unchanged over the current three-year plan. Asset sales of ¥300 億円 and switching from debt reduction to using ¥1,300 億円 of debt fund expanded shareholder returns of ¥1,700 億円 on top of the original ¥200 億円, against operating cash flow of ¥2,500 億円. New this time: further real-estate sales and a dividend increase; beyond 2031, growing free cash flow and continued consideration of share buybacks.
Cash-in versus cash-out block diagram for April 2024 and October 2026, with purple 'added' and green 'changed' badges and a list of changes at the bottom left.
Domestic real estate held at about ¥6,000 億円 book value (end FY2025): 80% core operating stores, 20% non-store. Low-ROIC core assets are under review including partial liquidation; non-core assets are being sold, with four properties contracted and others in negotiation; 290,000 shares of Japan Airport Terminal were sold in September as part of unwinding cross-shareholdings.
Horizontal proportion bar split 80/20 with arrows down to low-ROIC and non-core boxes, a cross-shareholding box and a property photo.
Progressive dividends based on growth in net assets. The FY2026 dividend is raised to ¥44 per share (interim and year-end each +¥2) from the ¥40 April plan, a payout ratio of 33.9% and DOE of 2.75%. The 2031 target rises from payout 30%+ and DOE 2.5%+ to payout 50%+ and DOE 5.0%+.
Before/after comparison boxes (blue April vs red October) above a dividend bar chart from FY2018 to FY2031 with a dotted payout-ratio line.
FY2026 plan: operating profit ¥590 億円, business profit ¥660 億円, net profit ¥380 億円, ROIC 6.0%, ROE 8.3%, net interest-bearing debt ¥2,310 億円, equity ratio 34.0%, EPS ¥130. 2031 targets raised: business profit ¥800-850 億円 (from ¥750-800 億円), ROIC 7.5%+ (from 7.0%), and a new ROE target of 10%+.
KPI table grouped by profit growth, financial soundness and shareholder returns across 2024-2026 columns, with three red oval target callouts on the right.
Appendix index: FY2026 interim results (segment overview, segment revenue, domestic department store sales by customer and product, SG&A); FY2026 full-year plan (segment overview, segment revenue, SG&A); and the list of asset sales.
Red top band, heading over a red rule and a grouped list of appendix contents.
Full segment table for H1, 1Q and 2Q with revenue and operating profit for each segment, consolidated total (revenue ¥2,441 億円, profit ¥275 億円) and business profit ¥305 億円.
Single wide table with segment rows split into revenue and profit, and H1, vs plan, 1Q and 2Q column groups.
Gross operating revenue by segment: domestic department stores ¥4,254 億円 (+5.9%), overseas department stores ¥191 億円, domestic commercial development ¥265 億円, overseas commercial development ¥90 億円, finance ¥132 億円, construction ¥175 億円, other ¥287 億円; consolidated ¥5,175 億円 (+6.2%).
Clean revenue table with H1, vs plan, 1Q and 2Q columns and a shaded total row.
Existing-store sales rose 9% in H1 (1Q +10%, 2Q +7%); domestic customers +7% on plan, with both gaisho and non-gaisho solid; inbound sales +18%, well above the cautious plan of −3%, after falling 29% in the prior-year first half.
Heat-map style table comparing FY2025 quarters (red-tinted declines) with FY2026 1Q, 2Q and H1 (blue-tinted gains), key cells circled.
All major categories grew: apparel and sundries +2% (full-price goods +3%) helped by merchandising with key suppliers; luxury goods (jewellery and premium items) +19%; food +3%, continuing positive growth.
Same heat-map table format as page 43 by product category.
H1 inbound sales ¥519 億円 (+¥80 億円, +18%), beating the ¥425 億円 plan, supported by the weak yen and referrals from overseas stores. China held flat at ¥246 億円 (+1%) while other countries grew, cutting China's share from 56% to 47%. Monthly figures and daily averages are charted from March 2025 to August 2026.
Monthly stacked bar chart (China vs other) with a daily-average line above, dotted boxes framing the two half-years and FX rates beneath.
Inbound luxury goods sales rose 26% as last year's strong-yen slump reversed; transactions fell 2% but average spend rose 20%. Low-margin luxury goods rose to 71% of inbound sales (from 66%), weighing on overall merchandise margin; cosmetics 12%, other 17%.
Heat-map comparison table by product with transaction count and unit price rows, share summary beneath.
Detailed SG&A bridge for H1 (¥832 億円) and separately for 1Q (¥398 億円, ratio 18.6%) and 2Q (¥435 億円, ratio 20.6%), splitting changes into human-capital investment, sales capability, procurement, variable costs and cost reductions.
Three SG&A bridge tables (H1 on top, 1Q and 2Q side by side below) in the same format as page 8.
Full segment plan with full-year, H1 and H2 columns: consolidated revenue ¥5,091 億円 and operating profit ¥590 億円 (+¥15 億円 vs April), H2 operating profit ¥315 億円, business profit ¥660 億円.
Wide table with three column groups (full year, H1, H2) and revenue/profit row pairs.
Full-year gross operating revenue plan by segment: domestic department stores ¥8,854 億円, overseas department stores ¥406 億円, domestic commercial development ¥534 億円, overseas commercial development ¥191 億円, finance ¥272 億円, construction ¥326 億円 (−13.7%), other ¥641 億円; total ¥10,800 億円 (+4.6%).
Revenue table with full-year, H1 and H2 column groups and a shaded total row.
Full-year SG&A bridge (¥1,702 億円, ratio 19.2%) plus H1 (¥832 億円) and H2 (¥870 億円, ratio 18.9%) breakdowns by driver.
Three SG&A bridge tables in the same format as page 47.
FY2026 asset sales: 290,000 shares of Japan Airport Terminal sold for ¥15.5 億円 (gain ¥15.4 億円, 3Q); four non-store properties: Ebina car park in Kanagawa (gain ¥3.6 億円, 1Q), Shiomibashi land in Osaka (sale ¥38.0 億円, gain ¥21.7 億円, 3Q), Hirano land in Osaka and Omiya-higashi land and building in Saitama (3Q).
Two grey-headed tables: securities sales and real-estate sales with price, book value, gain and timing columns.
Forward-looking statements are based on information currently available and assumptions judged reasonable; they are not a promise of achievement, and actual results may differ materially due to various factors.
Red top band, Takashimaya logo at upper left and a block of disclaimer text.
このスライドと基礎となるプレゼンテーションコンテンツに関する一般的な質問。
It is Takashimaya Co., Ltd.'s 52-slide interim results briefing for the fiscal year ending February 2027 (FY2026), dated October 15, 2026. It covers first-half results, a revised full-year plan and the group's growth and capital-policy direction toward its 200th anniversary in 2031.
The slides themselves are in Japanese. The deck is Takashimaya's official earnings briefing material (決算説明会資料), published on TDnet, the Tokyo Stock Exchange's timely-disclosure system. The summaries, page-by-page analysis and figures on this page are translated into English.
Gross operating revenue was ¥5,175 億円 (¥517.5 billion, +6.2%), operating profit ¥275 億円 (+¥39 億円), business profit ¥305 億円, ordinary profit ¥281 億円 and net profit ¥160 億円. Every profit line beat the April plan, and inbound sales at domestic stores rose 18% to ¥519 億円.
Yes. Full-year operating profit was raised by ¥15 億円 to ¥590 億円 and ordinary profit by ¥30 億円 to ¥600 億円, while net profit was held at ¥380 億円. The annual dividend was raised from ¥40 to ¥44 per share, and 2031 targets now include a payout ratio of 50%+, DOE of 5.0%+, ROIC of 7.5%+ and ROE of 10%+.
Yes. The page offers the original PDF and an editable PPTX converted from it, so you can reuse the table layouts, section dividers and charts. Converted files may need minor font and spacing adjustments, especially for Japanese text.
A clean Japanese corporate IR style: white slides with a red title underline, red section-divider bands with large Roman numerals, check-mark summary bullets above each table, and red and pink financial tables where key variances are circled or boxed. Strategy slides add infinity-loop diagrams, stacked-bar bridges and photo case studies.
IR and finance teams preparing half-year or quarterly results with plan-versus-actual tables, analysts studying Japanese department stores and inbound tourism, and anyone who needs a model for combining an earnings review with a medium-term capital-allocation story.
Use this deck as a style reference in 2Slides: upload your own results and let 2Slides generate a presentation in a matching red corporate style, then refine the tables and charts. You can produce the content in English or Japanese.

Create Your Own Slides
Turn your ideas into professional presentations in seconds with 2slides AI.
プロフェッショナルなデザインを参照し、スタイルを選択し、完璧なテキストレンダリングでスライドを生成。Nano Banana搭載—今すぐプレゼンテーションの作成を始めましょう。
© 2026 2slides。全著作権所有。


