
収録コレクション: 投資家向けプレゼン資料の実例 · EC プレゼン資料の実例
MercadoLibre Q2 2026 Investor Presentation — the 34-page quarterly results deck for Latin America's largest e-commerce and fintech ecosystem, covering marketplace KPIs, Mercado Pago fintech metrics, credit quality, margin bridges, cash flow, net debt and a full revenue factsheet by country.
クイックナビゲーション
タグ
スライドを共有
MercadoLibre Q2 2026 Investor Presentation — the 34-page quarterly results deck for Latin America's largest e-commerce and fintech ecosystem, covering marketplace KPIs, Mercado Pago fintech metrics, credit quality, margin bridges, cash flow, net debt and a full revenue factsheet by country.
レイアウト、主要コンテンツ、視覚要素を含む各スライドページの詳細ビュー。
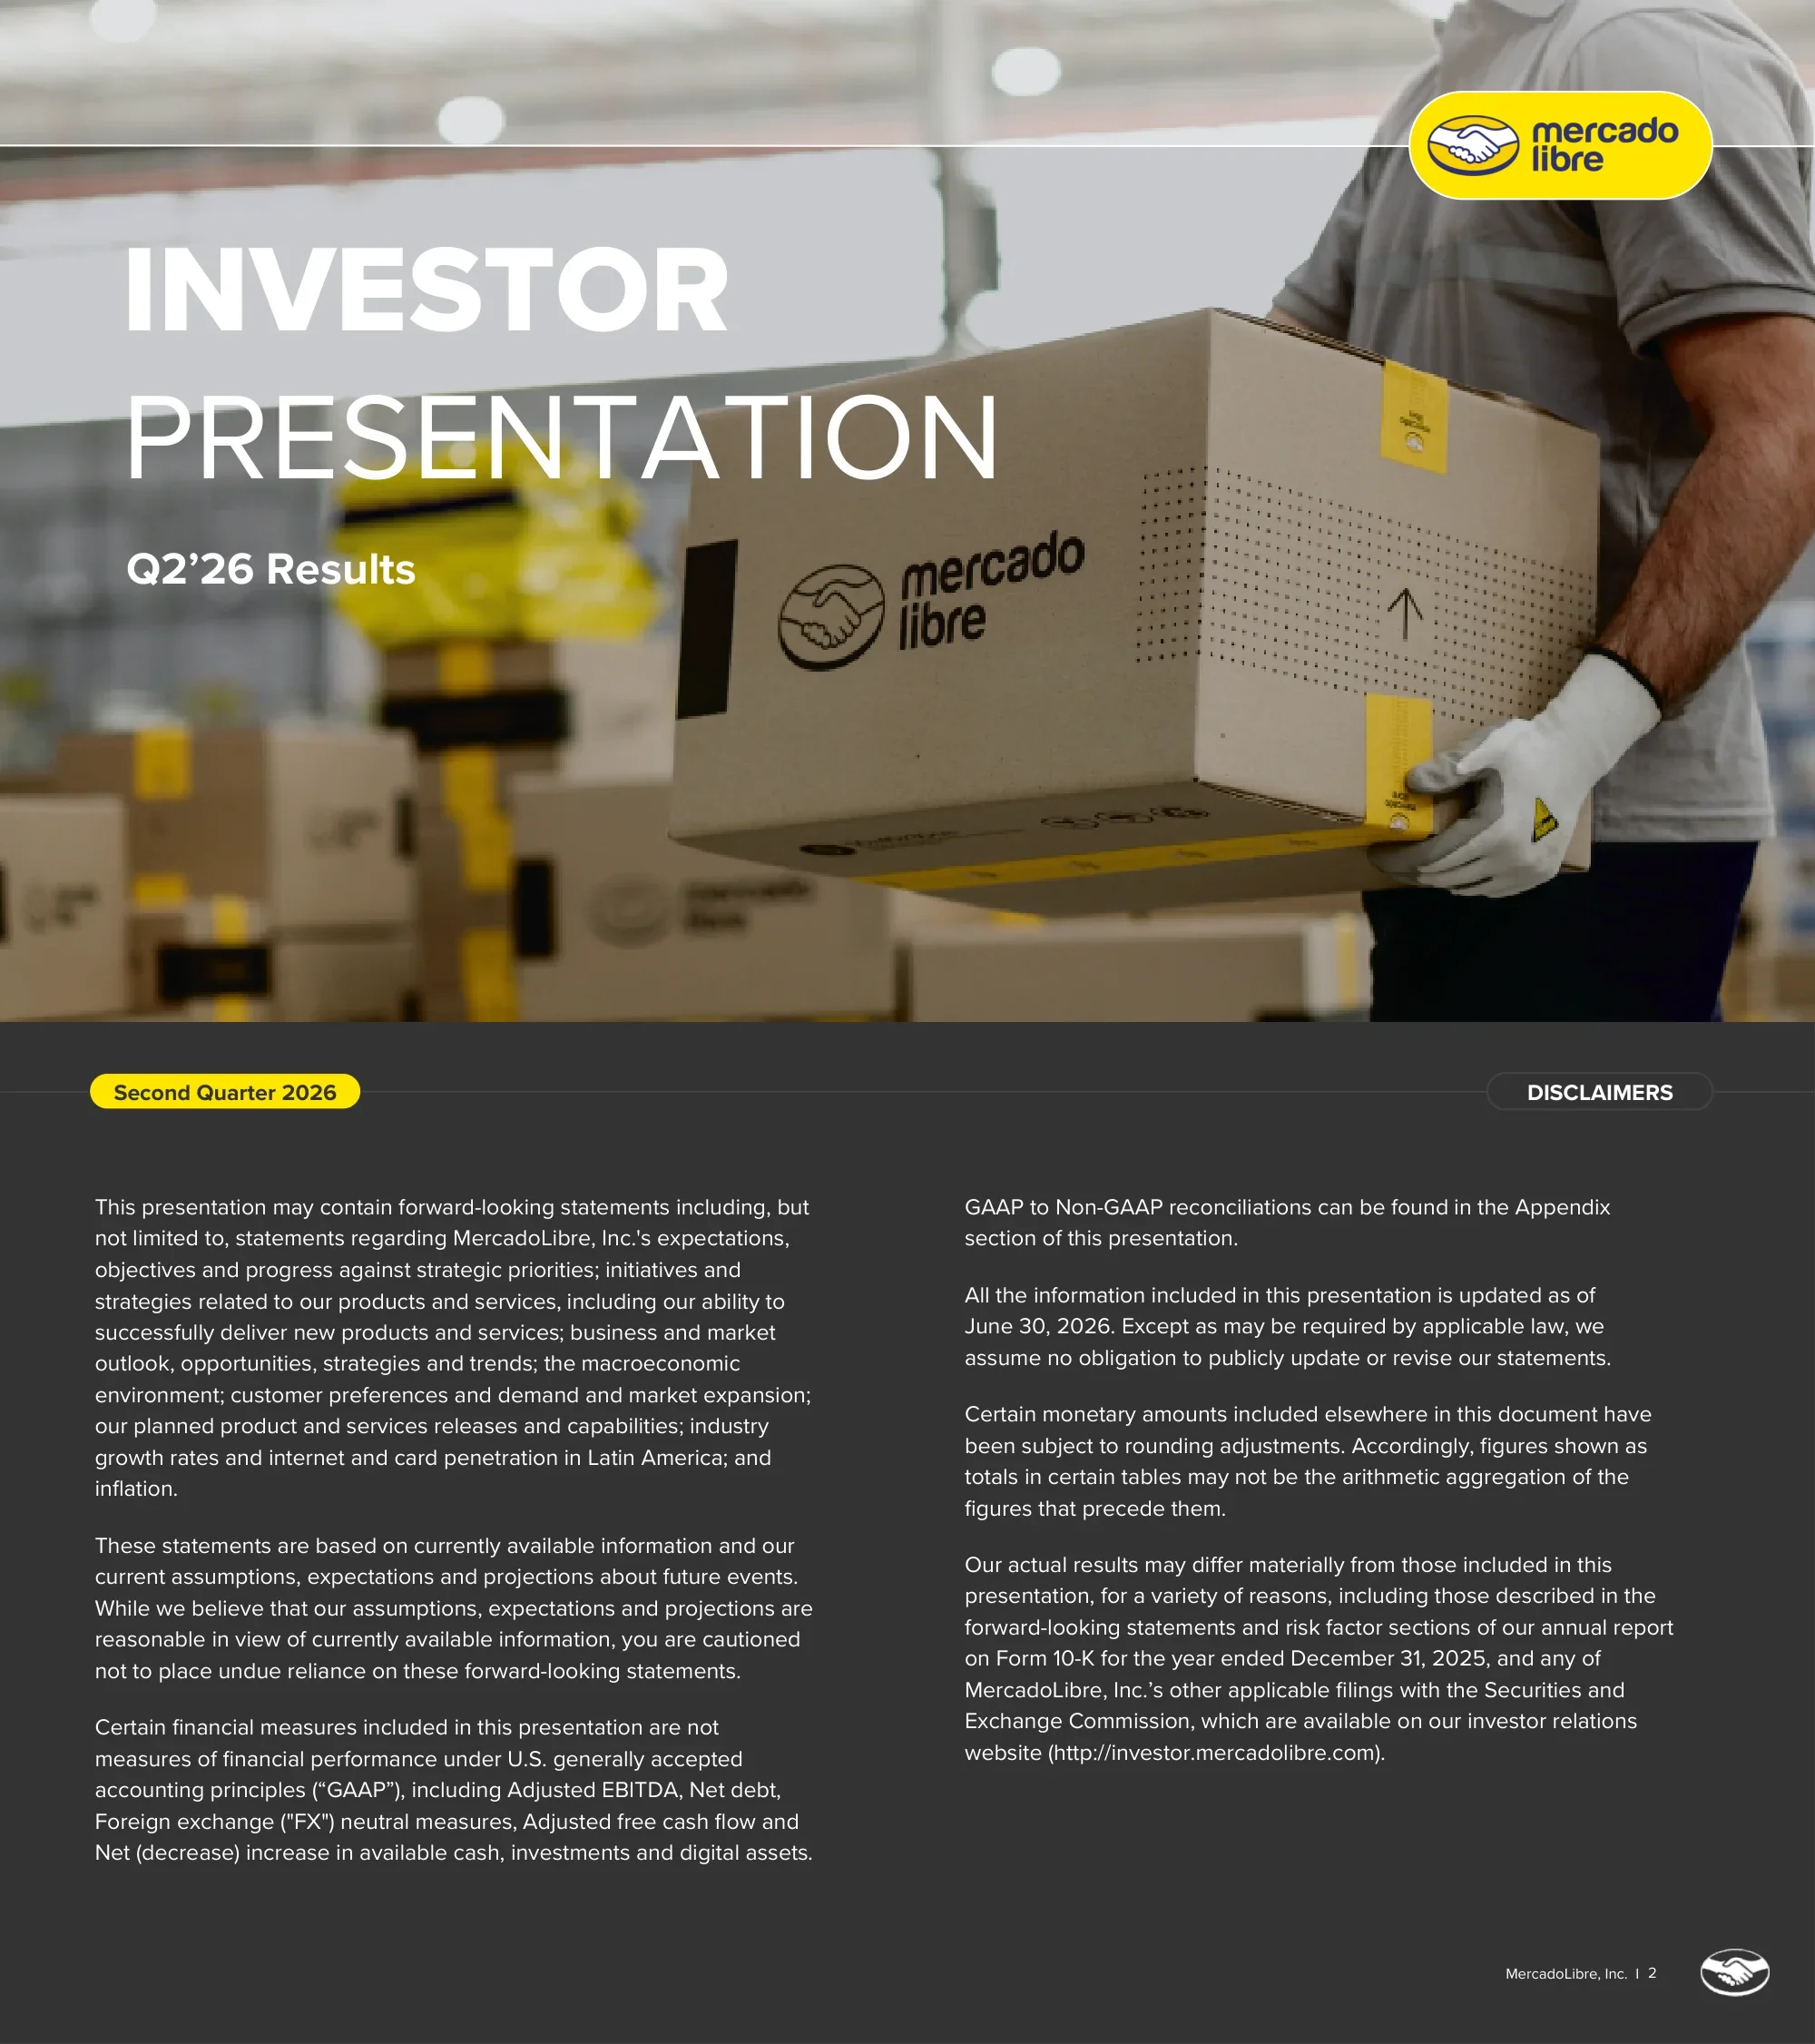
Cover slide announcing MercadoLibre's investor presentation for second-quarter 2026 results, with the yellow MercadoLibre logo badge in the top right.
Full-bleed warehouse photograph of a worker carrying a branded MercadoLibre shipping box; large white 'INVESTOR PRESENTATION' title stacked on the left with a small 'Q2'26 Results' subtitle and a thin horizontal rule across the top.
Forward-looking statements and non-GAAP disclaimer: lists non-GAAP measures used (Adjusted EBITDA, Net debt, FX-neutral measures, Adjusted free cash flow, Net increase in available cash, investments and digital assets), notes information is as of June 30, 2026, and refers to risk factors in the 2025 Form 10-K.
Charcoal background with yellow 'Second Quarter 2026' pill top left and outlined 'DISCLAIMERS' tag top right; two balanced columns of white body text; page number and handshake logo in the footer.
Promotes three investor resources: a podcast featuring Andre Chaves (Sr. VP & Country Head, Mercado Pago Brazil), the 2025 Impact Report, and the IR Newsletter for thought leadership.
Three equal cards in a row, each with an image on top (yellow podcast cover, yellow Impact Report cover, photo of a Mercado Pago card and POS terminal), a grey category pill and a large call-to-action ('Listen here', 'Access here', 'IR Newsletter') with a yellow arrow.
Announces a new long-form investor presentation ('We are Mercado Libre') that gives a comprehensive view of the company's trajectory, footprint and operations across Latin America and the avenues powering its growth.
Large rounded image card on the left showing a parcel handoff with the 'We are Mercado Libre — Investor Presentation' cover text; yellow-outlined text box on the right with a linked description.
Eight headline KPIs for Q2'26: GMV US$21.9BN (+44% YoY, +36% FXN), items sold 795.4MM (+45%), TPV US$101.0BN (+56%), credit portfolio US$16.4BN (+75%), net revenues and financial income US$10.2BN (+50%, +43% FXN), income from operations US$683MM (6.7% margin), net income US$466MM (4.6% margin), and adjusted free cash flow US$214MM.
White background with a 4x2 grid of rounded outlined KPI cards; each card has a small caps label, a very large bold figure, a divider line and growth or margin figures beneath.
Section divider opening the Quarterly KPIs section.
Yellow gradient background with a photo of a Mercado Pago Visa card tapping a smartphone showing a R$ 85,80 payment; a translucent pill-shaped label with a large '1.' numeral, 'QUARTERLY KPIs' text and a right arrow.
Unique active buyers grew 26% YoY to 89.3MM in Q2'26 (from 70.8MM in Q2'25), adding almost 19MM buyers, with the fastest growth in Brazil thanks to the compounding impact of a lower free-shipping threshold.
Yellow-outlined insight box on the left with bold headline and explanatory text; white rounded chart card on the right with five yellow bars (Q2'25–Q2'26) and a row of YoY growth pills (25%, 26%, 24%, 26%, 26%).
Growth remains strong in Brazil while weaker consumer demand in Argentina and Mexico slowed GMV growth. FX-neutral GMV growth in Q2'26: Argentina 38%, Brazil 39%, Mexico 26%, Other 40%, Consolidated 36%. Items sold growth: Argentina 22%, Brazil 56%, Mexico 34%, Other 44%, Consolidated 45%.
Bold headline sentence under the title; one wide white card containing two clustered bar charts side by side, each comparing Q2'25 (light grey), Q1'26 (dark grey) and Q2'26 (yellow) across five geographies.
Same and next day shipments reached 225MM in Q2'26, up 38% YoY from 163MM, as MercadoLibre continues to scale fast delivery across its logistics network.
Mirror of the buyer slide: white chart card on the left with five yellow bars and YoY pills (28%, 28%, 29%, 39%, 38%); yellow-outlined insight box on the right.
Items sold per unique active buyer rose 14% YoY to 8.9 units (7.8 in Q2'25, peaking at 9.0 in Q4'25), led by Brazil where items per buyer grew 19% YoY, showing strategic initiatives are driving engagement.
Insight box on the left; white card on the right with a yellow line chart with circular data markers and a YoY pill row (5%, 11%, 15%, 16%, 14%).
Fintech monthly active users grew 30% YoY to 88.0MM (from 67.6MM), driven by market-leading NPS in Brazil, Mexico, Argentina and Chile, with Brazil and Mexico growing MAU above the overall average.
White chart card on the left with five yellow bars and YoY pills (30%, 29%, 27%, 29%, 30%); yellow-outlined insight box on the right headed 'MAU growing 30% YoY'.
Assets under management grew 68% YoY to US$23,214MM and the credit portfolio grew 75% YoY to US$16,375MM. The portfolio mix in Q2'26 was 35% consumer, 47% credit card, 15% merchant and 2% asset-backed; originations reached US$15,931MM. A table lists Q2'26 average exposure per user (consumer 231, credit card 446, merchant 558, asset-backed 7,461) and duration in months (3.7, 2.6, 3.3, 18.9).
Bold headline sentence; wide white card with an AUM bar chart on the left and a 100%-stacked credit portfolio bar chart on the right (yellow, light grey, dark grey and black segments) with an originations row; a yellow-outlined exposure/duration table sits below.
NIMAL was 20.7% in Q2'26, improving sequentially from 17.8% as provisioning normalized in the Brazil consumer portfolio, with some YoY compression versus 23.0% due to a higher share of credit cards in the portfolio. Formula: credit revenues minus provision for doubtful accounts minus third-party funding costs.
Insight box on the left; white card on the right with five yellow bars labeled with percentages and a formula footnote beneath the chart.
Asset quality remained robust: the 15-90 day NPL ratio was 7.0% (close to historic lows) and the >90 day ratio 18.7%. Provision coverage stood at 104% for >15 days past due and 143% for >90 days past due.
Bold headline sentence; wide white card with two line charts side by side — past dues (yellow 15-90 days vs grey >90 days) and provision coverage (yellow >15 days vs grey >90 days) — each with labeled data points.
Acquiring TPV reached US$64.1BN in Q2'26 (Acquiring OFF 41.2BN, Acquiring ON 22.9BN), growing 42% YoY FX-neutral. By segment, FX-neutral growth was Argentina 52%, Brazil 32%, Mexico 47%, Other 29% and Consolidated 42%.
Bold headline sentence; wide white card with a stacked bar chart (grey ON on yellow OFF) plus YoY FXN pills on the left, and a clustered bar chart by country comparing Q2'25, Q1'26 and Q2'26 on the right.
Section divider opening the Financial Metrics section.
Yellow-to-olive gradient background with a smiling woman unboxing leather loafers from a MercadoLibre box printed 'Hola, ¡llegué! :)'; translucent pill label with large '2.' and 'FINANCIAL METRICS'.
Commerce net revenues were US$5,762MM in Q2'26 (services 4,301, product sales 1,461), up 40% YoY FX-neutral. The 3P take rate was broadly stable YoY, with higher shipping fees (mostly offsetting energy-price inflation) and advertising revenue offsetting strategic and commercial initiatives.
White chart card on the left with stacked bars (yellow services, grey product sales) and a thin FX-neutral growth line above (45%, 38%, 37%, 39%, 40%); yellow-outlined insight box on the right.
Fintech net revenues reached US$4,407MM in Q2'26 (financial services and income 2,113, credit revenues 2,278, fintech product sales 16), growing 47% YoY FX-neutral; the fintech take rate compressed 20 bps YoY, mainly due to the move upmarket.
Insight box on the left; white chart card on the right with three-segment stacked bars and an FXN growth line above (63%, 65%, 61%, 54%, 47%).
Margins were broadly stable QoQ, with YoY compression reflecting deliberate investments in engagement and long-term growth. Income from operations was US$683MM (6.7% margin vs 12.2% in Q2'25); net income was US$466MM (4.6% vs 7.7%).
Justified subtitle under the title; wide white card with two bar-plus-line charts side by side — yellow bars for absolute values and a thin grey line for margin percentage.
Waterfall bridge showing the operating margin falling 550 bps from 12.2% in Q2'25 to 6.7% in Q2'26: COGS (4.7)pp, bad debt (2.4)pp, sales and marketing (0.1)pp, offset by G&A +0.5pp and product development +1.2pp. Higher bad debt provisions relate mostly to 75% YoY credit portfolio growth, which added US$952MM of incremental revenue.
Full-width white card with a waterfall chart: yellow start and end bars, red negative steps, green positive steps, a bracket labeled '-550 bps' and a grey callout bubble explaining bad debt.
Waterfall bridge showing net income margin declining 310 bps from 7.7% to 4.6%: COGS + OPEX (5.5)pp and net interest income and expense (0.4)pp, partially offset by tax +1.5pp and foreign exchange +1.3pp.
Same waterfall layout as the previous slide with yellow endpoint bars, red and green steps and a '-310bps' bracket.
Q2'26 adjusted free cash flow of US$214MM: cash from operations 3,662 plus reconciliation adjustments 32, less restricted customer funds (1,479), capex (441) and net loans receivable (2,120), plus fintech funding 560. Available cash and investments moved from 6,597 to 6,751 (+154); total cash, restricted cash and investments from 18,810 to 20,559.
White card on the left with a horizontal waterfall (grey totals, yellow available cash, green inflows, red outflows) and a dotted bracket around the adjusted FCF components; yellow-outlined insight box on the right.
Debt breakdown and available cash over five quarters: Q2'26 net debt US$6,425MM, comprising fintech debt 8,269, commerce/corporate and other debt 2,357, operating lease liabilities 2,550, less available cash (6,751). Leverage was 1.65x net debt/Adj. EBITDA including fintech debt and -0.47x excluding it; excluding fintech debt the company would have a net cash position of US$1,844MM.
White card with stacked bars above a zero line (debt components) and dark bars below (available cash), red ovals marking net debt totals, and a leverage ratio table beneath; yellow-outlined 'Fintech Debt' box on the right.
Section divider opening the Revenue & Financial Factsheet section.
Reuses the cover's warehouse photo with a translucent pill label containing a large '3.' and 'REVENUE & FINANCIAL FACTSHEET'.
Table of Q2'26 vs Q2'25 net revenues by country and line: Brazil 5,530 vs 3,473, Mexico 2,337 vs 1,506, Argentina 1,839 vs 1,527, Others 463 vs 284, Total 10,169 vs 6,790. Total commerce revenues 5,762 vs 3,839 and total fintech revenues 4,407 vs 2,951, with footnotes defining each revenue category.
White background; wide data table with yellow pill column headers per country (2Q26 / 2Q25 sub-columns), grey shaded row labels, bolded subtotal rows and dense footnotes below.
One-page factsheet: volumes (GMV $21,926MM +35.8% FXN, items sold 795.4MM +44.6%, live listings 859.0MM +60.3%, managed network penetration 96.0%, TPV $100,952MM +56.2%, TPN 5,181MM, AUM $23,214MM +68.3%, credit portfolio $16,375MM +75.2%), users (89.3MM buyers, 88.0MM fintech MAU), P&L (net revenues $10,169MM +42.9% FXN, gross margin 40.9%, operating margin 6.7%, net income $466MM) and net revenues by segment for Brazil, Argentina, Mexico and other countries.
White background with three columns of compact two-value tables (value + growth), each headed by a yellow pill label: Volumes, Users and P&L, and Net Revenues per Segment.
Section divider opening the Appendix.
Yellow-to-dark gradient background with a smiling woman in a yellow polo working on a laptop next to a MercadoLibre box; translucent pill label with '4.' and 'Appendix'.
Glossary of KPI definitions: Commerce, Fintech, net income margin, operating margin, fintech monthly active users, unique active buyers, GMV, items sold, TPV, acquiring TPV, total payment transactions, assets under management, NIMAL, NPL ratio and FX-neutral methodology (noting food delivery transactions are included from Q2 2025).
Charcoal background with a large white rounded panel containing a two-column definition table (bold term on the left, small-print definition on the right).
Revenue YoY growth for the three months ended June 30, 2026 in USD vs FX-neutral: Commerce 50% vs 40%, Fintech 49% vs 47%, Total MELI 50% vs 43%.
Charcoal background with a centered white card holding a small three-row table and yellow pill column headers for USD and FX Neutral.
FX-neutral reconciliation: as reported net revenues $10,169MM vs $6,790MM (+49.8%) and FX-neutral $9,701MM (+42.9%); gross profit 4,159 vs 3,094 (+34.4%) or 4,017 FX-neutral (+29.8%); income from operations $683MM vs $825MM (-17.3%) or $701MM FX-neutral (-15.0%).
Wide white card with grouped yellow pill headers ('As reported' and 'FX Neutral Measures', each with 2026/2025 and percentage change) and grey row labels.
Adjusted EBITDA bridge from net income: $466MM in Q2'26 plus D&A 292, interest income (30), interest expense 62, FX losses 45 and income tax 140 equals Adjusted EBITDA of $975MM, versus $1,024MM in Q2'25.
Centered white card with a single reconciliation table, yellow 2026/2025 pill headers and double-underlined Adjusted EBITDA total.
Net debt as of June 30, 2026 vs December 31, 2025: total debt $13,176MM vs $11,392MM (current and non-current loans payable, operating lease liabilities), less cash, short-term and long-term investments of $6,751MM vs $6,710MM, giving net debt of $6,425MM vs $4,682MM.
White card with a balance-sheet style table, date pills as column headers, a 'Less:' sub-section and footnotes describing exclusions.
Reconciliation from cash from operations to adjusted free cash flow and net increase in available cash for six months and three months ended June 30: Q2'26 adjusted FCF $214MM vs $454MM; H1'26 $158MM vs $512MM; net increase in available cash $154MM in Q2'26 and $41MM in H1'26; net cash used in investing (2,691) and provided by financing 630 in Q2'26.
Large white card with a dense four-column table (six months and three months, 2026 and 2025) under yellow pill headers, grey highlighted key rows and footnotes.
Closing slide with Investor Relations contact details: investor@mercadolibre.com and http://investor.mercadolibre.com.
Full-bleed photo of hands holding a phone showing the Mercado Libre app with a yellow 'Todo para tu cocina — 40% OFF, 6 cuotas sin interés' promo; yellow rounded contact box in the bottom left and logo pill in the top right.
このスライドと基礎となるプレゼンテーションコンテンツに関する一般的な質問。
It is MercadoLibre's 34-page quarterly results deck for the period ended June 30, 2026. It covers headline KPIs, marketplace metrics (buyers, GMV, items sold, fast shipping), Mercado Pago fintech metrics (MAU, AUM, credit portfolio, NIMAL, NPLs, acquiring TPV), financial metrics (commerce and fintech revenue, margins, margin bridges, adjusted free cash flow, net debt), a revenue factsheet by country and a non-GAAP appendix.
According to the deck, GMV was US$21.9BN (+36% FX-neutral), items sold 795.4MM (+45%), TPV US$101.0BN (+56%), credit portfolio US$16.4BN (+75%), net revenues and financial income US$10.2BN (+50% USD, +43% FX-neutral), income from operations US$683MM (6.7% margin), net income US$466MM (4.6% margin) and adjusted free cash flow US$214MM.
The waterfall on page 20 shows a 550 bps drop from 12.2% to 6.7%, driven mainly by higher COGS (-4.7pp) and bad debt (-2.4pp). Management attributes the higher bad debt mostly to 75% YoY growth in the credit portfolio, which generated US$952MM of incremental revenue, and frames the compression as deliberate investment in engagement and long-term growth.
Yes. The gallery page offers the original PDF and an editable PPTX version converted from it, so you can reuse layouts such as the KPI card grid, five-quarter bar charts with YoY pills, waterfall bridges and factsheet tables in your own deck.
It uses MercadoLibre's brand yellow on charcoal backgrounds, white rounded chart cards, yellow pill labels for chart titles and periods, yellow-outlined commentary boxes, and photographic section dividers with a translucent pill-shaped section label. Charts use yellow for the current series and greys for comparisons, with red and green for waterfall deltas.
Yes. It shows how to present a two-sided business — a marketplace and a payments/credit platform — with a consistent chart grammar, how to disclose credit quality (NPLs, coverage, NIMAL, exposure and duration), and how to bridge margin changes year over year. Founders and IR teams can adapt the structure for their own quarterly updates.
Brazil, Mexico, Argentina and Other countries. Country-level data appears for GMV growth, items sold growth, acquiring TPV growth, and net revenues split into commerce and fintech; Brazil was the largest market with US$5,530MM of Q2'26 net revenues.
The deck was published on MercadoLibre's investor relations website (investor.mercadolibre.com), and the closing slide lists investor@mercadolibre.com as the Investor Relations contact. Figures are as reported by the company as of June 30, 2026.

Create Your Own Slides
Turn your ideas into professional presentations in seconds with 2slides AI.
プロフェッショナルなデザインを参照し、スタイルを選択し、完璧なテキストレンダリングでスライドを生成。Nano Banana搭載—今すぐプレゼンテーションの作成を始めましょう。
© 2026 2slides。全著作権所有。


