
Hluti af safninu Dæmi um fjárfestakynningar · Dæmi um japanskar fjárfestakynningar
Toho Co., Ltd. (TSE 9602) H1 FY2026 earnings presentation — the 111-page Japanese-language interim results deck (決算説明資料) for the second quarter (interim period) of the fiscal year ending February 2027, covering March 1 to August 31, 2026, dated October 15, 2026 and filed on TDnet.
Notar forsíðu þessarar kynningar sem stílfyrirmynd fyrir glærur úr þínu eigin efni. Eða veldu hvaða síðu sem er hér fyrir neðan og notaðu uppsetningu hennar sem fyrirmynd.
Flýtileiðsögn
Merki
Deila glærunum
Toho Co., Ltd. (TSE 9602) H1 FY2026 earnings presentation — the 111-page Japanese-language interim results deck (決算説明資料) for the second quarter (interim period) of the fiscal year ending February 2027, covering March 1 to August 31, 2026, dated October 15, 2026 and filed on TDnet.
Ítarleg sýn á hverja glærusíðu, þar á meðal útlit, lykilefni og sjónræna þætti.
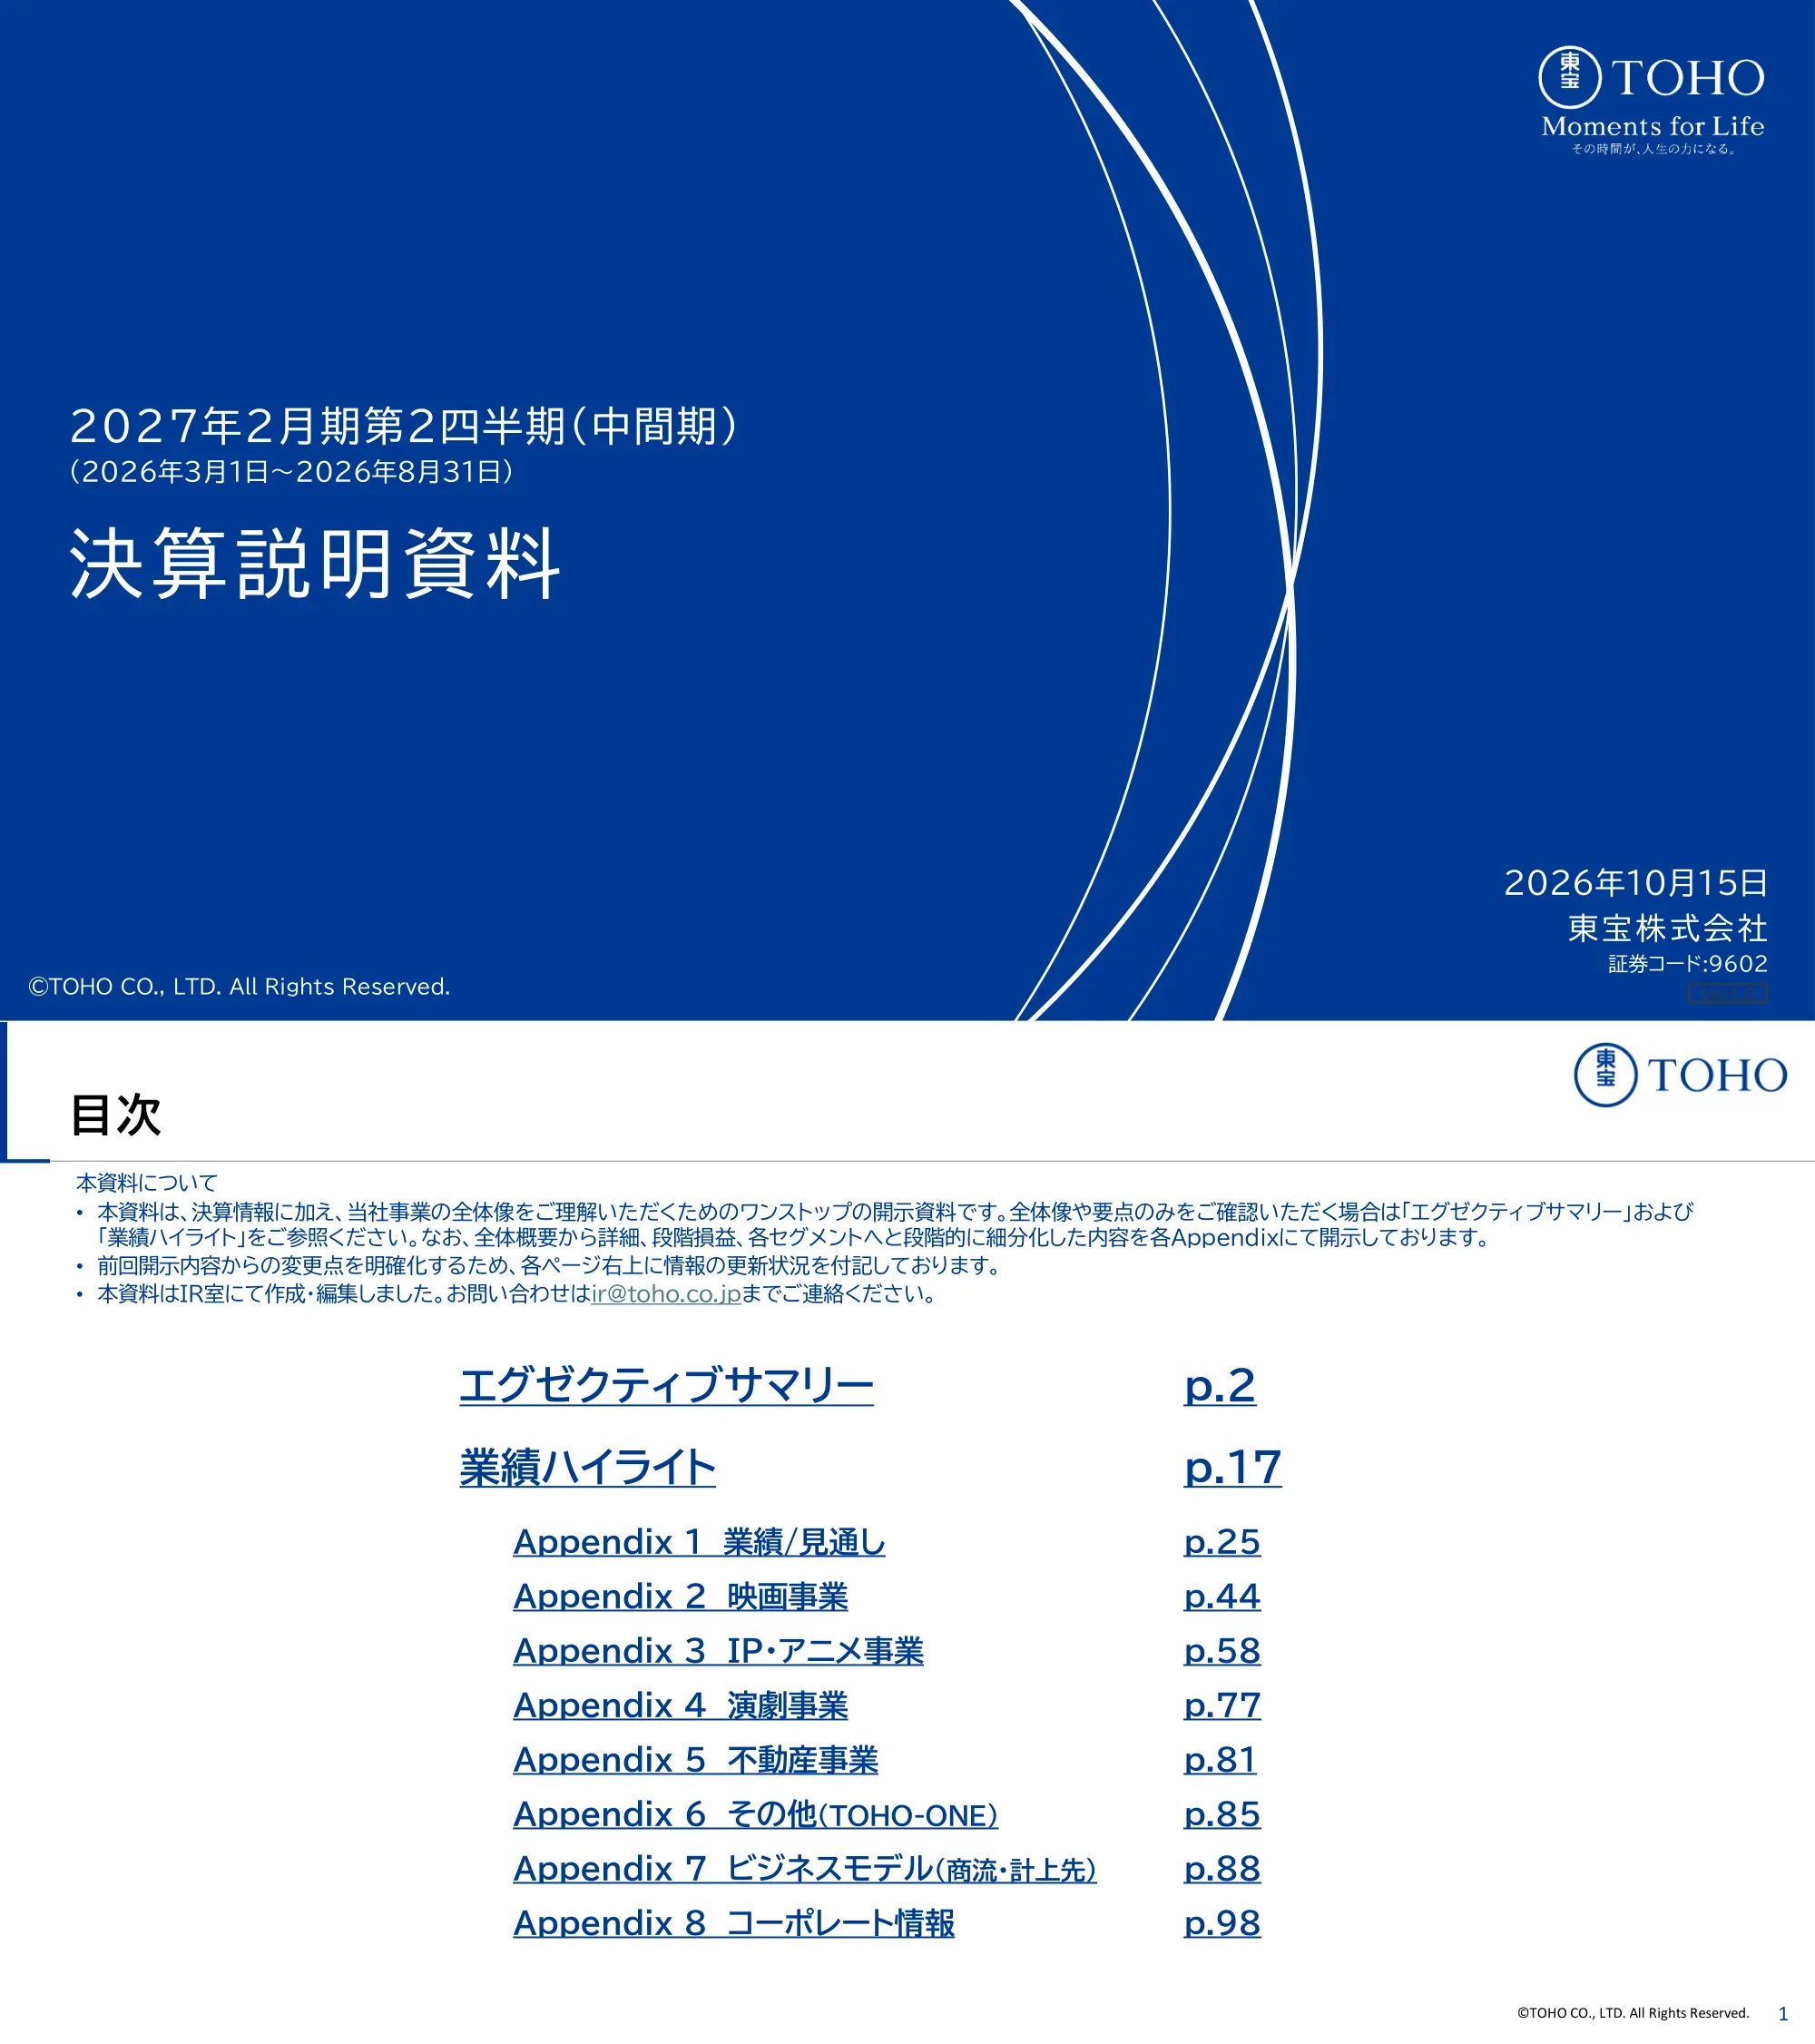
Cover of Toho's 決算説明資料 for Q2 (interim) of the fiscal year ending February 2027, covering March 1 to August 31, 2026, dated October 15, 2026, with securities code 9602.
Full-bleed royal blue background, left-aligned white title block in the middle, sweeping thin white arc lines on the right, logo top right and date/company block bottom right.
Explains that the deck is a one-stop disclosure: the Executive Summary (p.2) and Business Highlights (p.17) give the overview, while Appendices 1–8 cover results/outlook, film, IP & anime, theatre, real estate, other (TOHO-ONE), business model and corporate information; update status is tagged on each page.
White page with a title and short note block at top, followed by a centered two-column list of underlined section names and hyperlinked page numbers.
Divider slide opening the executive summary section.
Full-bleed royal blue slide with a large white section title on the left and one large white arc.
H1 operating revenue was ¥185.1 billion and operating profit ¥30.9 billion: the film and IP & anime businesses held up despite last year's mega-hits and timing effects from the TOHO Global split. The full-year operating profit forecast of ¥62.0 billion is unchanged and net profit is raised by ¥7.0 billion to ¥48.0 billion; topics include the November worldwide release of 'Godzilla Minus Zero', property sales and the partial sale of cross-shareholdings on September 15.
Two stacked rows, each with a solid blue label block on the left and a bordered text panel on the right, with key phrases bolded in blue.
Operating revenue ¥185,162 million (-3.4%), gross profit ¥83,083 million (-1.9%), SG&A ¥52,144 million (+19.8%), operating profit ¥30,938 million (-24.8%), ordinary profit ¥33,127 million (-21.5%) and interim net profit ¥20,019 million (-40.2%). Callouts attribute the declines to last year's 'Demon Slayer' and 'Kokuho' hits, the company split, one-off costs, overseas investment and the absence of last year's share-sale gains.
Full-width P&L comparison table with the current period column framed in bold blue, plus light-blue callout notes on the right linked to rows.
Film revenue ¥91,177 million and profit ¥19,400 million (margin 21.3%); IP & Anime revenue ¥43,132 million (+¥5,818 million) but profit ¥5,970 million (margin 13.8%); Theatre ¥9,589 million / ¥845 million; Real Estate ¥40,008 million / ¥9,895 million; Other ¥1,254 million / -¥207 million. Donut charts show Film at 49.2% of revenue and 54.0% of operating profit.
Segment table with icons and driver comments on the left, two donut charts for revenue and profit mix on the right.
Distribution was lifted by 'Detective Conan', 'Chiikawa' and Hollywood hits; TOHO Cinemas revised ticket prices from July and opened Oimachi (March) and Nagoya Sakae (June). The FY2/2027 forecast for Toho-distributed box office was raised to ¥95–105 billion (excluding 'Godzilla Minus Zero' overseas), with 48 Toho-distributed titles versus 44 last year, against a national box office of ¥250–260 billion.
Bullet text top left, forecast comparison table bottom left, grid of film posters and live-action stills on the right.
The film opens in Japan on November 3 and in North America on November 6, rolling out to about 80 countries through Toho's own overseas network (GKIDS, Anime Limited, Toho Entertainment Asia). It is the first Japanese film 'Filmed For IMAX'; trailers had over 5.3 million domestic and 13 million overseas views, and it scored 95% on Rotten Tomatoes from 41 reviews. A table compares it with 'Godzilla Minus One' (about ¥16 billion global box office).
Two pill-headed columns for domestic and overseas plans, comparison table bottom left, event photo center and key poster on the right.
Neoshoko's 'Phantom Busters', serialized in Shueisha's Jump SQ. with 1.4 million copies in circulation, will be a TV anime in 2027. The title ranked 2nd in the 2025 bookstore staff picks and 4th in the 2025 'manga we want animated' ranking, and has a large overseas fan base.
Bullet points with bold headers on the left, boxed story synopsis below, manga cover art on the right.
Film revenue reached ¥47,795 million in Q2 FY2/2027, helped by 'Chiikawa', against a peak of ¥63,434 million in Q2 a year earlier from 'Demon Slayer' and 'Kokuho'. IP & Anime revenue jumped to a record ¥24,877 million in Q2 on anime streaming income and pamphlet and theatre merchandise sales.
Two side-by-side stacked bar charts covering ten quarters, with legends and callout bubbles above peak bars.
Q2 revenue was ¥24.9 billion (about ¥23.3 billion on the pre-split basis) with anime streaming up ¥4.0 billion and pamphlet/merchandise sales up ¥1.8 billion YoY. Q2 operating profit was ¥5.4 billion (about ¥3.9 billion pre-split), held back by a ¥1.4 billion one-off contingent-consideration cost and ¥1.1 billion more overseas SG&A investment.
Three summary bullets on top, two bar charts below (revenue and operating profit) comparing accounting basis with dashed pre-split outlines, plus boxed driver notes.
Since March 2026 overseas revenue is booked directly by TOHO Global, which closes its books in December while Toho closes in February, so the last two months of each quarter's overseas income move into the next quarter while related payouts are booked immediately. The shift grew because overseas anime streaming surged, especially in May and August.
Bullet summary on top, month-by-month timeline diagram comparing pre- and post-split revenue and cost bars, and a comparison table on the right.
Toho plans to move from offering viewing experiences to multi-experience IP businesses by widening both the regions it covers (North America, Asia, Europe, other emerging markets) and its own value chain (film distribution, video licensing, merchandising, games, own products, live stage). Film distribution and video licensing are progressing well; other value-chain links come next.
Matrix heat-map with regions as rows and value-chain stages as columns, gradient shading showing progress, and a summary bullet panel on the right.
The TOHO-ONE membership service, launched in March 2026, grew from 1 million to 1.6 million, 2 million and 3 million members by end-August as former Cinemileage members migrated. Toho is adding studio tours, member-only performances and a 'ONE's VOICE' feedback channel, with a 'Godzilla Minus Zero' tie-up from Q3.
Bar chart of membership growth on the left, two event photos and explanatory text on the right.
After reviewing about 130 properties under the Medium-term Management Plan 2028, Toho began selling seven regional and suburban properties with a combined book value of ¥1.43 billion, expecting about ¥300 million of gains across Q2–Q4, with more sales planned this year. Freed-up resources will go to core-property rents and group synergies.
Lead statement, checkmarked bullets on the left, grey box listing the seven properties on the right, and a blue concluding arrow statement.
The September 15 sale cut the balance-sheet value of policy shareholdings by about ¥14.3 billion (¥11.1 billion extraordinary gain in Q3). The target is to reduce them by more than ¥50 billion and below 10% of consolidated net assets by FY2/2030, and below 20% by FY2/2027; holdings were ¥109,204 million across 10 listed names at end-FY2/2026.
Target statement in a peach-shaded band, combo chart of balance-sheet value bars and number-of-holdings line, with dashed 20% and 10% target lines.
Stable IP & Anime, Theatre and Real Estate businesses absorb entertainment volatility, while film hits supply upside. Operating profit was ¥64.6 billion in FY2/2025 and ¥67.8 billion in FY2/2026, with a 2032 target of ¥75–100 billion; IP & Anime operating profit should grow more than 200% from about ¥22 billion to ¥44.4 billion or more.
Three bullets on top, layered wave diagram of the four businesses on the left with circular arrows, and a stacked bar chart of IP & Anime profit on the right.
Divider slide opening the business highlights section with segment results, the forecast and shareholder returns.
Full-bleed royal blue slide with a white section title and white arc line.
Film revenue fell from ¥103,709 million to ¥91,177 million and profit from ¥23,193 million to ¥19,400 million as the 'Demon Slayer' and 'Kokuho' comparison base faded and staff and depreciation costs rose. Exhibition revenue rose to ¥55,155 million; Q2 box office at TOHO Cinemas was ¥23,074 million with 14.23 million admissions, and Netflix rights income for 'The Gas Human' helped.
Stacked bar comparison on the left, quarterly sub-segment table on the right, and seven numbered driver boxes below.
Segment revenue rose from ¥37,313 million to ¥43,132 million on overseas streaming and merchandise sales, while operating profit fell from ¥10,698 million to ¥5,970 million. Q2 revenue was ¥24,877 million with a 21.9% margin after 2.8% in Q1; segment SG&A reached ¥7,064 million in Q2.
Bar chart on the left, quarterly table with disaggregated revenue on the right, ten numbered driver boxes below.
Theatre revenue fell from ¥10,698 million to ¥9,589 million and profit from ¥997 million to ¥845 million. Productions at Theatre Creation and outside venues did well, but last year benefited from the 'Knights' Tale' arena live and 'Les Misérables'; Q2 had 141 performances.
Bar chart on the left, quarterly table top right, blue-banner YoY analysis text bottom right.
Real estate revenue rose from ¥39,314 million to ¥40,008 million, but profit fell from ¥10,463 million to ¥9,895 million as last year's price-slide adjustment in the road business dropped out. Leasing stayed steady at ¥18,759 million, road revenue rose to ¥15,163 million on bridge repair work, and maintenance revenue grew to ¥6,085 million.
Stacked bars by sub-segment on the left, quarterly table on the right, three labelled analysis rows below.
Other revenue rose from ¥641 million to ¥1,254 million on new TOHO-ONE membership fees, but it posted a ¥207 million loss because of point-program promotion costs. Corporate adjustments widened from -¥4,278 million to -¥4,965 million on TOHO-ONE depreciation and IT outsourcing.
Two stacked sections, each with a small bar chart on the left and a quarterly table plus explanation on the right.
Forecasts of revenue ¥345,000 million, operating profit ¥62,000 million and ordinary profit ¥67,000 million are unchanged; net profit attributable to owners of the parent rises ¥7,000 million (+17.1%) to ¥48,000 million to reflect the Q3 cross-shareholding sale. FY2/2026 actuals were revenue ¥360,663 million, operating profit ¥67,889 million and net profit ¥51,768 million.
Two-line summary, forecast table with the revised column framed in blue, and a grey reference column for the prior-year actuals.
The FY2/2026 dividend was ¥22.0 per share (payout 35.9%, total return ratio 64.7%), and FY2/2027 is projected at ¥22.0 (¥11.0 interim plus ¥11.0 year-end). The Medium-term Plan 2028 sets a ¥17 annual floor and a payout ratio of 35% or more, plus flexible buybacks; the FY2/2027 column shows ¥11.86 billion of share buybacks and the cancellation of 30 million shares.
Stacked bar chart of interim and year-end dividends over 11 years with a data table underneath and a highlighted plan box for the latest two years.
Divider slide opening Appendix 1 on detailed results and outlook.
Full-bleed royal blue slide with a white appendix title and white arc line.
Revenue bridge from ¥191.6 billion to ¥185.1 billion (-¥6.5 billion): Film -¥12.5 billion, IP & Anime +¥5.8 billion, Theatre -¥1.1 billion, Real Estate and Other +¥0.6 billion each. Operating profit bridge from ¥41.1 billion to ¥30.9 billion (-¥10.2 billion), led by IP & Anime -¥4.7 billion and Film -¥3.7 billion.
Two side-by-side waterfall charts under blue pill headers, with circled total-change labels and sub-segment callout boxes.
Quarterly revenue from FY2/2022 to Q2 FY2/2027 peaked at ¥106,799 million in Q2 FY2/2026; Q2 FY2/2027 was ¥96,419 million with an overseas sales ratio of 12.3%. The overseas ratio for FY2/2026 as a whole was 10.1%, and a side panel lists each quarter's main drivers.
Grey bar chart with current-comparison quarters in navy, overseas-ratio line overlay, and a right-side table of quarterly drivers.
Overseas sales rose from ¥31,146 million in FY2/2025 to ¥36,466 million in FY2/2026 (9.9% to 10.1% of total). North America contributed ¥26,342 million (72.2%), Asia ¥8,945 million (24.5%) and other regions ¥1,178 million (3.2%).
Stacked bar chart with ratio line on the left, regional mix table with the latest year framed in blue on the right.
Gross profit by quarter from FY2/2023 to Q2 FY2/2027: Q2 FY2/2027 was ¥44,433 million with a 46.1% gross margin, up from 43.6% in Q1 and close to the ¥44,607 million of Q2 FY2/2026.
Navy column chart with white value labels inside bars and a margin line with square markers above.
Total depreciation (excluding goodwill) rose to ¥3,953 million in Q2 FY2/2027 from ¥3,408 million a year earlier. Film depreciation rose to ¥1,258 million, IP & Anime to ¥467 million, and corporate adjustments to ¥315 million on TOHO-ONE.
Two quarterly tables side by side: grey-headed prior year and navy-headed current year with unfilled quarters greyed out.
SG&A rose to ¥27,363 million in Q2 FY2/2027 (28.4% of revenue), from ¥22,799 million a year earlier, with personnel costs of ¥8,404 million and 'other' costs of ¥11,357 million. A note attributes the QoQ rise in 'other' to one-off contingent-consideration costs.
Stacked column chart by cost type across 18 quarters with an SG&A-ratio line and a callout box.
Operating profit was ¥13,869 million in Q1 and ¥17,069 million in Q2 FY2/2027 (17.7% margin), against ¥21,807 million in Q2 FY2/2026. A side panel lists drivers by quarter, including one-off costs and overseas investment in Q2.
Grey and navy column chart with margin line, plus a right-side driver table for each quarter.
Margin history from FY2/2022 to Q2 FY2/2027: the company-wide margin was 17.7% in Q2 and 16.7% for H1. Film was 20.5% in Q2, IP & Anime 21.9%, Theatre 10.0% and Real Estate 22.2%, with leasing at 33.8%.
Dense margin table with navy fiscal-year headers, a blue frame around the current quarter, and footnotes on segment changes.
Maps the IP & Anime organization (TOHO animation, Rights/Godzilla divisions, TOHO Global) to revenue elements. TOHO animation H1 revenue rose ¥3,312 million to ¥24,775 million (about ¥30,104 million on the pre-split basis), with streaming at ¥14,545 million; segment disaggregation totals ¥43,132 million, including licensed video use at ¥19,207 million.
Organization boxes top left, domestic/overseas element map top right, and two linked tables at the bottom joined by arrows.
H1 streaming revenue rose 27.2% to ¥14,545 million (58.7% of the total) on 'Jujutsu Kaisen', 'Snowball Earth' and 'Dorohedoro', while character licensing fell 19.5% to ¥4,066 million. Domestic revenue was ¥14,647 million (+9.0%) and overseas ¥10,128 million (+26.1%), or 40.9% of the mix.
Source revenue table with the current column framed in blue and driver comments, followed by a second table for domestic vs overseas.
Quarterly TOHO animation revenue from FY2/2023: ¥9,287 million in Q1 and ¥15,487 million in Q2 FY2/2027 (¥16,102 million and ¥14,002 million on the pre-split basis). Q2 streaming was ¥9,677 million, and archive titles made up 83.7% of streaming revenue.
Stacked column chart with two overlaid ratio lines, dashed outlines for pre-split figures, and a full data table beneath.
Overseas streaming revenue hit a record ¥7,349 million in Q2 FY2/2027, putting H1 overseas streaming at ¥9,005 million versus ¥12,563 million for all of FY2/2026. Domestic streaming in H1 was ¥5,540 million; character licensing in H1 was ¥2,905 million domestic and ¥1,160 million overseas.
Two blue-pill panels (streaming and character licensing), each with domestic and overseas stacked yearly bars and a quarterly table underneath.
Non-operating income rose to ¥3,497 million in H1 (+¥1,349 million), mainly on dividends received of ¥2,704 million. Non-operating expenses were ¥1,308 million, including ¥1,225 million of equity-method losses, which rose because of FIFTH SEASON.
H1 comparison table with drivers on the left and a quarterly table on the right, current period framed or headed in navy.
There was no extraordinary income in H1, versus ¥8,913 million of share-sale gains (Marui Group, IMAGICA GROUP) a year earlier. Extraordinary losses rose to ¥1,256 million, mainly ¥1,177 million of demolition costs for a real-estate project in Chiyoda Ward.
H1 comparison table on the left and quarterly table on the right, mirroring the previous page.
Total assets rose from ¥702,934 million to ¥716,641 million at end-August 2026, and net assets from ¥532,990 million to ¥541,635 million; the equity ratio was 73.1%. Investment securities stood at ¥172,384 million, and shareholders' equity fell slightly after ¥11,866 million of buybacks and ¥11,332 million of dividends.
Balance-sheet table with the August column framed in blue and a wide notes column explaining changes.
Work in progress rose to ¥19,449 million at end-Q2 FY2/2027 from ¥15,490 million a year earlier. Film WIP was ¥8,381 million and IP & Anime ¥10,903 million.
Two quarterly tables side by side, grey header for the prior year and navy header for the current year.
H1 operating cash flow was ¥19,144 million, investing cash flow -¥4,489 million (including ¥52,000 million from securities sales and ¥11,263 million of contingent-consideration settlement), and financing cash flow -¥23,928 million from buybacks and dividends. Cash and equivalents fell ¥8,891 million to ¥77,792 million.
Single-period cash flow table with the value column framed in blue and a wide breakdown column.
Full-year plan of revenue ¥345,000 million and operating profit ¥62,000 million by segment: Film revenue ¥165,800 million and profit ¥33,000 million, IP & Anime ¥84,100 million / ¥22,000 million, Theatre ¥15,300 million / ¥2,000 million and Real Estate ¥75,700 million / ¥18,000 million. The plan does not include the ticket-price change, property and share sales (upside) or part of the company-split effect (downside), but does include ¥2 billion of demolition costs.
Summary forecast table on the left, light-blue assumptions panel below it, and arrows into two segment tables on the right.
Divider slide opening Appendix 2 on the film business.
Full-bleed royal blue slide with a white appendix title and large white arc.
There are 48 titles as of October 15: 7 Toho-led, 27 co-investments and 12 TOHO NEXT. The list ranges from 'Golden Kamuy' (March 13) and 'Detective Conan' (April 10) to 'Godzilla Minus Zero' (November 3) and 'The Apothecary Diaries' (December 11), with 2027-and-later titles such as 'Doraemon', 'Haikyu!!' and 'Pokémon'; checkmarks mark lead titles and those above ¥1 billion box office.
Two dense tables of title, release date and checkmark columns with navy headers; underlines mark updates since the Q1 deck.
A poster gallery of 13 upcoming Toho releases from October 2026 to February 2027, including 4K remasters of Studio Ghibli titles, 'Godzilla Minus Zero' (November 3), 'The Apothecary Diaries: The Lost Consort's Treasure' (December 11), 'Kaiji' (January 29) and 'Leviathan' (February 11).
Two-row grid of movie posters with blue captions giving title and release date.
The TOHO NEXT label (film segment) handles concert films and live viewings such as ONE OK ROCK and SUPER BEAVER. GKIDS (IP & Anime segment) distributes titles in North America including 'Kiki's Delivery Service', Studio Ghibli Fest 2026, 'Your Name.', '5 Centimeters Per Second' and 'Godzilla Minus Zero' (November 6).
Two side-by-side lineup tables with navy headers; GKIDS titles are set in italics.
Domestic distribution of foreign films, mainly by Toho-Towa, covering Universal titles ('Wicked: For Good', 'The Super Mario Galaxy Movie', 'Minions & Monsters'), Paramount titles ('Scream 7', 'Street Fighter') and Warner Bros. titles ('Dune: Part Three', 'Harry Potter' 25th anniversary).
Three navy-headed tables grouped by studio, with release dates and distributor URLs.
As of end-September, 'Chiikawa the Movie' led Toho titles with ¥16.95 billion (169.5億円), followed by 'Detective Conan' at ¥13.70 billion, 'Kingdom' at ¥6.84 billion and 'Crayon Shin-chan' at ¥2.84 billion. Among Toho-Towa titles, 'The Super Mario Galaxy Movie' made ¥7.94 billion.
Two ranked tables of title, release date and box office in ¥100 million units, with navy headers.
The Toho group's domestic distribution box office reached ¥160.5 billion in 2025 (Toho ¥143.84 billion), or 57.9% of Japan's ¥274.4 billion national total. Quarterly admissions in the exhibition division were 14.229 million in Q2 FY2/2027, helped by 'Chiikawa'.
Two panels under blue pill headers: a stacked bar plus share-line chart on the left and a grey quarterly admissions bar chart on the right.
Monthly box office for 2024–2026 shows the 2Q (June–August) totals: ¥30.82 billion in FY2/2027 against ¥64.25 billion a year earlier. Q1 was ¥38.99 billion versus ¥33.07 billion; Toho's own share was ¥29.12 billion in Q1 and ¥25.78 billion in Q2.
Grouped monthly bars for three years with the Q2 months highlighted in blue, plus a summary table at top right.
Box office at TOHO Cinemas and other group theaters was ¥19.28 billion in Q1 and ¥23.07 billion in Q2 FY2/2027, versus ¥17.62 billion and ¥25.50 billion a year earlier. August 2026 was ¥9.79 billion.
Grouped monthly bar chart for three years with June–August highlighted, plus a quarterly summary table at top right.
TOHO Cinemas runs 79 sites with 743 screens in Japan and holds just under 30% of national box office (2025); OS Cinemas Mint Kobe and Kobe Harborland joined the group in October 2026. Adult ticket prices are ¥2,000–2,200 after the July 2026 revision, with premium surcharges listed.
Bullets on top, ticket-price table and map of Japan with cinema markers on the left, and two dense site tables on the right with new sites shaded peach.
TOHO Cinemas Nagoya Sakae opened June 11, 2026 with 10 screens and 1,655 seats, including the area's first IMAX laser theater, and targets 1 million visitors a year. TOHO Cinemas Oimachi opened March 28, 2026 with 8 screens and 1,205 seats and the chain's first Dolby Cinema in Tokyo, targeting more than 700,000 visitors a year.
Two horizontal rows, each with an interior photo on the left and a blue-bordered text box on the right.
Released July 24, 2026, the film became 2026's top-grossing release, passing ¥17.0 billion in 11 weeks to October 8 (¥17.24 billion cumulative). Fans who name it as a favorite brand nearly doubled to 1.99 million; merchandise set a record for Toho-distributed titles, and IP & Anime 'product sales' rose ¥1.8 billion (32.6%) YoY in Q2.
Left panel with promotion-tag pills, bullets and a cumulative weekly box-office bar chart; right panel with merchandise bullets and a pop-up store photo.
Announced September 2026: Toho Eizo Bijutsu (a 100% Toho subsidiary) acquired Design Coco Co., Ltd., a maker of life-size and scale figures, to strengthen sculpting capabilities and expand its business scope. Design Coco has delivered multiple life-size figures to the 'NARUTO – Konoha Land' attraction at Parc Spirou Provence in southern France.
Two-column layout: bold bullet list on the left, two large product photos on the right with a caption; 'New' tag in the top-right corner.
Four plan points (in-house production, global live-action development, wider distribution line-up, making TOHO Cinemas the cinema of choice) are matched with progress: 12 lead-produced titles in FY2/2026 and 6 announced for FY2/2027; a live-action 'The Apothecary Diaries' drama co-produced with Amazon MGM Studios for exclusive Prime Video release in 240+ countries from 2028; 65 domestic releases in FY2/2026 vs 76 announced for FY2/2027; two OS Cinemas Kobe sites joined the group in October 2026 and self/mobile ordering is live at 20 theatres.
Plan-vs-progress layout: four numbered 'Point' boxes on the left, an arrow, and a navy-headed 'Progress' panel on the right; two summary bullets at top.
Section break introducing the IP & Animation business appendix.
Full-bleed navy background with a large thin white circle arc; white section title left-aligned at mid-height.
Table of 12 TOHO animation titles with release/broadcast timing and studios, e.g. 'BEASTARS FINAL SEASON' Part 2 (Mar 2026, Orange), 'Dr. STONE SCIENCE FUTURE' cour 3 (Apr 2026, TMS), 'Dorohedoro' Season 2 (Apr 2026, MAPPA), 'Mushoku Tensei III' (Jul 2026), 'Kaiju No. 8' original short (Sep 2026, Production I.G) and 'The Apothecary Diaries' season 3 (Oct 2026 / Apr 2027, OLM). Updated as of 15 October 2026; underlines mark changes since the Q1 deck.
Full-width three-column data table (title, release/broadcast schedule, studio) with a navy header row and thin row dividers.
Continues the pipeline: 'The Apothecary Diaries' theatrical film (Dec 2026, TOHO animation STUDIO), 'Frieren: Beyond Journey's End' season 3 (Oct 2027, Madhouse), 'Haikyu!!' special anime and film 'VS Little Giant' (2027, Production I.G), 'Spice and Wolf' season 2 (2027), plus confirmed productions including a new Godzilla anime series (Orange x Igloo Studio), the 'Kaiju No. 8' finale, 'Dorohedoro' Season 3 and 'Jujutsu Kaisen' season 4 part 2. A second table lists Science SARU titles such as 'Ghost in the Shell' (Jul 2026) and 'Dandadan' season 3 (2027).
Two stacked tables: a long three-column TOHO animation table on top and a shorter two-column Science SARU table below-left, with source links bottom-right.
Key visuals for three upcoming series: 'The Apothecary Diaries' season 3 (Oct 2026 / Apr 2027), 'Though I Am an Inept Villainess' cour 2 (Jan 2027) and 'Frieren: Beyond Journey's End' season 3 – Golden Land arc (Oct 2027).
Three equal-width portrait poster images in a row, each with a blue two-line caption above; copyright credits along the bottom.
Key visuals for four more titles: special anime 'Haikyu!! The Place Where Monsters Go' (2027), 'Spice and Wolf: Merchant Meets the Wise Wolf' season 2 (2027), the 'Kaiju No. 8' final arc (production confirmed) and 'Jujutsu Kaisen' season 4 'Culling Game Part 2' (production confirmed).
Four equal portrait posters in a row with blue captions above each; credits in the footer.
Stacked bar chart of TOHO animation's cumulative anime cours (1 cour is about 12 episodes), rising from 8 in FY2/2014 to 115 in FY2/2025 and 127 in FY2/2026, with new cours of 12-14 a year recently; about 20 cours are expected in FY2/2029. Callouts mark the start of franchises such as Haikyu!!, My Hero Academia, Jujutsu Kaisen, SPY x FAMILY, Kaiju No. 8 and Frieren.
Wide stacked bar chart across the slide with rounded light-blue callout labels pointing to bars; three bullets at top and a boxed note.
Japan's anime market grew from the mid-2010s to ¥3.8 trillion (兆円) in 2024, with overseas revenue growing fastest (Association of Japanese Animations). The global anime market is forecast to grow from US$34.3 billion (about ¥5 trillion) in 2024 to US$60.3 billion (about ¥9 trillion) in 2030, a 9.8% CAGR (Grand View Research).
Two side-by-side stacked bar charts: Japan domestic vs overseas (2010-2024) on the left, global market by region (2018-2030) on the right, each with a bold headline above.
Five regional mini-charts: Europe US$4.77bn (2024) to US$9.05bn (2030, CAGR 11.2%); Asia Pacific ex-Japan US$9.08bn to US$18.09bn (CAGR 12.1%); North America US$4.01bn to US$9.95bn (CAGR 16.3%, the fastest); Middle East & Africa US$1.11bn to US$2.11bn (CAGR 13.6%); Latin America US$1.85bn to US$4.13bn (CAGR 14.1%). Bullets cite streaming, merchandise and fan culture as drivers.
Five bordered panels with navy title bars (three across top, two below), each holding a small stacked bar chart and explanatory bullets; shared segment legend at the bottom.
Profiles of three group studios: TOHO animation STUDIO (formerly TIA, consolidated in September 2022, 41 employees as of Aug 2026); Science SARU (founded 2013, 73 employees, fully acquired by Toho in June 2024); and Orange Co., Ltd. (founded 2004, 183 employees, a leading full-3DCG cel-look studio in which Toho took a 19.7% stake in January 2025).
Three equal columns, each with a navy title bar, bullet facts, studio logo and two poster thumbnails below.
The 'TOHO Games' label launched in 2021 to bring film and anime IP to games; a 17-person game business office (Aug 2026) plans, develops and runs titles with partners, mainly TOHO animation works and Godzilla. The strategy covers planning and development (Godzilla and hit anime IP, TOHO-ONE fandom) and growing profitability (high-probability releases, TOHO-ONE monetisation, merchandising, overseas partners and TOHO Global).
Top half: TOHO Games logo on the left and bullet text on the right; bottom half: two navy chevron banners heading a four-column strategy grid.
Live titles: 'Godzilla Battle Line' (Toho-led, 4.5 million+ downloads), 'Jujutsu Kaisen Phantom Parade' (co-developed with Sumzap, 25 million+ players worldwide) and 'Kaiju No. 8 THE GAME' (Akatsuki Games, 5 million+ downloads). Upcoming: 'Haikyu!! ALL Challengers' (date TBD, developed by G2 Studios) and 'The Apothecary Diaries: The False Imperial Brother' with Koei Tecmo for Switch 2, Switch, PS5 and Steam in early 2027.
Two stacked four-column tables (live games and upcoming games) on the left with navy headers; two game key-visual posters stacked on the right.
About ¥15 billion (150億円) will be invested over three years to 2028. Progress: Godzilla goods expanded into supermarkets, electronics stores, convenience stores and drugstores; the 'New Godzilla The Ride' attraction by director Takashi Yamazaki; 7 domestic and 1 overseas Godzilla Store (as of 15 Oct 2026); games in development; and the new film 'Godzilla -0.0' opening in Japan on 3 November 2026 (North America 6 November).
Matrix table: navy row labels (Merchandise/Events, Stores, Games, Video) down the left, and three columns: plan, progress and post-2026 initiatives.
Target: grow Godzilla's IP market size to ¥80 billion (800億円) by 2032, up from about ¥40 billion in FY2/2025 and ¥55 billion in FY2/2026 (licence-sales equivalent). A stacked bar chart breaks Godzilla revenue (¥ million) into theatrical, other, streaming, merchandise and character licensing from FY2/2016 to Q2 FY2/2027, with overseas sales ratio peaking at 46.5% and 39.6% in FY2/2025, 35.0% in FY2/2026, and 9.5%/11.2% in Q1/Q2 FY2/2027.
Large combination chart: stacked columns with an overlaid overseas-ratio line, many rounded callout labels for film releases and store openings, and a legend box top-left.
Eight Godzilla Stores: Tokyo (Oct 2017), Daiba (Mar 2025), Shibuya (Apr 2025), Osaka (Nov 2020), Umeda (renewed Apr 2026), Nagoya (new, Sep 2026), Hakata (Apr 2026) and Malaysia (Dec 2025), about 200 tsubo in total. Some domestic stores exceed ¥1 million in monthly sales per tsubo, and about 70% of domestic store sales come from inbound visitors, with a growing share from North America.
Upper half: store table on the left and a navy-headed review panel with bullets on the right; lower half: three store photos with captions.
The goods shop carries Toho film and theatre goods, TOHO animation merchandise and Godzilla goods, awarding TOHO POINT to drive cross-traffic with cinemas. Stores: No. 1 Hibiya Chanter, Tokyo (Aug 2025), No. 2 NU Chayamachi, Osaka (Apr 2026, with experiential space) and No. 3 Hakata Riverain Mall, Fukuoka (Oct 2026, with a 'Chibi Godzilla' corner).
Bullets top-left and a three-column store table top-right; large black-outlined store logo bottom-left and a wide storefront photo bottom-right.
TOHO Global (Tokyo) wholly owns regional hubs TOHO Europe (London), TOHO Entertainment Asia (Singapore) and Toho International (Los Angeles). Below them sit Anime Limited (Glasgow, 100%), IGLOO STUDIO (Bangkok, 32%), CJ ENM FIFTH SEASON (Los Angeles, 25%) and GKIDS (New York, 100%).
Three-tier hierarchical org chart with light-blue boxes and navy borders, connecting lines labelled with ownership percentages.
Descriptions and headcounts as of August 2026: TOHO Global 86 employees; TOHO Europe 2 (founded Jan 2026); TOHO Entertainment Asia 21; Toho International 41 (runs Godzilla.com and the TOHO animation STORE); Anime Limited 12 (joined the group Jan 2026); IGLOO STUDIO 177; CJ ENM FIFTH SEASON 160 (producer of 'Severance' and 'Tokyo Vice'); and GKIDS 38 (North America's leading anime distributor).
Wide header box for TOHO Global with bullets, then a grid of seven navy-outlined title boxes each followed by bullet descriptions.
Overseas headcount rose from 56 in Q1 FY2/2025 to 103 (Q4 FY2/2025), 174 (Q4 FY2/2026), 191 (Q1 FY2/2027) and 200 in Q2 FY2/2027. The Q2 split: GKIDS 38, Toho International 41, TEA 21, TOHO Europe 2, Anime Limited 12 and TOHO Global 86. Target: about 250 people by end-2027.
Stacked column chart with totals above bars and a data table beneath aligned to each quarter; legend and target callout box top-right.
The goal is to raise IP & Animation operating profit to over 200% of FY2/2025's ¥22.2 billion (222億円). TOHO animation targets 30 cours (from 14) and about 120 staff (from about 60) by 2032; staff grew from 34 (2022) to 80 (Aug 2026). Progress also covers completed bases in Asia, North America and Europe, the March 2026 TOHO-ONE launch, and new games 'Haikyu!! ALL Challengers' and 'The Apothecary Diaries' (early 2027).
Plan-vs-progress layout: four 'Point' boxes left (Point 1 includes 2032 target arrows), arrow, navy 'Progress' panel right containing a small bar chart.
Section break introducing the theatre business appendix.
Full-bleed navy background with a thin white circular arc and left-aligned white title.
Schedules for Theatre Creation (e.g. 'Rebecca', 'RENT', 'Maybe Happy Ending'), other in-house productions (e.g. 'Miss Saigon' at Tokyu Theatre Orb, 'Mozart!' at Nissay Theatre, 'Moulin Rouge! The Musical' summer 2027, 'Les Misérables' autumn 2027) and overseas tours of 'Spirited Away' (Taipei Dec 2026–Jan 2027, Toronto, Los Angeles, and London Coliseum Mar–Jul 2028). Updated 15 October 2026.
Dense multi-table layout: two tables on the left (Theatre Creation, other productions), one on the upper right, an overseas tour table bottom-right next to a 'Spirited Away' world tour poster.
Japan's live entertainment market reached a record ¥856.4 billion (8,564億円) in 2025 (music ¥628.5bn, stage ¥227.9bn), a new high for the third year in a row; average spend per attendee was ¥9,286. Pia Research forecasts the market will exceed ¥1 trillion by 2035. Toho's theatre business sits in the 'stage' segment.
Bullet text with large bold figures on the left; stacked column chart (2017-2025) of music vs stage on the right.
Toho aims to support box-office revenue while the Imperial Theatre is closed through external venues, a new membership service and diversified ticket pricing, and to build the brand toward the new Imperial Theatre. Progress: the 'New HISTORY COMING' arena concert tour, 'Kingdom II' and a 'Rebecca' revival drew strong results; the first dynamic-pricing performances ran for 'Miss Saigon' (7 and 13 Nov 2026); and 'Spirited Away' has played 491 performances to over 900,000 people, with a 2026-2028 world tour expected to pass 500 performances and 1 million attendees.
Plan-vs-progress layout: three 'Point' boxes on the left (Point 3 includes a circular arrow cycle diagram), an arrow, and a navy 'Progress' panel on the right.
Section break introducing the real estate business appendix.
Full-bleed navy background with a thin white circular arc and left-aligned white title.
Toho owns 130 properties nationwide (60 in Tokyo, 10 in Osaka, 5 in Aichi, 55 elsewhere), including Toho Hibiya Building, Tokyo Takarazuka Building, Yurakucho Mullion and Shinjuku Toho Building. By leased floor area the mix is 36% retail, 23% hotel, 16% office, 8% cinemas/theatres, 10% residential, 6% studio and 1% warehouse. Vacancy has stayed low, at 0.3% in Q1 and Q2 of FY2/2027 (data as of end-September 2026).
Property table on the upper left, donut chart of floor-area mix on the upper right, and a full-width vacancy-rate line chart across the bottom.
Opened in 2015 as an entertainment complex anchored by a cinema and hotel, the Shinjuku Toho Building draws visitors with its Godzilla Head, TOHO Cinemas Shinjuku (with IMAX), and Hotel Gracery Shinjuku's Godzilla View Room, Godzilla Room, a Godzilla goods corner and a one-off 'Godzilla vs King Ghidorah' room on the 30th floor marking the hotel's 10th anniversary.
Hub-and-spoke photo collage: central building photo with navy caption bar, connected by lines to five surrounding captioned photos.
Toho will maintain its long-term earnings base while improving asset efficiency: raise rents and keep vacancy low, review the portfolio and sell low-relevance assets, push the Imperial Theatre Building redevelopment and curb new acquisitions. Progress: sale of 7 regional/suburban properties has begun; Hibiya office rents are rising about 10% across FY2/2026-FY2/2027; demolition of the Imperial Theatre Building began in April 2025 and was on schedule at end-August 2026. The Marunouchi 3-1 Project (Mitsubishi Estate, Toho, Idemitsu Museum of Arts) covers about 9,900 m² of land and 176,000 m² of floor space, with 29 floors above ground, 4 below and a height of about 155 m.
Plan-vs-progress layout: three 'Point' boxes on the left, arrow, and a navy 'Progress' panel on the right with an inset project-outline box.
Section break introducing the TOHO-ONE membership platform appendix.
Full-bleed navy background with a thin white circular arc and left-aligned white title.
TOHO-ONE is building new fan touchpoints through IP collaborations, from the 'Chiikawa' film through Q2 to 'Godzilla -0.0' collaborations from Q3. For fans it offers diverse IP via the app and theatres, exclusive experiences and the 'ONE's VOICE' feature; for IP holders it offers OMO (online-merges-with-offline) reach, greater fan engagement and insight into fan needs from attribute, behaviour and voice-of-customer data.
Central illustrated hero (smartphones, character and rainbow arc on a navy 'TOHO-ONE' podium) flanked by three outlined benefit boxes on each side with arrows.
TOHO-ONE launched with about 4 million members migrated from film, theatre, EC and retail services and targets about 10 million (including free members) by 2032: 6 million from the four existing services and 4 million from new links such as games (starting in FY2026), events, partners and overseas. Plans: Premium ¥3,000/year (2% points), Standard ¥500 (2%), Light free (1%). The initial investment of about ¥4.1 billion (41億円) is depreciated over five years as a corporate expense.
Left: two stacked columns comparing 2026 and 2032 membership by source; right: a pricing-plan comparison table and an accounting-treatment table.
Section break introducing the business-model appendix explaining how revenues flow and in which segment they are booked.
Full-bleed navy background with a thin white circular arc and left-aligned white title.
Toho seeks stable base earnings from exhibition and distribution plus upside from big hits. Three scenarios (expected, hit, underperformance) show how ticket revenue is split among exhibition (SG&A, exhibition profit), distribution (expenses, distribution fees) and production (committee income vs production cost), with ancillary and secondary-use revenue below, each tagged to the Film Distribution, Film Exhibition or IP & Animation segment.
Three side-by-side panels of waterfall-style block diagrams, the middle 'hit' scenario highlighted in peach with a large upward arrow and the right scenario showing red loss blocks.
Toho will leverage its strengths (IP acquisition and film exhibition) while investing in growth areas (digital and overseas). Strengths: 100%-owned Godzilla IP, anime rights acquisition and production via TOHO animation, and IP-enhancing exhibition at TOHO Cinemas; growth areas: the TOHO-ONE fan engagement platform and overseas expansion via GKIDS and TOHO Global.
Chevron process bar across the top (planning to merchandise), two headline themes 'Licensing Leverage' and 'Tangible Touchpoints', navy labels with red 'Strength' and peach 'Growth' tags over brand logos, and a vertical 'Fans' bar on the right.
Shows which stages of the value chain the Toho group covers with partners, from IP planning (TOHO animation, Godzilla, group studios Science SARU, Orange, IGLOO) through domestic and overseas window management (TOHO Global, Toho International, TEA, GKIDS, Anime Ltd), exhibition at TOHO Cinemas, and merchandise, EC, stores and games (Godzilla Store, TOHO animation STORE, To-Smile, TOHO Games), linked to fans via TOHO-ONE.
Chevron process header over a grid of navy blocks (group-owned areas) and dashed grey boxes (partners), with orange 'Domestic'/'Overseas' arrow tags and a vertical 'Fans' bar.
Production committees roll out secondary use across windows (streaming, overseas sales, merchandise, games, packages, broadcast, theatrical) to deliver works over the long term; investors share income by stake and the lead company earns a management fee. Committee members holding a window earn window fees, and Toho can earn from theatrical release, merchandise and overseas expansion, plus box office at TOHO Cinemas.
Complex flow diagram: investor row at top, a large grey 'Production Committee' block in the centre with window-rights tabs, licensee boxes below, studios on the right, and an inset income/expense bar illustration at the left.
Maximise fan engagement around secondary use and feed it back into new projects. Merchandise: strengthen in-house products and domestic/overseas EC, including To-Smile, set up in December 2025 with Good Smile Company (Toho 60%, Good Smile 40%). Theatre sales of goods and programmes are growing, led by Godzilla and anime; about 100 package (DVD/Blu-ray) titles are released a year, with strong overseas demand for collector's boxes.
Left: three headed text sections; right: a five-step chevron value chain (licence management to retail) with navy Toho blocks, dashed partner boxes and orange callouts, plus a vertical 'Fans' bar.
Four matrices show which segment books each revenue stream (production, distribution, theatre sales, streaming, licensing/merchandise) domestically and overseas: (1) Godzilla films, (2) TOHO animation and Science SARU titles, (3) Toho-distributed anime films such as 'Detective Conan' and 'Doraemon', and (4) the newly added 'Chiikawa: The Secret of Mermaid Island' film. For example, Godzilla overseas distribution, streaming and licensing fall under IP & Animation.
Four stacked matrix tables with blue numbered titles, a chevron-arrow header row, and outlined or solid navy segment labels per cell.
For 'Godzilla -0.0', the Toho group is lead producer with 100% investment and Toho Studios handles production. Domestic theatrical distribution (Film Distribution) licenses TOHO Cinemas (Film Exhibition); the Rights Division handles programmes, packages and streaming, the Godzilla Division handles merchandising (IP & Animation), and TOHO Global licenses overseas use through Toho International, GKIDS, TEA, TOHO Europe and Anime Limited.
Three light-blue column panels (Production/Investment, Windows, Licensees/Exhibition/Streaming) with navy entity boxes, arrows and orange segment labels.
A matrix maps the Film segment (Film Distribution: Toho, Toho-Towa, TOHO Archive; Film Exhibition: TOHO Cinemas; Video-related: TOHO Studios and others) and the IP & Animation segment (Toho's TOHO animation, Rights and Godzilla divisions, Toho Stella, To-Smile, TOHO Global group, TOHO animation STUDIO, Science SARU, Toho Music) to seven revenue-disaggregation categories and 14 numbered business lines, from domestic film distribution and exhibition to Godzilla licensing, package sales, anime production investment and game/music revenue.
Large grid table with a navy header row; shaded grey cells mark non-applicable combinations and circled numbers mark revenue lines, with a numbered legend column on the right.
Lists 13 units in the IP & Animation segment with fiscal year-end, domestic/overseas scope and main activities: e.g. TOHO animation (production investment, producing, marketing), the Rights and Godzilla divisions (licensing, packages, Godzilla Store), TOHO Global and overseas subsidiaries with December year-ends, Science SARU (January year-end), Toho Stella (EC sites), Toho Music (soundtracks) and To-Smile (original toys and figures).
Full-width table with navy header, columns for entity, fiscal year-end, domestic/overseas check marks, main business and notes.
Section break introducing the corporate information appendix.
Full-bleed navy background with a thin white circular arc and left-aligned white title.
FY2/2026 results: operating revenue ¥360.6 billion (3,606億円), operating margin 18.8%, ROE 10.4% and overseas sales ratio 10.1%. Segment highlights: about 58% share of domestic distribution (2025) and about 30% of domestic box office from exhibition; anime market growing about 10% a year with the Godzilla IP and a rich anime line-up; about 900 theatre performances and 1 million attendees a year; 130 owned properties; about 3 million TOHO-ONE members (end-August 2026). Purpose, value and spirit statements sit beside the 'Moments for Life' tagline.
Left column with serif 'Moments for Life' tagline and three grey Group Purpose/Value/Spirit labels; right side a KPI tile grid with navy headers (four headline KPIs, then segment tiles).
Toho works alongside many of Japan's top IPs and grows them through film, anime and theatre. A GEM Partners top-20 ranking of 'oshi' fan numbers (Feb–Jul 2026) is led by Detective Conan (1.126 million), ONE PIECE (1.025 million), Demon Slayer (1.013 million) and Chiikawa (978,000), and shows which Toho segments book revenue for each, e.g. Jujutsu Kaisen, The Apothecary Diaries and Haikyu!! across Film Distribution, Exhibition and IP & Animation.
Bullets with blue highlighted phrases on the left; a 20-row ranked table on the right with light-blue shading for Toho-related titles and dense footnotes bottom-left.
After three years in which 'Godzilla Minus One' won an Academy Award, 'Jujutsu Kaisen' became a global hit and 'Spirited Away' sold out in London, Toho frames its value-creation story as 'people' who 'plan' entertainment and deliver it to 'the world', plus 'connecting' more closely with customers, aiming to be an entertainment company loved by fans worldwide.
Narrative text block on the left; on the right a cycle of three navy circles ('Plan', 'Deliver to the world', 'Connect with customers') linked by large curved arrows over a faint globe, with an illustration of a team meeting.
People: hire about 200 people over three years. Content/IP: offer about 200 titles, invest about ¥70 billion (700億円) in content and IP creation, about ¥15 billion in Godzilla, and set about ¥120 billion for M&A and cinema openings; double TOHO animation staff and lift IP & Animation operating profit to 200%+ of FY2/2025 by 2032. Digital: about ¥5 billion in the TOHO-ONE customer data platform. Overseas: raise the overseas sales ratio from about 10% to 30% by 2032.
Four stacked rows, each with a slanted navy parallelogram label (People, Content/IP, Digital, Overseas) and an outlined parallelogram text box with large blue figures.
Targets are raised from the previous plan: operating profit of ¥70 billion or more (achieved by FY2028), up from the prior aim of beating the ¥52.8 billion record, toward ¥75-100 billion in Long-Term Vision 2032; a dividend floor of ¥17 per share (¥85 pre-split) with a payout ratio of 35%+ plus flexible buybacks; and ROE of 9%+, with the 2032 ROE goal raised to 10%+ on an ongoing basis (from 8-10%).
Three slanted columns left to right: grey 'MTP 2025' guideline, solid navy 'MTP 2028' targets in the centre, light-blue 'Long-Term Vision 2032', joined by white arrows; row labels for operating profit, shareholder returns and ROE.
Three-year cash-in of ¥160-170 billion from operating cash flow and asset sales plus about ¥40 billion of interest-bearing debt funds about ¥160 billion of investment (¥120bn growth, ¥40bn real estate), buybacks and ¥40-50 billion of dividends. FY2/2026 operating cash flow was ¥66.6 billion; content investment ran ¥17.7 billion against a ¥70 billion three-year plan; ¥14.9 billion of shares were bought back in Nov 2025 with up to ¥13 billion more from April 2026; dividends total ¥18.5 billion for both FY2/2026 and FY2/2027.
Central stacked-block diagram: orange cash-in column (operating CF + asset sales, debt) beside a blue cash-out column (investment, buybacks, dividends), with numbered annotation text on both sides.
Quarterly gross margin, SG&A ratio and operating margin from FY2/2021 to FY2/2027 with dotted trend lines. Growth investment (SG&A) will ramp up from next year, which may temporarily depress the margin; Toho aims to raise the gross margin, notes higher SG&A from overseas IP infrastructure and group IT governance, and expects the operating margin to recover after the investment period.
Line chart with three coloured series (navy gross margin, dark-grey SG&A ratio, red operating margin) and dotted trend lines; an 'Outlook' panel on the right with matching coloured commentary and arrows.
Toho estimates its cost of equity (CAPM) at about 4-5.5% (2025; risk-free rate 1.5%, beta 0.40-0.70, market risk premium 6.0%) and acknowledges a gap with investors' expectations. ROE was 9.3% in FY2/2016, 11.2% in FY2/2017, fell to 3.9% in FY2/2021, and recovered to 10.4% in FY2/2024, 9.3% in FY2/2025 and 10.4% in FY2/2026.
Single navy line chart of ROE with data labels, a light-blue horizontal band marking the 4-5.5% cost-of-equity range, and two bullets above.
As of end-August 2026, the largest shareholders are Hankyu Hanshin Holdings (13.70%), The Master Trust Bank of Japan (trust account, 10.74%), Hankyu Hanshin Properties (9.10%) and Custody Bank of Japan (6.51%), followed by H2O Retailing, Fuji Media Holdings, TBS Television, Takenaka and Marui. By owner type: other corporations 40.93%, financial institutions 21.08%, individuals 17.91%, foreign corporations 16.91%, treasury shares 2.13%. 850 million shares are issued.
Top-10 shareholder table on the left and a donut chart of ownership by type (8,496,670 trading units in the centre) on the right.
Lists disclosures from March to October 2026 (e.g. buyback and cancellation on 14 April, acquisition of OS Cine Brothers on 30 June, policy to reduce cross-shareholdings on 15 July, property sales on 17 August, Design Coco acquisition on 30 September, forecast revision on 15 October) and business topics (TOHO Cinemas Oimachi and Nagoya Sakae openings, Godzilla Store Nagoya, first console game for 'The Apothecary Diaries'). The IR calendar shows Q2 results on 15-16 October 2026, Q3 results on 14 January 2027 and full-year results in April 2027.
Two-column layout: a long dated disclosure table on the left; business-topics table and IR calendar table stacked on the right, all with navy headers and underlined linked items.
Disclosure and dialogue have expanded: earnings slides grew from 12 pages per quarter to 112 (Q1) and 111 (Q2 FY2/2027), annual IR meetings rose from 59 in FY2016 to 496 in FY2025, and internal feedback sessions reached 29 a quarter; the corporate site was fully redesigned in September 2026. Trading value relative to market cap doubled from an average 0.2% (2021-23) to 0.4-0.5%, and Toho ranked 3rd of 24 in the Securities Analysts Association of Japan's 2026 disclosure awards for media and entertainment.
Three bar charts with large diagonal arrows on the left, a liquidity line chart top-right and a ranking grid bottom-right showing Toho's rank by year; grey box summarising IR strengths.
Closing slide with the TOHO logo and 'Moments for Life' brand line, a forward-looking-statements disclaimer listing risk factors (film and theatre results, IP and overseas markets, real estate, M&A, FX and interest rates, costs, regulation, disasters and geopolitics), the IR contact (Toho Co., Ltd. IR Office, ir@toho.co.jp) and a note that the deck uses a universal-design (UD) font.
Centred large logo and tagline on white, small-print disclaimer paragraph below, and a footer bar with a navy contact pill and a UD FONT mark.
Algengar spurningar um þessa glæru og undirliggjandi kynningarefni.
For the interim period of the fiscal year ending February 2027, Toho reported operating revenue of ¥185.2 billion (¥185,162 million, -3.4% YoY), operating profit of ¥30.9 billion (-24.8%), ordinary profit of ¥33.1 billion and interim net profit attributable to owners of the parent of ¥20.0 billion (-40.2%). The declines reflect the high base from last year's 'Demon Slayer' and 'Kokuho' hits, the timing effect of the TOHO Global company split, one-off costs and overseas investment, while IP & Anime revenue grew 15.6% to ¥43.1 billion.
Partly. Revenue (¥345.0 billion), operating profit (¥62.0 billion) and ordinary profit (¥67.0 billion) were left unchanged while management waits for the opening performance of its big second-half releases. Net profit was raised by ¥7.0 billion to ¥48.0 billion to reflect the September 15 sale of cross-shareholdings, which reduced their balance-sheet value by about ¥14.3 billion.
After the March 2026 company split, overseas anime revenue is booked by TOHO Global, which has a December year-end, so about two months of overseas income in each quarter shifts into the next quarter while related payouts are booked straight away. Q2 also carried a ¥1.4 billion one-off contingent-consideration cost and ¥1.1 billion more of overseas SG&A investment. Q2 segment revenue nonetheless reached a record ¥24.9 billion, and overseas streaming revenue hit a record ¥7.3 billion.
The appendices cover Toho's film, TOHO NEXT, GKIDS and foreign-film lineups, the 'Chiikawa the Movie' hit (about ¥17 billion box office), TOHO Cinemas' 79 sites and 743 screens, TOHO animation revenue by source, the anime release slate, the global anime market, games and the Godzilla strategy, the theatre business during the Imperial Theatre's closure, the real-estate portfolio and property sales, the TOHO-ONE membership platform (3 million members), business-model flow charts, and the Medium-term Management Plan 2028, which targets operating profit of ¥70 billion or more and ROE of 9% or more.
The page offers the original PDF of the deck and an editable PPTX converted from that PDF. The PPTX lets you reuse the slide layouts, tables and chart structures in PowerPoint, Keynote or Google Slides. Because it is a conversion, check the fonts, Japanese text wrapping and chart objects before reusing it.
It is Toho Co., Ltd.'s own Japanese-language 決算説明資料 (earnings presentation) for Q2 (interim) of the fiscal year ending February 2027, prepared by the company's IR office and published on October 15, 2026 through TDnet, the Tokyo Stock Exchange's timely disclosure network. The original filing is linked in the sources. Titles and figures on this page are English translations, so check the Japanese original for anything you plan to cite.
The deck shows a disciplined corporate system: royal blue and white, full-bleed blue section dividers with thin white arcs, small section labels above large titles, current-period columns framed in blue on tables, numbered driver callouts, waterfall bridges and update tags on every page. You can describe your own results or upload your data and source documents to 2Slides to generate an earnings or investor deck with a similar structure (an executive summary, highlights and layered appendices), then adjust the colors and charts to your brand.
Investors and analysts following Toho or Japanese media and entertainment stocks, students learning how Japanese companies report interim results and segment data, and IR or design teams looking for an example of a long, well-signposted earnings presentation that works both as a quick summary and as a full reference document.
Original Japanese-language deck

Create Your Own Slides
Turn your ideas into professional presentations in seconds with 2slides AI.
Sæktu innblástur í faglega hönnun, veldu þinn stíl og búðu til glærur með fullkominni textabirtingu. Knúið af Nano Banana—byrjaðu að búa til kynninguna þína núna.
Þinn AI-þjónn fyrir glærur. Sparaðu tíma, skín hraðar með snjallri kynningargerð.


© 2026 2slides. Allur réttur áskilinn.