
Hluti af safninu Dæmi um fjárfestakynningar · Dæmi um indverskar fjárfestakynningar
Hyundai Motor India Ltd. (HMIL) Quarterly Results Q2 FY27 — the 19-page earnings presentation filed with BSE/NSE on 28 October 2026, covering record quarterly sales of 219,072 units, highest-ever quarterly revenue of ₹206,961 Mn and margin pressure from raw material cost inflation (India FY27 = April 2026 to March 2027; Q2 FY27 = July–September 2026).
Notar forsíðu þessarar kynningar sem stílfyrirmynd fyrir glærur úr þínu eigin efni. Eða veldu hvaða síðu sem er hér fyrir neðan og notaðu uppsetningu hennar sem fyrirmynd.
Flýtileiðsögn
Merki
Deila glærunum
Hyundai Motor India Ltd. (HMIL) Quarterly Results Q2 FY27 — the 19-page earnings presentation filed with BSE/NSE on 28 October 2026, covering record quarterly sales of 219,072 units, highest-ever quarterly revenue of ₹206,961 Mn and margin pressure from raw material cost inflation (India FY27 = April 2026 to March 2027; Q2 FY27 = July–September 2026).
Ítarleg sýn á hverja glærusíðu, þar á meðal útlit, lykilefni og sjónræna þætti.
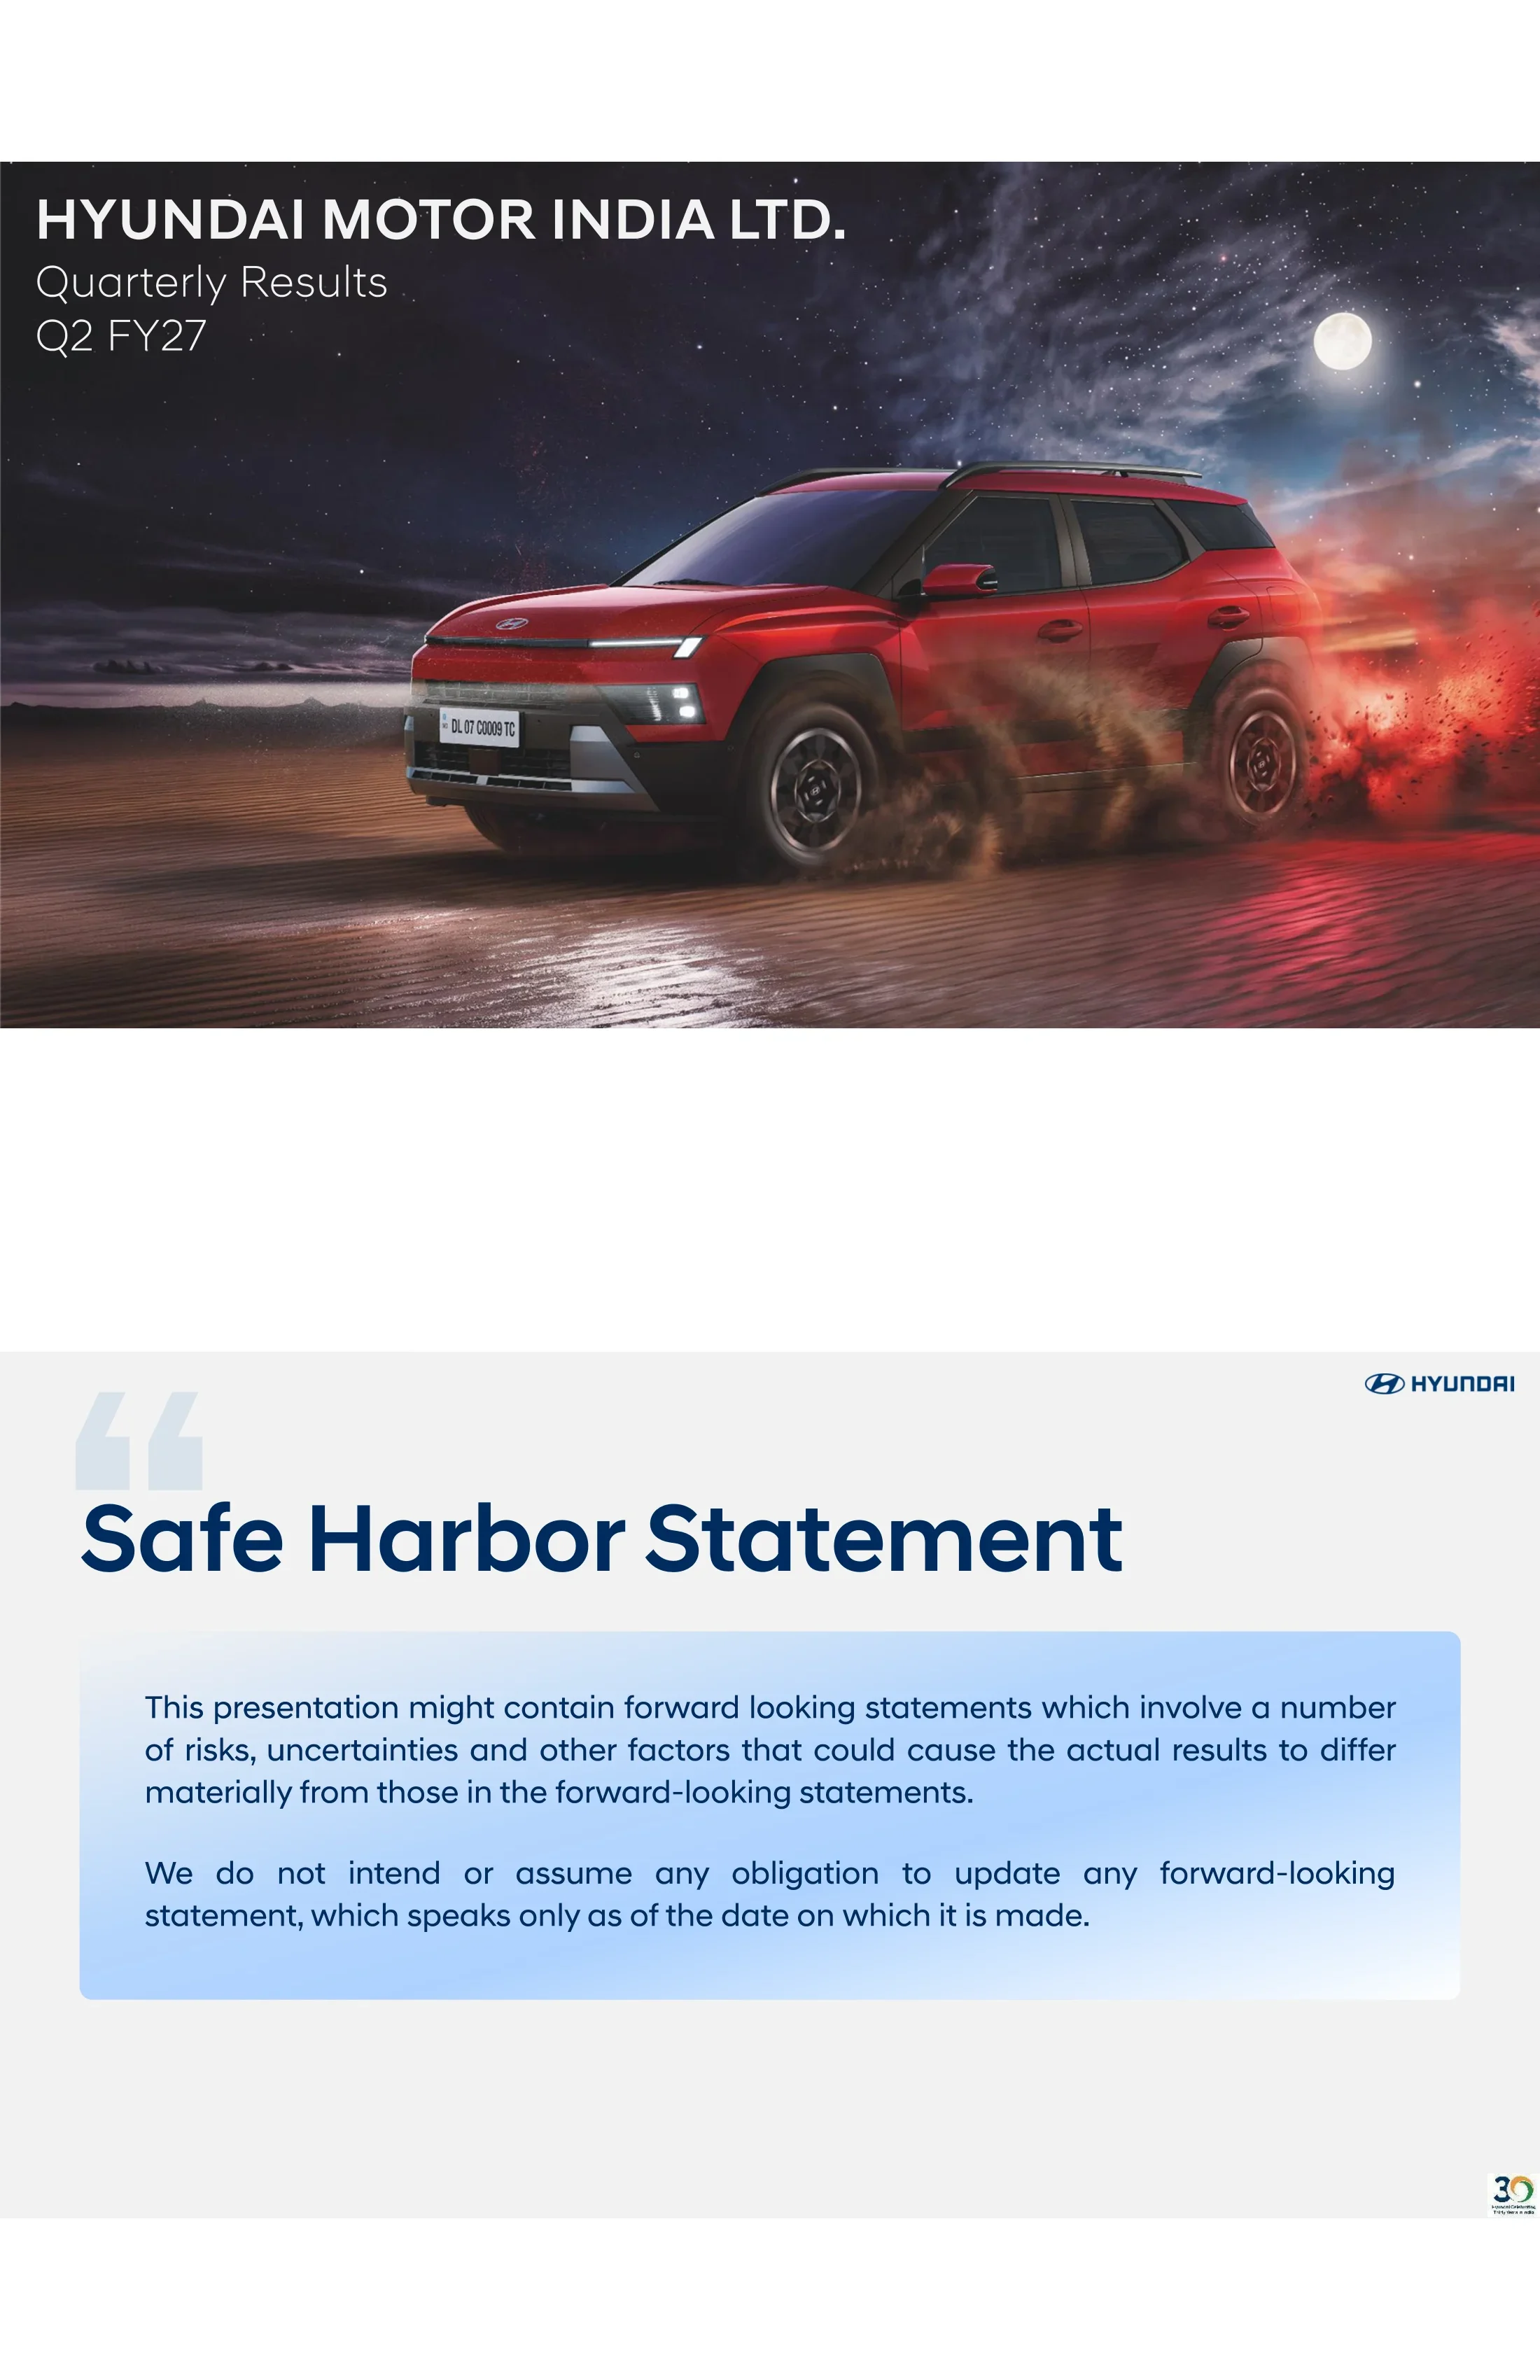
Cover slide with the title 'HYUNDAI MOTOR INDIA LTD. Quarterly Results Q2 FY27' over a full-bleed night-scene photograph of a red Hyundai compact SUV kicking up sand under a full moon.
Full-bleed hero photograph with left-aligned white title block in the upper-left corner.
Standard disclaimer: the presentation might contain forward-looking statements involving risks and uncertainties that could cause actual results to differ materially, and the company assumes no obligation to update them.
Large navy heading with oversized pale quotation-mark graphic, body text inside a light-blue gradient rounded panel; Hyundai logo top right and '30 years in India' badge bottom right.
Two sections: 01 Business (Highlights; Sales Performance — Domestic & Exports, Volume Mix) and 02 Financials (Highlights; Profit Analysis).
Large two-line 'Table of Contents' heading on the left, two overlapping white cards with large pale-blue section numbers 01 and 02 on the right.
Section divider introducing the business performance section.
Plain light-grey slide with a large navy two-line title in the lower-left; logo top right.
Introduces the Hyundai BAYON ('Intelligence that moves.') with four features — Intelligent Utility Vehicle, Global K Enhanced Platform, Level 2 Pro ADAS and HMIL's first-ever Gen AI voice assistant — and lists five highlights: No.1 position in exports on a cumulative basis with 4 Mn cumulative PV exports from India; Pune facility surpassed 1 Lakh vehicle production within 8 months of operations; highest-ever monthly sales (Sep'26) and highest-ever quarterly sales (Q2 FY27); highest-ever quarterly CNG contribution of 19.1%; highest-ever quarterly rural penetration of 26.6%.
Two-column layout: left column with product name, photo of a red BAYON with a robot and cat, and four numbered navy-circle feature pills; right column with five stacked white highlight boxes separated by a thin vertical timeline line.
Record total quarterly volume driven by growth in domestic and exports. Total sales 219,072 in Q2 FY27 vs 190,921 in Q2 FY26 (YoY 14.7% up) and 178,082 in Q1 FY27. Domestic 165,772 vs 139,521 (YoY 18.8% up) and 139,374 in Q1. Exports 53,300 vs 51,400 (YoY 3.7% up) and 38,708 in Q1. Footnote: export volumes include CBU + CKD.
Three 3D bar-chart groups (Total Sales, Domestic, Exports), each with three bars (Q2 FY26, Q1 FY27, Q2 FY27) under a ribbon-style label and a YoY bracket callout; current quarter in dark navy gradient, prior periods in light blue.
Volume growth across segments, CNG momentum strong. SUV 111,756 units in Q2 FY27 (67% of domestic) vs 99,220 (71%) in Q2 FY26 and 97,456 (70%) in Q1 FY27; Hatchback 31,956 (19%) vs 22,620 (16%) and 24,135 (17%); Sedan 22,060 (13%) vs 17,681 (13%) and 17,783 (13%). Fuel mix Q2 FY27: Petrol 59%, Diesel 20%, CNG 19%, EV 2% (Q2 FY26: 61/23/15/1; Q1 FY27: 64/17/18/1).
Left: three rows of 3D cube charts (SUV, Hatchback, Sedan) with unit counts above and share percentages inside; right: three stacked 3D fuel-mix columns with legend, current quarter boxed with a dashed outline.
Section divider introducing the financial performance section.
Plain light-grey slide with large navy two-line title in the lower-left.
Highest-ever quarterly revenue; raw material cost inflation pressured profitability. Revenue ₹206,961 Mn vs ₹174,608 Mn in Q2 FY26 (YoY 18.5% up) and ₹163,346 Mn in Q1 FY27. EBITDA ₹19,745 Mn (9.5% margin) vs ₹24,289 Mn (13.9%), YoY 18.7% down; Q1 ₹15,117 Mn (9.3%). EBIT ₹14,191 Mn (6.9%) vs ₹19,114 Mn (10.9%), YoY 25.8% down; Q1 ₹9,546 Mn (5.8%). PAT ₹11,962 Mn (5.7%) vs ₹15,723 Mn (8.9%), YoY 23.9% down; Q1 ₹8,886 Mn (5.4%). EBITDA and EBIT margins on revenue from operations; PAT on total income.
2x2 grid of 3D bar-chart quadrants (Revenue, EBITDA, EBIT, PAT), each with three bars, YoY bracket callout and margin percentages printed inside bars; footnote at bottom.
Raw material inflation weighed on profitability; volume and mix supported sequential improvement (₹ Mn). YoY: Q2 FY26 PBT 21,260 + volume & price adjustment 4,011 − raw material 8,607 − others 486 = Q2 FY27 PBT 16,178. QoQ: Q1 FY27 12,016 + volume & price 6,446 − raw material 5,248 + others 2,964 = 16,178. Notes: price adjustment includes discount net of price increase; others include mix, FX, cost savings, etc.
Two side-by-side waterfall charts (YoY and QoQ) in bordered panels with white header strips; green bars for positives, red for negatives, light-blue start and navy end bars.
Despite a tough environment, the company stayed true to core fundamentals: ASP improved 2% YoY from 791k to 807k (₹ per car) under the 'Quality of Sales' strategy; domestic discounts moderated 8.2% YoY from 25k to 23k (₹ per car) through disciplined pricing; localization improved 2% YoY from 82% to 84% to de-risk supply chain and strengthen cost competitiveness.
Three equal white KPI cards with navy circular icons, title and subtitle, large green percentage figure, before-to-after values, and a short explanatory caption.
Divider introducing the annexure with half-year and supplementary tables; page number 11 shown at bottom right.
Plain light-grey slide with large navy title in the lower-left.
H1 FY27 total sales 397,154 vs 371,320 in H1 FY26 (YoY 7.0% up); domestic 305,146 vs 271,780 (YoY 12.3% up); exports 92,008 vs 99,540 (YoY 7.6% down). Export volumes include CBU + CKD.
Three paired 3D bar charts (Total Sales, Domestic, Exports) with ribbon labels and YoY bracket callouts; H1 FY27 bars in navy.
SUV 209,212 units in H1 FY27 (69%) vs 189,751 (70%); Hatchback 56,091 (18%) vs 46,738 (17%); Sedan 39,843 (13%) vs 35,291 (13%). Fuel mix H1 FY27: Petrol 61%, Diesel 19%, CNG 19%, EV 1% vs H1 FY26 Petrol 62%, Diesel 22%, CNG 15%, EV 1%.
Left: paired 3D cubes per body type with unit counts and shares; right: two stacked fuel-mix columns with legend and dashed box around H1 FY27.
Revenue ₹370,307 Mn vs ₹338,737 Mn (YoY 9.3% up); EBITDA ₹34,862 Mn (9.4%) vs ₹46,142 Mn (13.6%), YoY 24.4% down; EBIT ₹23,737 Mn (6.4%) vs ₹35,686 Mn (10.5%), YoY 33.5% down; PAT ₹20,848 Mn (5.6%) vs ₹29,415 Mn (8.6%), YoY 29.1% down.
2x2 grid of paired 3D bar charts (Revenue, EBITDA, EBIT, PAT) with YoY callouts and margins inside bars; methodology footnote.
PBT bridge in ₹ Mn: H1 FY26 39,732 + volume & price adjustment 3,475 − raw material 11,966 − others 3,046 = H1 FY27 28,195. Same footnotes on price adjustment and others (mix, FX, cost savings).
Single full-width waterfall chart in a bordered panel with category labels above each bar; green positive, red negative bars.
Cost and margin ratios for Q2 FY26 / Q1 FY27 / Q2 FY27, H1 FY26 / H1 FY27 and FY25 / FY26. Material cost 70.1% / 72.6% / 73.8%, H1 70.4% / 73.3%, FY 72.2% / 71.3%. Employee expenses Q2 FY27 3.6%; depreciation 2.7%; finance cost 0.1%; other expenses 13.1%. EBITDA % 13.9 / 9.3 / 9.5 (H1 13.6 / 9.4; FY 12.9 / 12.2). EBIT % 10.9 / 5.8 / 6.9 (H1 10.5 / 6.4; FY 9.9 / 9.0). PBT % 12.0 / 7.2 / 7.7 (H1 11.6 / 7.5; FY 10.8 / 10.1). PAT % 8.9 / 5.4 / 5.7 (H1 8.6 / 5.6; FY 8.1 / 7.6). All on revenue from operations except PBT and PAT (on total income).
Three grouped tables with navy header rows (quarterly, half-year, full-year) sharing a row-label column; current-period columns shaded light blue and bolded.
Revenue from operations ₹206,961 Mn in Q2 FY27 (domestic 72.9%, exports 27.1%); FY24 698,291, FY25 691,929, FY26 707,633. Net worth ₹203,747 Mn (FY26 200,150). ROCE 7.2% for the quarter, not annualized (Q2 FY26 10.72%, Q1 FY27 5.3%; FY24 62.9%, FY25 41.0%, FY26 32.6%). Basic and diluted EPS ₹14.72 (Q2 FY26 19.35; FY26 66.85). Total sales volume 219,072 (FY26 775,031: domestic 584,906, exports 190,125). Sales outlets 1,546 and service outlets 1,697 (FY26 1,508 and 1,671).
Two tables — quarterly (Q2 FY26, Q1 FY27, Q2 FY27) and annual (FY24, FY25, FY26) — with navy headers, indented sub-rows and shaded current-quarter column; ROCE footnote.
Closing slide with 'THANK YOU' over a studio render of eleven Hyundai compact SUVs in various colours arranged on stepped concrete terraces.
Full-bleed photograph with dark text title in the upper-left.
Algengar spurningar um þessa glæru og undirliggjandi kynningarefni.
It is HMIL's 19-page Quarterly Results deck for Q2 FY27, covering business highlights, domestic and export sales, domestic body-type and fuel mix, quarterly and half-year financial highlights, PBT bridges, ASP/discount/localization KPIs, key ratios and other key metrics.
Indian companies use an April–March fiscal year, so FY27 runs from April 2026 to March 2027 and Q2 FY27 covers July–September 2026. The presentation was filed with BSE/NSE on 28 October 2026; the original cover letter has been removed from this copy.
Total sales were a record 219,072 units (YoY 14.7% up), revenue was ₹206,961 Mn (YoY 18.5% up, highest-ever quarterly), EBITDA was ₹19,745 Mn at a 9.5% margin (YoY 18.7% down) and PAT was ₹11,962 Mn (YoY 23.9% down).
The deck attributes it to raw material cost inflation. The YoY PBT bridge shows a ₹8,607 Mn raw material headwind against a ₹4,011 Mn volume & price benefit, taking PBT from ₹21,260 Mn to ₹16,178 Mn; material cost rose to 73.8% of revenue from 70.1%.
CNG reached a highest-ever quarterly contribution of 19.1% (shown as 19% in the fuel-mix chart), EV was 2% and petrol 59%. SUVs were 111,756 units or 67% of domestic volume, with hatchbacks rising to 19%.
Yes. Financial figures are in ₹ Mn (millions of Indian rupees) as printed on the slides; EPS is in ₹ and ASP/discounts are in ₹ per car (e.g., ASP 791k → 807k).
Yes. The page offers the original PDF and an editable PPTX converted from it, which you can reuse as a layout reference for an automotive quarterly results deck. Always cite Hyundai Motor India as the source when quoting its figures.
A Hyundai corporate style: light-grey backgrounds, navy typography, angled light-blue title banners, 3D gradient bar charts, red/green waterfall bridges, navy-header data tables, and full-bleed product photography on the cover and closing slides.
Original filing including the cover letter.

Create Your Own Slides
Turn your ideas into professional presentations in seconds with 2slides AI.
Sæktu innblástur í faglega hönnun, veldu þinn stíl og búðu til glærur með fullkominni textabirtingu. Knúið af Nano Banana—byrjaðu að búa til kynninguna þína núna.
Þinn AI-þjónn fyrir glærur. Sparaðu tíma, skín hraðar með snjallri kynningargerð.


© 2026 2slides. Allur réttur áskilinn.