
Hluti af safninu Dæmi um fjárfestakynningar · Dæmi um japanskar fjárfestakynningar
FANUC H1 FY2026 Earnings Presentation: record-pace first-half results (net sales ¥473.7 billion, operating profit ¥116.7 billion) and an upward-revised full-year forecast above ¥1 trillion in sales
Notar forsíðu þessarar kynningar sem stílfyrirmynd fyrir glærur úr þínu eigin efni. Eða veldu hvaða síðu sem er hér fyrir neðan og notaðu uppsetningu hennar sem fyrirmynd.
Flýtileiðsögn
Merki
Deila glærunum
FANUC H1 FY2026 Earnings Presentation: record-pace first-half results (net sales ¥473.7 billion, operating profit ¥116.7 billion) and an upward-revised full-year forecast above ¥1 trillion in sales
Ítarleg sýn á hverja glærusíðu, þar á meðal útlit, lykilefni og sjónræna þætti.
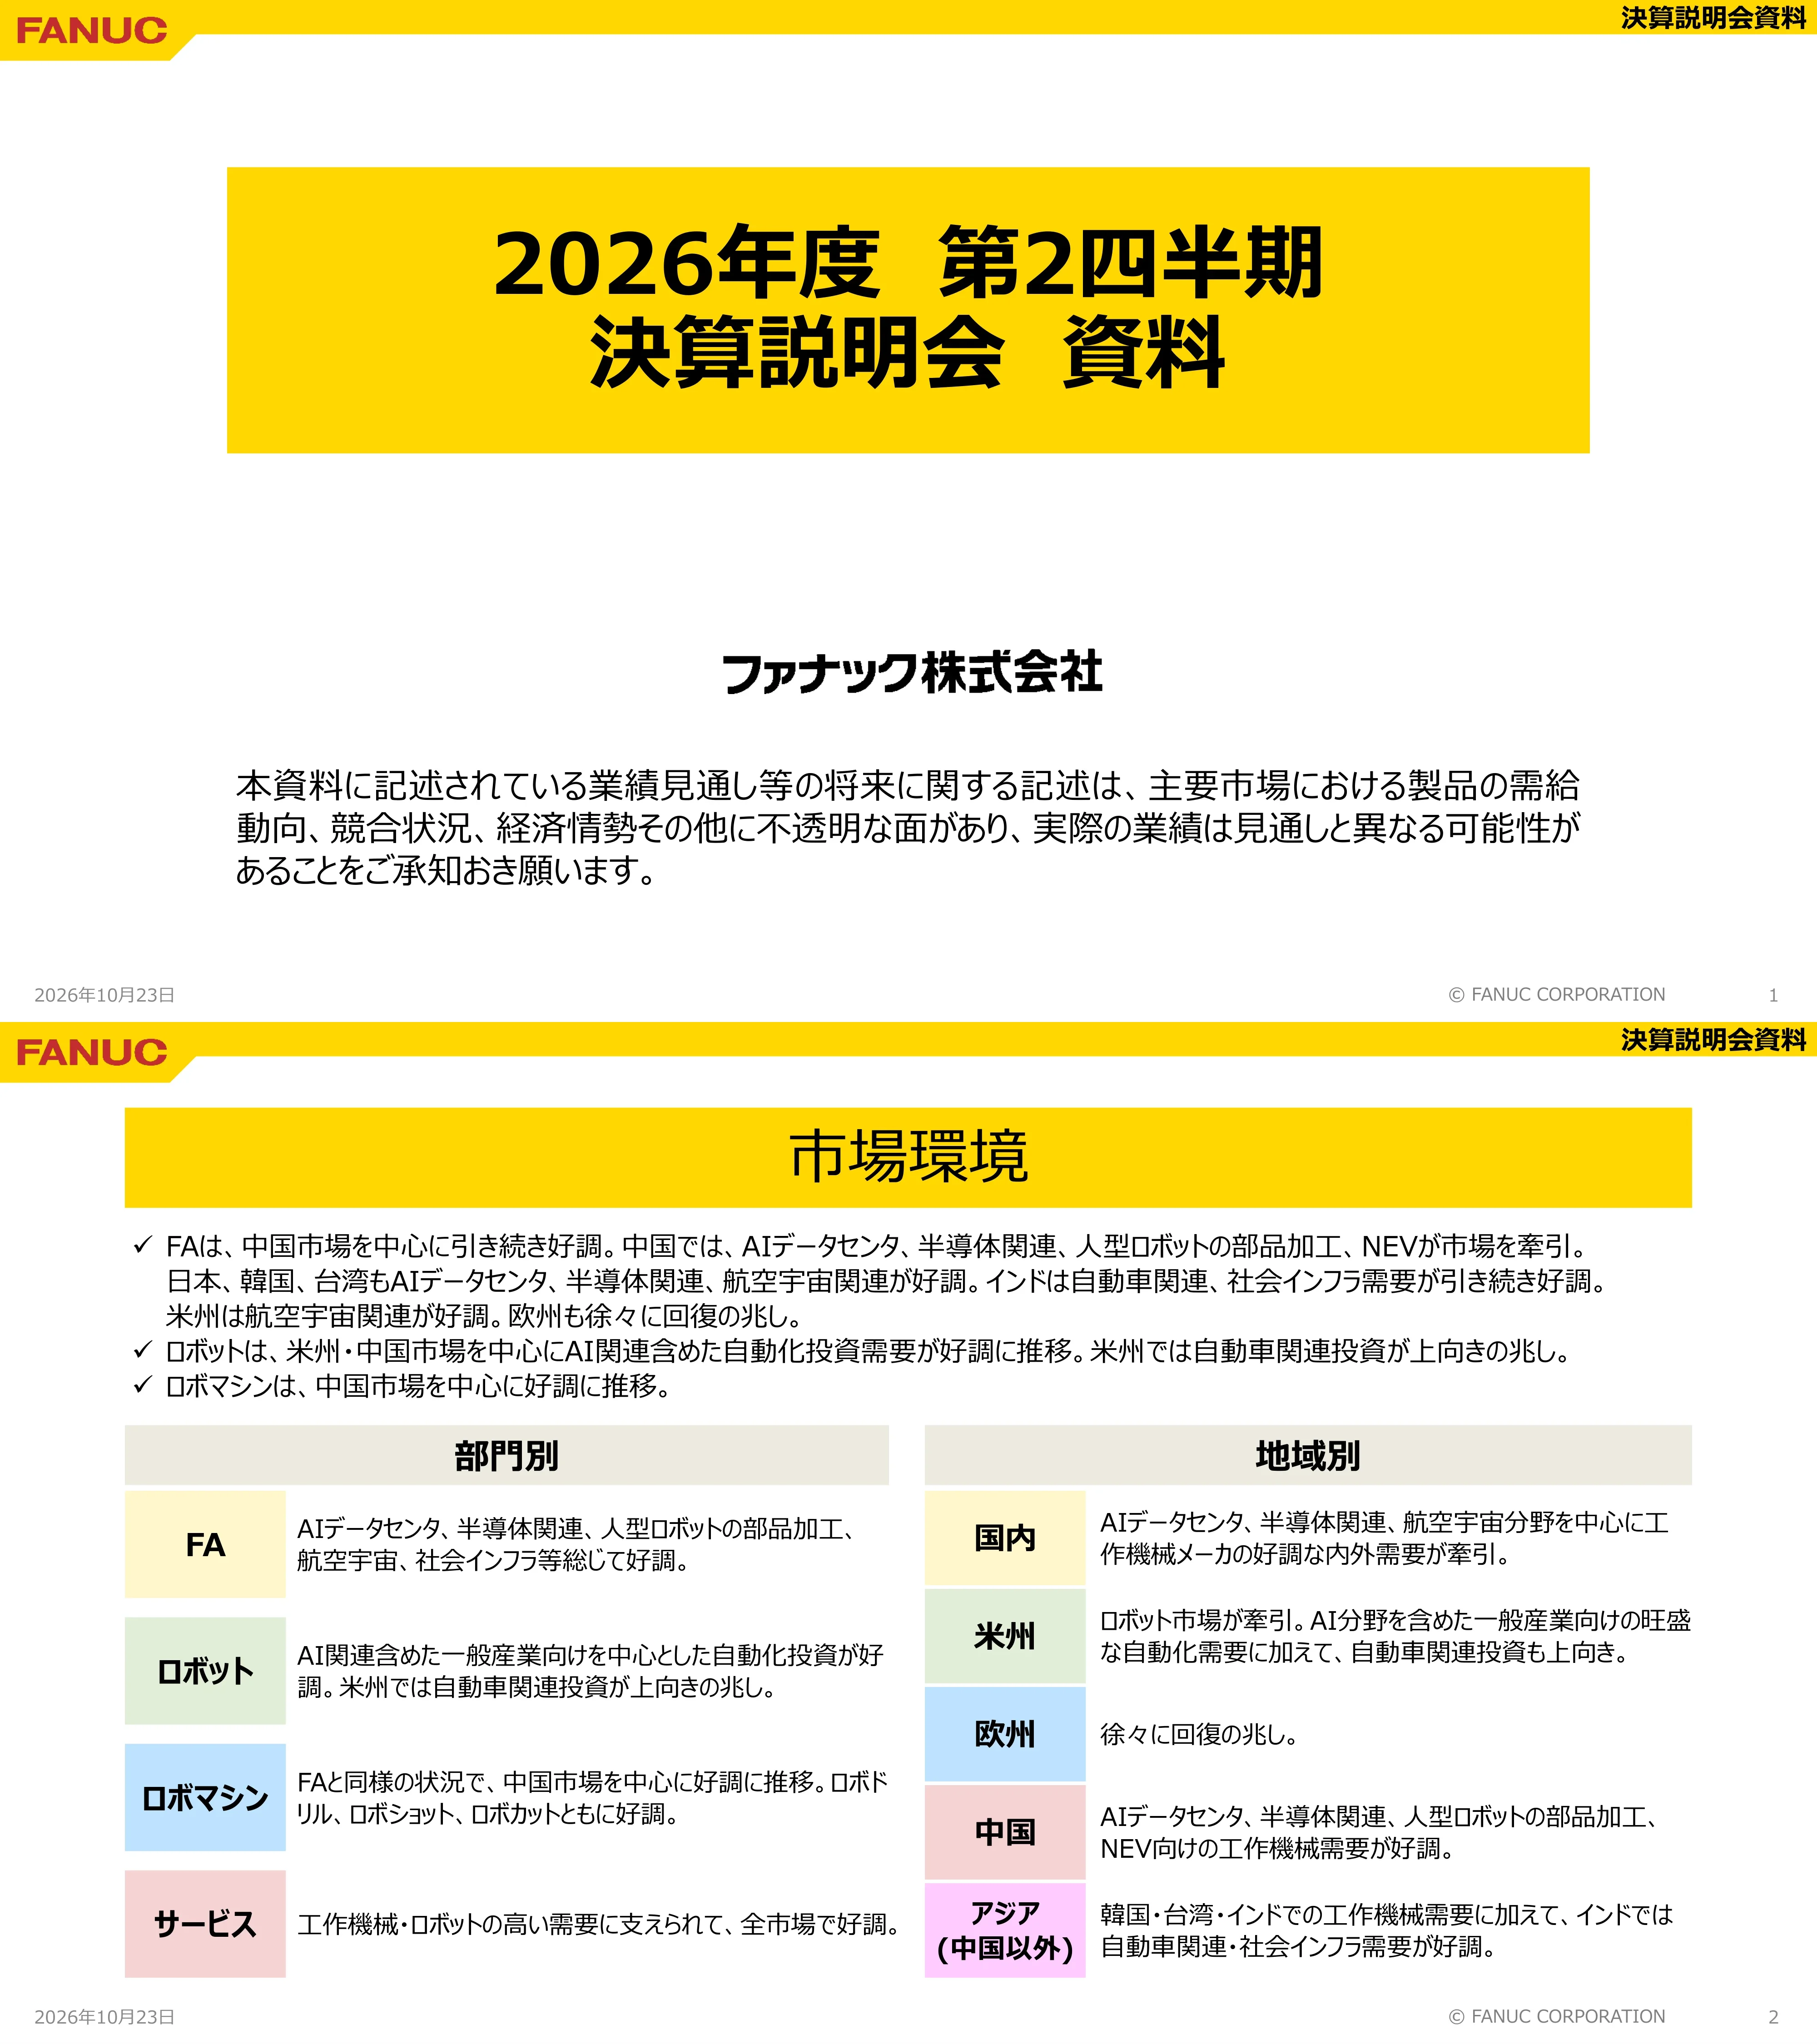
Title slide reading 'Fiscal 2026 Second Quarter Earnings Presentation' (2026年度 第2四半期 決算説明会資料) from FANUC Corporation, dated October 23, 2026. A short disclaimer notes that forward-looking statements such as the earnings outlook involve uncertainty over product supply and demand in major markets, competition and the economy, so actual results may differ.
Yellow header band with the red FANUC logo at top left and the label 'Earnings presentation materials' at top right. A large yellow title box sits in the upper center, the company name below it, and the disclaimer paragraph at the bottom. Date at bottom left, copyright and page number at bottom right.
Qualitative market commentary. FA stayed strong centered on China, driven by AI data centers, semiconductors, humanoid-robot parts machining and NEV; Japan, Korea and Taiwan were strong in AI data centers, semiconductors and aerospace; India was strong in automotive and social infrastructure; the Americas were strong in aerospace; Europe showed signs of gradual recovery. Robots saw strong automation investment centered on the Americas and China including AI-related demand, with automotive investment turning up in the Americas. ROBOMACHINE was strong centered on China. A table breaks this down by segment (FA, Robots, ROBOMACHINE, Service) and by region (Japan, Americas, Europe, China, Asia ex-China).
Yellow title bar, three check-mark summary bullets, then two side-by-side tables: 'By segment' at left and 'By region' at right, each row with a color-coded label cell and a one- or two-line comment.
Two KPI panels. H1 FY2026 consolidated results (YoY): net sales ¥4,737 (100 million yen units, +¥661), operating profit ¥1,167 (+¥307) with an operating margin of 24.6% (+3.5pt), net income ¥1,126 (+¥328) with a net margin of 23.8% (+4.2pt). FX rates: ¥159.37/USD, ¥184.35/EUR. Full-year FY2026 forecast (YoY): net sales ¥10,137 (+¥1,559), operating profit ¥2,407 (+¥569, margin 23.7%, +2.3pt), net income ¥2,283 (+¥618, margin 22.5%, +3.1pt). Notes: FA, Robots and ROBOMACHINE all grew; the forecast was revised upward and sales are expected to exceed the prior record year and top ¥1 trillion. Second-half FX assumption ¥150/USD and ¥175/EUR; full-year ¥154.69/USD and ¥179.68/EUR.
Two rounded panels side by side (H1 actuals at left, full-year forecast at right). Each has three stacked yellow KPI cards (sales, operating profit, net income) with margin callouts to their right and check-mark bullets plus FX notes below.
Income statement table in ¥100 million units comparing H1 FY2025 actual, H2 FY2025 actual, H1 FY2026 forecast and H1 FY2026 actual. Net sales 4,076 / 4,503 / 4,660 / 4,737 (+16.2% YoY, +5.2% vs H2, +1.7% vs forecast). Cost of sales 2,520 / 2,774 / 2,858 / 2,800 (59.1% of sales). Operating profit 860 / 978 / 1,044 / 1,167 (24.6% margin, +35.7% YoY). Ordinary profit 1,079 / 1,196 / 1,349 / 1,490 (+38.1%). Net income 798 / 867 / 1,003 / 1,126 (+41.0%). FX: 146.04 / 155.51 / 154.75 / 159.37 yen per USD and 168.06 / 181.52 / 180.20 / 184.35 yen per EUR. Net income means profit attributable to owners of the parent.
Full-width financial table with the H1 FY2026 actual column highlighted in pale yellow with a gold border; three growth-rate columns at right (vs prior-year H1, vs H2, vs prior forecast); FX rows at the bottom.
Seven half-year periods from H1 FY2023 to H1 FY2026. Net sales: 3,987, 3,966, 3,880, 4,092, 4,076, 4,503, 4,737. Operating margin rises from 16.7% to 24.6%. Ordinary profit: 862, 956, 948, 1,020, 1,079, 1,196, 1,490. Net income: 639, 692, 699, 776, 798, 867, 1,126. The latest period is highlighted in yellow.
Combination chart: a red line for sales at top, a grey line for operating margin in the middle, and paired grey bars (ordinary profit, net income) at the bottom, with period labels below. Latest period labeled in bold with yellow bars.
Waterfall from H1 FY2025 operating profit of ¥86.0 billion (860) to H1 FY2026 of ¥116.7 billion (1,167). Drivers: sales change +235, cost variance +27, unrealized profit effect +17, SG&A -37, other +65.
Single waterfall chart across the slide: grey start and end bars, green increase bars, one blue decrease bar, category labels on the x-axis, unit note at top right.
Three-month table for July-September 2026 versus Q2 FY2025 and Q1 FY2026. Net sales 2,112 / 2,310 / 2,427 (+14.9% YoY, +5.0% QoQ). Cost of sales 1,322 / 1,399 / 1,401 (57.7% of sales). Operating profit 435 / 535 / 632 (26.0% margin, +45.1% YoY, +18.1% QoQ). Ordinary profit 564 / 682 / 809 (+43.5%, +18.6%). Net income 420 / 510 / 616 (+46.7%, +20.8%). FX: 147.48 / 159.49 / 159.25 yen per USD; 172.32 / 185.39 / 183.32 yen per EUR.
Same table format as page 4 with the Q2 column highlighted in pale yellow and two growth-rate columns (YoY and vs previous quarter).
Seven quarters from Q4 FY2024 to Q2 FY2026. Net sales: 2,121, 1,964, 2,112, 2,157, 2,345, 2,310, 2,427. Operating margin: 22.8%, 21.6%, 20.6%, 19.3%, 23.9%, 23.2%, 26.0%. Ordinary profit: 573, 516, 564, 514, 682, 682, 809. Net income: 448, 378, 420, 370, 497, 510, 616.
Same combination chart design as page 5 (sales line, margin line, paired profit bars) with quarterly axis labels; latest quarter highlighted in yellow.
Waterfall from Q1 FY2026 operating profit of ¥53.5 billion (535) to Q2 FY2026 of ¥63.2 billion (632). Drivers: sales change +105, cost variance -18, unrealized profit effect +28, SG&A -19, other +1.
Single waterfall chart identical in style to page 6, with grey end bars, green gains and blue decreases.
Five quarters of sales by segment (¥100 million): totals 2,112, 2,157, 2,345, 2,310, 2,427. Q2 FY2026: FA 625, Robots 982, ROBOMACHINE 416, Service 403. Growth YoY / QoQ: total +14.9% / +5.0%, Service +12.5% / +12.1%, ROBOMACHINE +40.8% / -0.1%, Robots +7.2% / +2.2%, FA +15.4% / +9.1%. Q2 mix: Robots 40.5%, FA 25.8%, ROBOMACHINE 17.1%, Service 16.6%.
Five stacked columns with connecting trend lines, color-coded by segment (FA yellow, Robots green, ROBOMACHINE blue, Service pink); a growth table at right and a mix-ratio table beneath the chart with the latest quarter outlined in gold.
Five quarters of sales by region, totals 2,112 to 2,427. Q2 FY2026: Japan 317, Americas 674, Europe 386, China 665, Asia ex-China 357, Other 27. Growth YoY / QoQ: Asia ex-China +17.2% / +0.1%, China +20.8% / -4.1%, Europe +5.7% / +1.1%, Americas +12.9% / +16.1%, Japan +17.1% / +14.9%. Mix: Americas 27.8%, China 27.4%, Asia ex-China 14.7%, Europe 15.9%, Japan 13.1%.
Same format as page 10 but split by region: stacked columns, growth table at right, mix-ratio table below.
Five quarters of orders by segment (¥100 million), totals 2,053, 2,202, 2,520, 2,819, 3,060. Q2 FY2026: FA 1,122, Robots 1,034, ROBOMACHINE 512, Service 393. Growth YoY / QoQ: total +49.0% / +8.5%, Service +12.0% / +8.3%, ROBOMACHINE +72.3% / -11.1%, Robots +12.6% / +5.6%, FA +130.1% / +24.4%. FA now makes up 36.7% of orders versus 23.7% a year earlier.
Stacked columns with growth table at right and an order-mix table below; the latest quarter is highlighted.
Orders by region over five quarters, totals 2,053 to 3,060. Q2 FY2026: Japan 430, Americas 645, Europe 392, China 912, Asia ex-China 653, Other 29. Growth YoY / QoQ: Asia ex-China +111.9% / +33.1%, China +79.8% / +2.8%, Europe +5.3% / +0.8%, Americas +15.0% / +2.7%, Japan +54.3% / +9.4%. China is 29.8% of orders and Asia ex-China 21.3%.
Stacked regional columns, growth table at right, order-mix table below.
Three small bar charts (¥100 million) for 2021 to 2025 and H1 2026. Capex: 411, 531, 525, 401, 220, and 182 in H1 2026. Depreciation: 471, 492, 490, 464, 478, and 231 in H1. R&D expense: 500, 519, 498, 467, 450, and 225 in H1.
Three equal panels side by side, each with a pale yellow header tab and grey bars; the latest half-year bar is in gold.
FY2026 forecast table (¥100 million). Net sales: FY2025 actual 8,578, prior forecast 9,481, new forecast 10,137 (+18.2% YoY, +6.9% vs prior forecast). Cost of sales 5,294 / 5,768 / 6,093. Operating profit 1,838 / 2,180 / 2,407 (23.7% margin, +31.0%, +10.4%). Ordinary profit 2,275 / 2,712 / 3,088 (+35.7%, +13.9%). Net income 1,665 / 1,980 / 2,283 (+37.1%, +15.3%). FX: 150.77 / 152.37 / 154.69 yen per USD and 174.79 / 177.60 / 179.68 yen per EUR; H2 assumption ¥150/USD and ¥175/EUR.
Wide table with the FY2026 forecast block (prior and new) framed in gold and the new forecast column emphasized; two growth columns at right and a side note on H2 FX assumptions.
International Manufacturing Technology Show 2026, held September 14-20, 2026 at McCormick Place in Chicago. 1,788 exhibitors (prior show 1,737); about 91,000 registered visitors (about +2.6% vs prior show). One of the world's four major machine tool shows. Attendance has not returned to pre-COVID levels but exceeded the previous show and the hall was lively. Capital investment in AI, semiconductors, defense and aerospace was active, with strong interest in AI, robots and automation. The FANUC booth drew many visitors.
Yellow title bar, an 'Overview' tag with the show name, a three-photo collage at left (booth panorama plus two crowd shots) and fact lines and bullets at right.
FA exhibits featured Physical AI CNC, digital twin, 500i-A, FANUC iPC and the αi-D series servo. Interest was high in Physical AI CNC for better surface finish and alarm resolution; the concept of verifying generative-AI output in a digital twin before applying it to the real machine was well received. The 500i-A's control performance for high-precision machining and shorter cycle times, and the compact, energy-saving αi-D servos, were also promoted.
Tag label 'FA exhibits', three bullets, and a row of three booth photographs along the bottom.
Introduces Physical AI CNC and digital twin, FANUC Series 500i-A and αi-D series servo (low-voltage drive servo system). Bullets: positioned CNC and servo systems under the theme of Digital Intelligence integration, replacing intellectual work with AI and digital twins; promoted FANUC CNC adoption by machine builders by showing benefits from the machine user's perspective; a 5-axis integrated initiative with partner machine builders, with growing support including CAM makers; 'Factory AI', which analyzes FsBP and ZDT data with generative AI, drew strong response (FsBP: FIELD system Basic Package; ZDT: Zero Down Time).
Left side holds product images (Physical AI CNC concept, digital twin screen, 500i-A control, servo amplifiers and motors) with captions; right side holds four bullets under a two-line product heading.
A total of 43 robots were shown, including 32 collaborative robots. Five Physical AI systems were displayed, with partnerships with NVIDIA and Google promoted in North America. Practicality drew strong response, with many inquiries about AI-agent kitting and the dual-arm connector assembly cell. Photo captions: Physical AI corner, kitting by AI agent, connector assembly with dual-arm CRX-5iA, and natural-language work instructions via generative AI.
Three bullets at top and a strip of four photographs with bold captions along the bottom.
M-2000 carrying a finished car demonstrated fast, accurate heavy-load handling. Two R-2000/E series robots were praised for better motion performance, energy saving and maintenance-free operation. A DC-compatible controller for the CRX was shown for the first time in the world, with a live demonstration of its compact size for embedding in an AMR.
Three bullets and three equal photographs: the M-2000 lifting a car, R-2000 robots in a glass enclosure, and a CRX on a mobile base for machine tending.
ROBODRILL D54CS, D74CS and D116CS, ROBOCUT α-C400iC and ROBOSHOT α-S100iB ran a range of machining and molding demonstrations, showing high basic performance and wide applicability. The new ROBODRILL D116CS with an enlarged table stroke made its first overseas appearance and was praised for improved productivity and stability. Practical automation systems using collaborative robots were shown for ROBODRILL, ROBOCUT and ROBOSHOT, and high system linkage with robots and long unmanned operation attracted visitor interest.
Tag label, four bullets and a row of three photographs (D116CS, injection molding machine, wire EDM cell with a collaborative robot).
ROBODRILL DC series: the D116CS (first overseas exhibit) and D54CS (first exhibit in the Americas). Improved basic performance with an enlarged table stroke; faster machine motion shortens machining time; thermal displacement countermeasures improve machining stability; improved internal structure and coolant piping raise chip evacuation, boosting shop-floor productivity and contributing to energy saving and sustainability. Well received by existing ROBODRILL users and many other visitors, contributing to expanded business opportunities.
Product photos of both machines at left with red first-exhibit badges, four bullets at right.
Section divider introducing the supplementary data pages (補足資料).
Mostly empty white slide with a wide yellow band in the lower middle carrying the word 'Appendix' at its lower left.
Repeats the segment sales page: totals 2,112, 2,157, 2,345, 2,310, 2,427; Q2 FY2026 FA 625, Robots 982, ROBOMACHINE 416, Service 403; total growth +14.9% YoY and +5.0% QoQ; segment mix Robots 40.5%, FA 25.8%, ROBOMACHINE 17.1%, Service 16.6%.
Identical to page 10: stacked columns, growth table at right, mix table below.
FA sales by region over five quarters, totals 542, 498, 548, 574, 625. Q2 FY2026: China 266, Asia ex-China 167, Japan 132, Europe 44, Americas 15, Other 1. Growth YoY / QoQ: total +15.4% / +9.1%, China +25.6% / +19.1%, Europe +16.0% / -2.8%, Americas +33.3% / -6.3%, Japan +8.3% / -1.4%, Asia ex-China +6.5% / +9.0%. China is 42.6% of FA sales.
Stacked regional columns, growth table at right, region-mix table below.
Robot sales by region over five quarters, totals 916, 966, 1,094, 961, 982. Q2 FY2026: Americas 460, Europe 192, China 181, Japan 70, Asia ex-China 68, Other 13. Growth YoY / QoQ: total +7.2% / +2.2%, Asia ex-China +65.7% / +27.5%, China -14.3% / -32.0%, Europe +4.4% / -1.5%, Americas +11.8% / +19.5%, Japan +21.8% / +35.9%. The Americas make up 46.8% of Robot sales.
Stacked regional columns, growth table and mix table in the same format as the other segment pages.
ROBOMACHINE sales by region over five quarters, totals 296, 330, 331, 417, 416. Q2 FY2026: China 207, Asia ex-China 94, Japan 42, Europe 40, Americas 26, Other 7. Growth YoY / QoQ: total +40.8% / -0.1%, Asia ex-China +16.3% / -25.2%, China +74.3% / +6.7%, Europe -2.1% / -4.3%, Americas -17.3% / +16.4%, Japan +108.6% / +43.4%. China accounts for 49.7%.
Stacked regional columns with growth and mix tables, same style as other appendix pages.
Service sales by region over five quarters, totals 358, 363, 372, 359, 403. Q2 FY2026: Americas 173, Europe 110, Japan 74, Asia ex-China 29, China 11, Other 7. Growth YoY / QoQ: total +12.5% / +12.1%, Asia ex-China +8.7% / +14.2%, China +26.7% / +14.4%, Europe +7.3% / +10.2%, Americas +21.1% / +10.0%, Japan +2.8% / +19.8%. Footnote: service sales by equity-method affiliates in China are not included in consolidated sales.
Stacked regional columns with growth and mix tables, plus a footnote box at lower right.
Repeats the regional sales page: totals 2,112 to 2,427; Q2 FY2026 Japan 317, Americas 674, Europe 386, China 665, Asia ex-China 357, Other 27; total growth +14.9% YoY and +5.0% QoQ.
Identical to page 11: stacked columns, growth table, mix table.
Japan sales by segment over five quarters, totals 271, 291, 292, 276, 317. Q2 FY2026: FA 132, Robots 70, ROBOMACHINE 42, Service 74. Growth YoY / QoQ: total +17.1% / +14.9%, Service +2.8% / +19.8%, ROBOMACHINE +108.6% / +43.4%, Robots +21.8% / +35.9%, FA +8.3% / -1.4%. FA is 41.7% of Japan sales.
Stacked segment columns, growth table at right, mix table below, latest quarter outlined in gold.
Americas sales by segment over five quarters, totals 597, 580, 666, 581, 674. Q2 FY2026: Robots 460, Service 173, ROBOMACHINE 26, FA 15. Growth YoY / QoQ: total +12.9% / +16.1%, Service +21.1% / +10.0%, ROBOMACHINE -17.3% / +16.4%, Robots +11.8% / +19.5%, FA +33.3% / -6.3%. Robots are 68.2% of Americas sales.
Stacked segment columns with growth and mix tables, same format as page 30.
Europe sales by segment over five quarters, totals 365, 392, 422, 382, 386. Q2 FY2026: Robots 192, Service 110, FA 44, ROBOMACHINE 40. Growth YoY / QoQ: total +5.7% / +1.1%, Service +7.3% / +10.2%, ROBOMACHINE -2.1% / -4.3%, Robots +4.4% / -1.5%, FA +16.0% / -2.8%. Robots are 49.6% of Europe sales.
Stacked segment columns with growth and mix tables.
China sales by segment over five quarters, totals 550, 579, 622, 693, 665. Q2 FY2026: FA 266, Robots 181, ROBOMACHINE 207, Service 11. Growth YoY / QoQ: total +20.8% / -4.1%, Service +26.7% / +14.4%, ROBOMACHINE +74.3% / +6.7%, Robots -14.3% / -32.0%, FA +25.6% / +19.1%. FA is 40.1% and ROBOMACHINE 31.1% of China sales. Footnote on equity-method service sales.
Stacked segment columns with growth and mix tables plus a footnote at lower right.
Asia (excluding China) sales by segment over five quarters, totals 305, 288, 316, 357, 357. Q2 FY2026: FA 167, Robots 68, ROBOMACHINE 94, Service 29. Growth YoY / QoQ: total +17.2% / +0.1%, Service +8.7% / +14.2%, ROBOMACHINE +16.3% / -25.2%, Robots +65.7% / +27.5%, FA +6.5% / +9.0%. FA is 46.7% of the region's sales.
Stacked segment columns with growth and mix tables, the same format as the other regional pages.
Closing slide with only the large red FANUC logo centered on a white background.
Standard header band and footer with a single centered logo and a lot of white space.
Algengar spurningar um þessa glæru og undirliggjandi kynningarefni.
It is FANUC Corporation's (TSE: 6954) second-quarter FY2026 earnings briefing dated October 23, 2026. It covers H1 results (net sales ¥473.7 billion, operating profit ¥116.7 billion, net income ¥112.6 billion), Q2 three-month results, orders, segment and regional breakdowns, the raised full-year forecast, and an IMTS 2026 trade show report.
The original is in Japanese. It is the 2026年度 第2四半期 決算説明会資料 (fiscal 2026 Q2 earnings briefing materials) that FANUC published through TDnet, the Tokyo Stock Exchange timely disclosure system. All figures are shown in ¥100 million (億円) units, so ¥4,737 means ¥473.7 billion.
Net sales were ¥4,737 (100 million yen), up 16.2% YoY; operating profit ¥1,167, up 35.7% with a 24.6% margin; ordinary profit ¥1,490; net income ¥1,126, up 41.0%. The yen averaged ¥159.37 per USD and ¥184.35 per EUR.
Yes. The FY2026 forecast was raised to net sales ¥10,137 (prior ¥9,481), operating profit ¥2,407 (prior ¥2,180) and net income ¥2,283 (prior ¥1,980). The company says sales are expected to exceed the prior record year and pass ¥1 trillion. The H2 assumption is ¥150/USD and ¥175/EUR.
Q2 orders were ¥3,060 (100 million yen), up 49.0% YoY, with FA orders up 130.1% to ¥1,122. Q2 sales by segment were Robots ¥982, FA ¥625, ROBOMACHINE ¥416 and Service ¥403. Region-by-segment appendix pages (25-34) show where the growth came from, with China and the Americas the largest regions.
This page offers the original PDF of the deck plus an editable PPTX converted from the PDF. The PPTX is handy for reusing tables and layouts, though a PDF-to-PowerPoint conversion may need some manual cleanup of fonts and chart objects.
The deck uses FANUC's corporate look: a yellow header band with the red logo, yellow title bars, white backgrounds and pastel segment colors. Its repeatable patterns (results tables, trend charts, waterfall bridges, stacked columns with growth and mix tables) make it a good reference for building your own earnings presentation.
Pages 16-22 report on FANUC's exhibit at IMTS 2026 in Chicago (September 14-20, 2026; about 91,000 registered visitors). Highlights include Physical AI CNC with digital twin, the 500i-A CNC, 43 robots including 32 collaborative robots, a world-first DC controller for the CRX, and the ROBODRILL D116CS making its overseas debut.

Create Your Own Slides
Turn your ideas into professional presentations in seconds with 2slides AI.
Sæktu innblástur í faglega hönnun, veldu þinn stíl og búðu til glærur með fullkominni textabirtingu. Knúið af Nano Banana—byrjaðu að búa til kynninguna þína núna.
Þinn AI-þjónn fyrir glærur. Sparaðu tíma, skín hraðar með snjallri kynningargerð.


© 2026 2slides. Allur réttur áskilinn.