
Hluti af safninu Dæmi um fjárfestakynningar · Dæmi um indverskar fjárfestakynningar
Cholamandalam Investment and Finance Corporate Presentation September 2026 (Q2 FY27 / H1 FY27) - the Murugappa group NBFC's 103-slide investor deck, filed with BSE/NSE, covering vehicle finance, loan against property, home loans, SME, SBPL, CSEL and gold loans, with all amounts in Indian rupees (Rs crore).
Notar forsíðu þessarar kynningar sem stílfyrirmynd fyrir glærur úr þínu eigin efni. Eða veldu hvaða síðu sem er hér fyrir neðan og notaðu uppsetningu hennar sem fyrirmynd.
Flýtileiðsögn
Merki
Deila glærunum
Cholamandalam Investment and Finance Corporate Presentation September 2026 (Q2 FY27 / H1 FY27) - the Murugappa group NBFC's 103-slide investor deck, filed with BSE/NSE, covering vehicle finance, loan against property, home loans, SME, SBPL, CSEL and gold loans, with all amounts in Indian rupees (Rs crore).
Ítarleg sýn á hverja glærusíðu, þar á meðal útlit, lykilefni og sjónræna þætti.
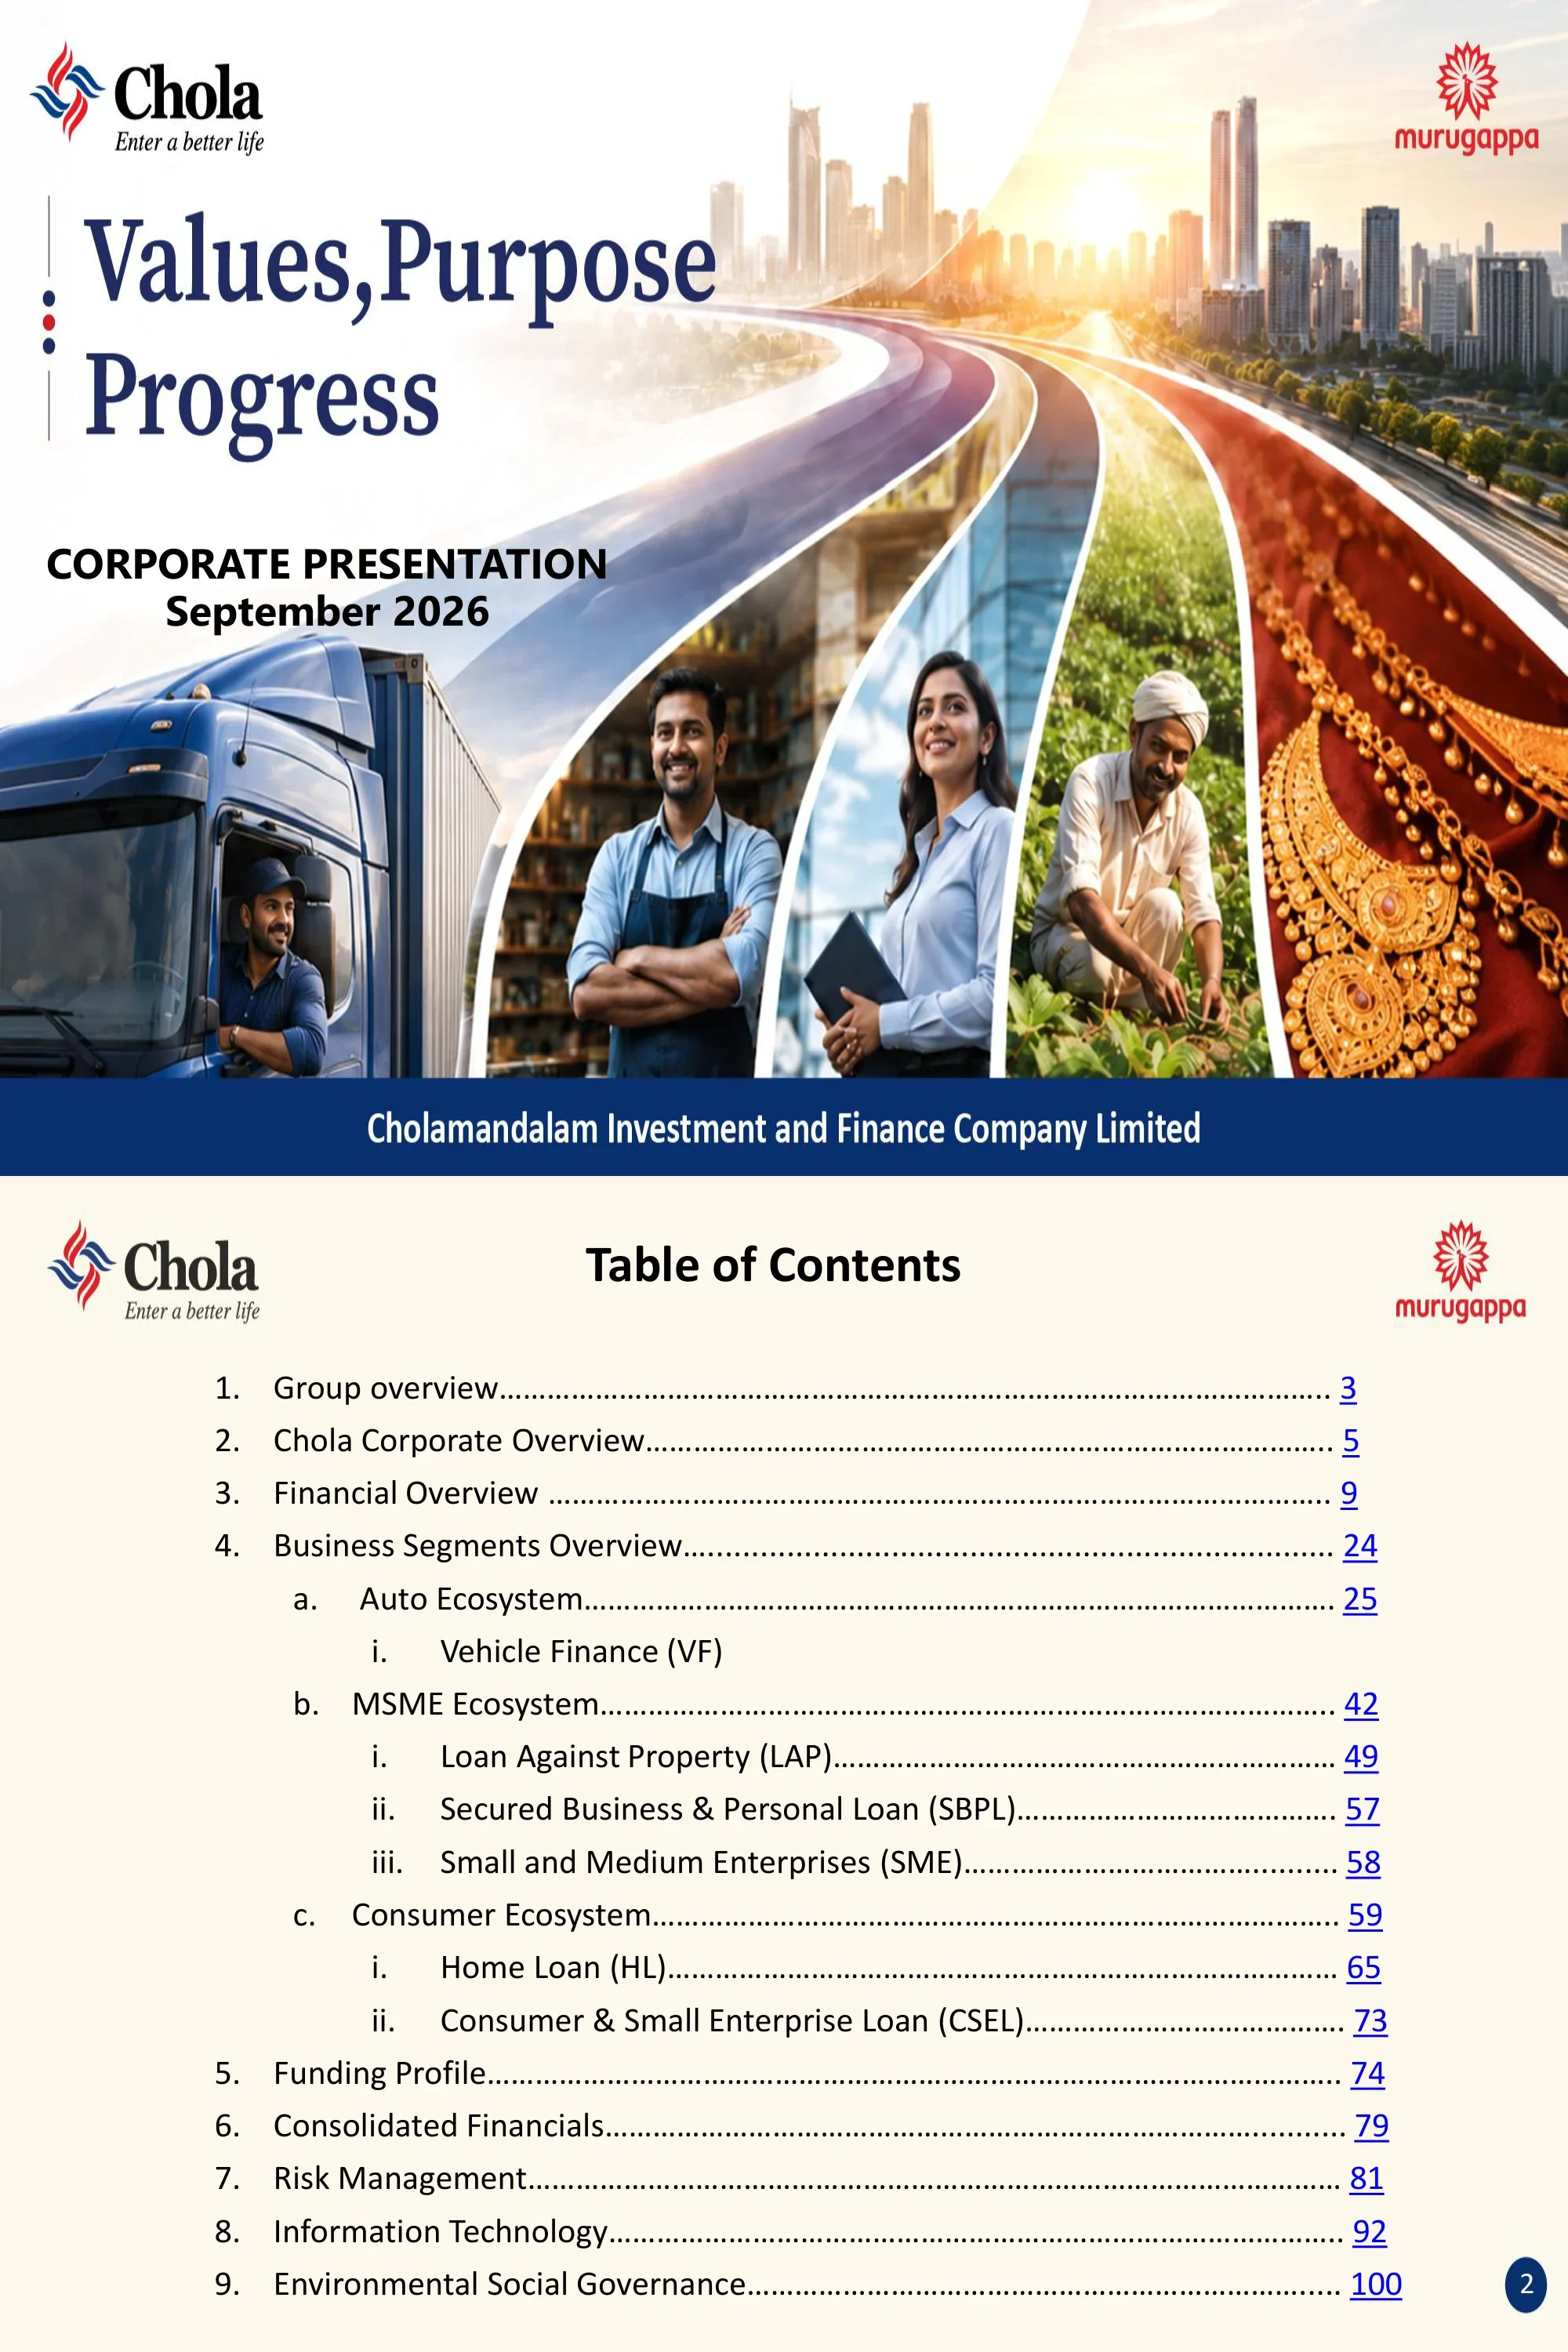
Cover of Cholamandalam Investment and Finance Company's September 2026 corporate presentation, showing the Chola 'Enter a better life' logo and the Murugappa group logo.
Full-bleed illustrated cover: navy serif title at top left, a curving highway splitting into lanes with a truck driver, shopkeeper, businesswoman and farmer heading toward a sunlit city skyline, solid navy footer band with the company name
Nine sections with page references: Group overview (3), Chola Corporate Overview (5), Financial Overview (9), Business Segments (24) covering the Auto ecosystem (VF), MSME ecosystem (LAP, SBPL, SME) and Consumer ecosystem (HL, CSEL), Funding Profile (74), Consolidated Financials (79), Risk Management (81), Information Technology (92) and ESG (100).
Cream background, centered bold title, numbered multi-level list with dotted leaders to blue underlined page numbers
Section divider introducing the Murugappa Group, Chola's promoter.
Section divider: blue-to-purple gradient panel with a red chevron edge and white title, beside a greyscale stock photo of a white curved art-deco office building
Group companies across Agriculture, Engineering and Financial Services with market cap, turnover and PAT in Rs Cr (Chola: market cap 1,38,574, turnover 31,073, PAT 5,233). KPI circles: 126 years of existence, $11.1B consolidated turnover (FY26), $46.16B group market cap (30 Sep 2026), 10 listed companies, 50 countries, 113 manufacturing locations, 29+ businesses and a 94,000+ workforce. The 'Spirit of the Murugappa Group' lists five values: Integrity, Responsibility, Passion, Respect, Quality.
Three blue rounded panels by sector with arrow-shaped row labels, a red values artwork bottom left and a 2x4 grid of navy-ringed KPI circles bottom right
Section divider for the Chola corporate overview.
Section divider: blue-to-purple gradient panel with a red chevron edge and white title, beside a greyscale stock photo of an eye with a technology HUD overlay
Timeline from FY1979 to FY2027: equipment and vehicle finance origins, the 2006 DBS joint venture (ended 2011), launches of Tractor (2012), Home Loans (2013), CE (2014), the GaadiBazaar dealer platform (2017), PAT above Rs 1,000 Cr (2019), CSEL, SBPL and SME launches (2022), a Rs 4,000 Cr QIP (2024), the Gold loan launch with AUM above Rs 2.42 lakh Cr (FY2026), and total AUM above Rs 2.68 lakh Cr with a 2,647 branch/RLH network and 308 gold-loan branches by Sep 2026 (FY2027).
Horizontal alternating blue and red chevron timeline with teal-outlined text boxes alternating above and below
Q2 FY27 disbursements up 47% to Rs 35,872 Cr (H1 up 34% to Rs 65,484 Cr); business AUM Rs 2,48,045 Cr, up 25%; NIM 7.9% in Q2 and 8.0% in H1; PBT up 40% to Rs 2,188 Cr (H1 up 43% to Rs 4,409 Cr); PBT-ROTA 3.4%; ROE 19.4% in Q2 and 20.3% in H1; Stage 3 at 3.25% vs 3.35%; RBI GNPA 4.44% and NNPA 2.92%; CAR 20.62% with Tier I at 16.02%. A segment table lists 79,491 employees, 1,958 branches and 56,84,731 customers across VF, LAP, HL, CSEL, SBPL, SME and Gold.
Blue-header comparison table with alternating lavender rows, above a navy-header segment table of employees, branches and customers
India map of 1,958 branches across 26 states and 7 union territories (branch counts by state as of 30 Sep 2026, Karnataka 212 the largest). Charts show physical branches 1,650, RL 689 and Gold 308 in Q2 FY27; the regional mix (South rising to 40%); and a rural / semi-urban / urban split of 79% / 10% / 11%. 85% of locations are in Tier-III to Tier-VI towns.
India state map with colored regions and bracketed branch counts on the left, three stacked-column charts on the right, bullets below
Section divider for the financial overview.
Section divider: blue-to-purple gradient panel with a red chevron edge and white title, beside a greyscale stock photo of a hand drawing a rising arrow over candlestick charts
FY12 to FY26 history in Rs Cr, banded into Recovery and Stabilisation, COVID and New Growth eras. Disbursements grew from 8,889 to 1,11,642, AUM from 13,846 to 2,42,630, and PAT from 173 to 5,220 (15-year PAT CAGR 28%). FY26 ratios: ROE 19.7%, ROA-PAT 2.5%, net income to assets 8.0%, cost to net income 38.5%, CAR 19.2%, GNPA 4.4%, NNPA 2.9%, net worth Rs 30,404 Cr, market cap Rs 1,15,353 Cr and 2,452 branches.
Dense multi-year table with color-banded era headers (green, yellow, dark green), IGAAP vs IndAS row groups, YoY and 5/10/15-year CAGR columns
Well-diversified product segments. Q2 FY27 disbursements of Rs 35,872 Cr split Auto 50%, MSME 26%, Consumer 24% (LAP 18%, used vehicles 15%, CSEL 12%). The Rs 2,48,045 Cr AUM splits Auto 52%, MSME 29%, Consumer 19% (LAP 23%, used vehicles 14%, LCV and HL 10% each).
Two boxed concentric donut charts: the inner ring shows the ecosystem and the outer ring the product, with totals in the center
Disbursements by product in Rs Cr: Q1 FY27 29,612 (+22%), Q2 FY27 35,872 (+47%) and H1 FY27 65,484 (+34%). VF was 17,801 in Q2 FY27 and Gold rose to 1,960. The VF share fell to 50% in Q2 FY27 while CSEL rose to 12% and Gold to 5%.
Left: stacked columns with ecosystem tabs (Auto, MSME, Consumer) and growth arrows; right: 100% stacked bars of product share
AUM by product in Rs Cr: Q2 FY27 2,48,045 vs 1,99,159 (+25%); Q1 FY27 2,33,586 (+22%). VF 1,29,787, LAP 57,447, HL 25,240, CSEL 17,216, SME 10,943, SBPL 3,966, Gold 3,446. The mix is stable, with VF at 53% and LAP at 23%.
Same two-box layout as the disbursement page: stacked columns plus 100% share bars
PAT rose to Rs 1,654 Cr in Q1 FY27 (+46%), Rs 1,630 Cr in Q2 FY27 (+41%) and Rs 3,284 Cr in H1 FY27 (+43%). Net worth reached Rs 34,474 Cr in Q2 FY27 (+33%), including Rs 2,000 Cr of CCD conversion.
Two boxed navy bar-chart panels side by side with growth arrows over each FY26/FY27 pair (PAT bars; net worth as reserves plus equity stack)
Net income margin 7.9% in Q2 FY27 (8.0% in H1, vs 7.8%); expense ratio 3.1% in Q2; loan losses and provisions improved to 1.4% (from 1.7% in Q2 FY26); ROA-PBT 3.4% in Q2 and 3.5% in H1.
2x2 grid of boxed navy bar charts comparing Q1, Q2 and H1 FY26 vs FY27, with a dashed divider before the H1 pair
Shareholding as of 30 Sep 2026: Promoters 49%, FII 25%, Mutual Funds 16%, Corporate Bodies 5%, Public 5%. Promoter holding of 48.93% includes Cholamandalam Financial Holdings 43.48%. Top domestic holders include the SBI, Axis, HDFC, ICICI Prudential, Kotak and Invesco mutual funds; top foreign holders include Capital Group, Vanguard, BlackRock, Fidelity, JP Morgan and Norges Bank.
Two navy header bars: a 3D pie chart with a text box on the left, two bulleted institutional-holder lists on the right
ROE 19.4% in Q2 FY27 (vs 18.1%) and 20.3% in H1; EPS Rs 75.7 in Q2 and Rs 76.8 in H1; P/E 21.3 and P/BV 4.0 in Q2, based on a share price of Rs 1,616.00 on 30 Sep 2026.
2x2 grid of boxed navy bar charts comparing Q1, Q2 and H1 FY26 vs FY27, with a dashed divider before the H1 pair
Standalone P&L in Rs Cr. Q2 FY27: income 9,367 (+23%), net income 5,037 (+24%), expenses 1,975, net credit losses 874 (-3%), PBT 2,188 (+40%), PAT 1,630 (+41%). H1 FY27 PAT is 3,284 (+43%). AUM on this table is 2,68,009. Ratios: ROA-PAT 2.5%, Stage 3 coverage 45.3%, cost to net income 39.2% (vs 39.7%).
Full-width financial table (Rs Cr) with Q1/Q2/H1 FY26 vs FY27 columns, Q2 FY27 and H1 FY27 columns shaded light blue, PBT and ROA rows in grey bands
Balance sheet in Rs Cr for Sep-25, Mar-26 and Sep-26: loans (net of provisions) 2,40,133 at Sep-26, borrowings 2,31,522, shareholders' funds 34,474, total assets 2,69,473.
Simple three-column table with bold section headers and the Sep-26 column shaded blue
Gross assets of Rs 2,45,047 Cr at Sep-26: Stage 1 94.07%, Stage 2 2.68%, Stage 3 3.25% (7,955). Total provisions 4,913 (2.01%), Stage 3 coverage 45.32%; net assets 2,40,133, with net Stage 3 at 1.78%.
Bordered table with blue-shaded subtotal rows, Jun-26 vs Sep-26 in Rs Cr and as a percentage of gross assets
ECL by stage including sub-stages 1A/1B and 2A/2B. NPA as per RBI (including securitised assets) is Rs 10,883 Cr, or 4.44% of assets; RBI NNPA is 2.92%. A management overlay of Rs 200 Cr created in Q4 FY26 is retained. An IRAC vs IND-AS comparison shows provisions of 3,500 vs 5,110 (a difference of 1,610).
Large blue-header table in Rs Cr and % column groups with red row codes A-G, plus a small IRAC vs IND-AS table at the bottom left
Stage 3 by product at Sep-26: VF 4.07% (coverage 48.03%), LAP 2.60%, HL 1.37%, CSEL 1.55% (coverage 60.34%), SME 3.82%, SBPL 4.20%, Gold 0.04%; total 3.25% with net Stage 3 at 1.78%. The Jun-26 comparison follows.
Bordered product-level table with blue-shaded total rows for Sep-26 and Jun-26
Nine-quarter trend: gross Stage 3 moved from 2.83% (Sep-24) to a peak of 3.36% (Dec-25) and 3.25% (Sep-26), with provision coverage of 45.32%. Gross Stage 2 & 3 was 5.93% at Sep-26.
Two stacked combo charts (Stage 3 and Stage 2 & 3): hatched stacked columns for net asset % and ECL provision, green triangles for gross %, and a blue line for provision coverage on a secondary axis, Sep-24 to Sep-26
Section divider opening the business segments review.
Section divider: blue-to-purple gradient panel with a red chevron edge and white title, beside a greyscale stock photo of printed charts with a magnifying glass
Section divider for the Auto ecosystem (Vehicle Finance).
Blue gradient top banner with a red chevron underline over a greyscale photo of hands holding a toy car
Customer pyramids for commercial vehicles (from first-time users and small operators up to principal operators with more than 50 vehicles) and passenger vehicles (from agri/asset/commercial and used up to salaried buyers). Chola is positioned in the middle of the CV pyramid through new and used CVs, and at the top of the bottom of the pyramid through SCV and older CVs ('Shubh').
Two navy-headed panels, each with a blue industry triangle overlaid by an orange-red Chola-position triangle and low/high risk-return arrows
Pyramids for tractors (first-time and tenant farmers up to large farmers; agri and commercial use, new and used) and construction equipment (first-time buyers up to strategic customers; focus on backhoe loaders, excavators and cranes).
Same twin-pyramid format as the previous page
Industry volume growth for Q2 / H1 FY27: HCV 40% / 27%, LCV 25% / 22%, SCV 26% / 28%, passenger vehicles 31% / 28% (helped by affordability after GST 2.0), two-wheelers 15% / 18%. Several segments had their highest-ever H1 sales.
Text slide with six square-bulleted justified paragraphs on cream
Used vehicles expected to sustain momentum; construction equipment up 23% in Q2 and 16% in H1; tractors down 3% in Q2 but up 8% in H1. 'Cholas Position' box: calibrated portfolio expansion, disciplined credit standards and a focus on asset quality and risk-adjusted returns.
Square-bulleted text above a blue-outlined 'Cholas Position' call-out box
Domestic LCV sales (units, Q2): 121,868 (FY24) to 168,955 (FY27), with an FY30 estimate of 195,587; Chola YoY growth 20% vs industry 25%. SCV: 52,289 in Q2 FY27, Chola YoY growth 40% vs industry 26%. Source: SIAM and ICRA.
Two boxed navy bar charts with navy oval call-outs for Chola CAGR and YoY growth, bullets below
Domestic HCV sales of 94,271 units in Q2 FY27 (industry +40% YoY; Chola +88%); Car & MUV 1,357,165 units (industry +31%; Chola +38%). FY30 estimates of 115,486 and 1,571,088 units.
Same layout as the LCV/SCV page
Diversified across geography: VF disbursements split West 21%, South 30%, East 25%, North 24%; the portfolio splits West 21%, South 29%, East 28%, North 22%. Maharashtra (11%), Tamil Nadu and Uttar Pradesh are among the largest states.
Two boxed donut charts with region quadrants in the center hole and many small state slices labelled outside
VF product mix: disbursements led by used vehicles 31%, LCV 15%, MUV 13%, two-wheelers 12%; the portfolio by used vehicles 26%, LCV 19%, MUV 14%, cars 13%.
Two boxed pie charts side by side
Five-quarter VF disbursements in Rs Cr: 13,539 (Q2 FY26), 16,805, 18,132, 16,503 and 17,801 (Q2 FY27). Used vehicles 5,472, LCV 2,617, MUV 2,363 and two-wheelers 2,111 in Q2 FY27. Products are grouped into low, medium and high yield bands.
Stacked columns with a vertical low/medium/high yield bracket on the left, 100% share bars on the right
The VF portfolio grew from Rs 1,07,568 Cr (Q2 FY26) to Rs 1,29,787 Cr (Q2 FY27). Used vehicles 34,082, LCV 24,074, MUV 17,937, cars 16,108, two-wheelers 10,110 in Q2 FY27.
Same format as the disbursement mix page
VF disbursements up 31% to Rs 17,801 Cr in Q2 (H1 up 26% to Rs 34,304 Cr); AUM up 21%; loan losses improved to 1.7% from 2.1%; PBT up 42% to Rs 979 Cr (H1 up 46% to Rs 1,924 Cr).
Four rows of navy rounded label boxes on the left paired with light-blue text boxes on the right
VF disbursements: Q1 +21%, Q2 +31% (17,801), H1 +26% (34,304). VF AUM Rs 1,29,786 Cr on-book plus 0.3 assigned, for 1,29,787 total (+21%).
Two boxed navy bar-chart panels side by side with growth arrows over each FY26/FY27 pair (AUM stacked on-book and assignment)
VF income Rs 4,778 Cr in Q2 FY27 (+19%), Rs 9,374 Cr in H1; PBT Rs 979 Cr in Q2 (+42%), Rs 1,924 Cr in H1 (+46%).
Two boxed navy bar-chart panels side by side with growth arrows over each FY26/FY27 pair
VF net income margin 7.9% in Q2 FY27 (8.1% in H1); expense ratio 3.2%; loan losses 1.7% vs 2.1%; ROA-PBT 3.1% vs 2.6%.
2x2 grid of boxed navy bar charts comparing Q1, Q2 and H1 FY26 vs FY27, with a dashed divider before the H1 pair
VF P&L in Rs Cr, Q2 FY27: income 4,778, finance charges 2,246, net income 2,532 (+19%), expenses 1,017, net credit losses 536 (-3%), PBT 979 (+42%). Ratios: cost of funds 7.0%, cost to net income 40.2%.
Full-width financial table (Rs Cr) with Q1/Q2/H1 FY26 vs FY27 columns, Q2 FY27 and H1 FY27 columns shaded light blue, PBT and ROA rows in grey bands
VF gross Stage 3 at 4.07% in Sep-26 (from 3.60% in Sep-24), with provision coverage of 48.03%; gross Stage 2 & 3 at 7.48%.
Two stacked combo charts (Stage 3 and Stage 2 & 3): hatched stacked columns for net asset % and ECL provision, green triangles for gross %, and a blue line for provision coverage on a secondary axis, Sep-24 to Sep-26
Section divider for the MSME ecosystem.
Navy gradient banner with a red chevron over a two-image collage: a model house with a document signing, and a flat illustration of a shop stall
Five-tier MSME pyramid: large enterprises (banks), SME (Chola SME business, last 4 years), Medium SENP (LAP, last 20 years), Mini SENP (SBPL, last 4 years) and Micro (MFIs, outside Chola's focus). A red dashed box marks Chola's presence.
Five-tier teal pyramid on the left with navy call-out bars on the right and a red dashed boundary
MSME (LAP, SME, SBPL) disbursements up 42% to Rs 9,345 Cr in Q2 (H1 up 23% to Rs 16,496 Cr); AUM up 27%; loan losses 0.6%; PBT up 41% to Rs 742 Cr (H1 up 43% to Rs 1,434 Cr).
Four rows of navy rounded label boxes on the left paired with light-blue text boxes on the right
MSME disbursements by LAP/SME/SBPL: Q2 FY27 6,438 / 2,453 / 454 = 9,345 (+42%). AUM 57,447 / 10,943 / 3,966 = 72,356 (+27%).
Two boxed navy bar-chart panels side by side with growth arrows over each FY26/FY27 pair (stacked LAP, SME, SBPL)
MSME income Rs 2,485 Cr in Q2 FY27 (+31%); PBT Rs 742 Cr (+41%), with LAP contributing 596, SME 74 and SBPL 72.
Two boxed navy bar-chart panels side by side with growth arrows over each FY26/FY27 pair (stacked)
MSME net income margin 6.9% (vs 6.4%), expenses 2.1%, loan losses 0.6%, ROA-PBT 4.2% in Q2 FY27.
2x2 grid of boxed navy bar charts comparing Q1, Q2 and H1 FY26 vs FY27, with a dashed divider before the H1 pair
MSME P&L, Q2 FY27 in Rs Cr: income 2,485, net income 1,220 (+36%), expenses 376, net credit losses 102, PBT 742 (+41%); H1 PBT 1,434 (+43%). Cost to net income 30.8%.
Full-width financial table (Rs Cr) with Q1/Q2/H1 FY26 vs FY27 columns, Q2 FY27 and H1 FY27 columns shaded light blue, PBT and ROA rows in grey bands
Section divider for Loan Against Property.
Navy gradient banner over a greyscale photo of a man in a suit holding a model house
LAP disbursements up 39% to Rs 6,438 Cr in Q2 (H1 up 20% to Rs 11,218 Cr); AUM up 24%; loan losses steady at 0.3%; PBT up 38% to Rs 596 Cr (H1 up 39% to Rs 1,161 Cr).
Four rows of navy rounded label boxes on the left paired with light-blue text boxes on the right
Retail loans are projected to grow 19-20% and NBFC credit 17-18% in FY2027; LAP is expected to grow 19-21%. Borrower stress from US trade tariffs and the West Asia conflict is noted. The 'Cholas Position' box cites market-share gains in smaller towns, strong collections and healthy early-bucket performance. Sources are ICRA and CRISIL reports.
Justified bullets above a blue-bordered 'Cholas Position' call-out, with source URLs at the bottom
LAP disbursements Q2 +39% (6,438), H1 +20% (11,218). AUM Rs 57,447 Cr (+24%), of which 49,807 is on-book and 7,640 assigned.
Two boxed navy bar-chart panels side by side with growth arrows over each FY26/FY27 pair (AUM stacked on-book/assigned)
LAP income Rs 1,870 Cr in Q2 FY27 (+27%); PBT Rs 596 Cr (+38%); H1 PBT Rs 1,161 Cr (+39%).
Two boxed navy bar-chart panels side by side with growth arrows over each FY26/FY27 pair
LAP net income margin 6.2% (vs 5.8%), expenses 1.7%, loan losses 0.3%, ROA-PBT 4.2% in Q2 FY27.
2x2 grid of boxed navy bar charts comparing Q1, Q2 and H1 FY26 vs FY27, with a dashed divider before the H1 pair
LAP P&L, Q2 FY27 in Rs Cr: income 1,870, finance charges 999, net income 871 (+31%), expenses 238, credit losses 38, PBT 596 (+38%). Cost to net income 27.3%.
Full-width financial table (Rs Cr) with Q1/Q2/H1 FY26 vs FY27 columns, Q2 FY27 and H1 FY27 columns shaded light blue, PBT and ROA rows in grey bands
LAP gross Stage 3 at 2.60% in Sep-26 (2.25% in Sep-24), coverage 36.45%; Stage 2 & 3 at 4.60%.
Two stacked combo charts (Stage 3 and Stage 2 & 3): hatched stacked columns for net asset % and ECL provision, green triangles for gross %, and a blue line for provision coverage on a secondary axis, Sep-24 to Sep-26
Secured Business & Personal Loan P&L, Q2 FY27 in Rs Cr: disbursements 454 (+18%), AUM 3,966 (+35%), income 261 (+45%), net credit losses 48 (+197%), PBT 72 (+38%). Ratios include an ARC sale impact in Q2: income +145 bps and loan losses -259 bps.
Full-width financial table (Rs Cr) with Q1/Q2/H1 FY26 vs FY27 columns, Q2 FY27 and H1 FY27 columns shaded light blue, PBT and ROA rows in grey bands
SME P&L, Q2 FY27 in Rs Cr: disbursements 2,453 (+55%), AUM 10,943 (+45%), income 354 (+48%), PBT 74 (+77%); H1 PBT 130 (+86%). ROA-PBT 2.8%.
Full-width financial table (Rs Cr) with Q1/Q2/H1 FY26 vs FY27 columns, Q2 FY27 and H1 FY27 columns shaded light blue, PBT and ROA rows in grey bands
Section divider for the Consumer ecosystem.
Navy banner over a five-tile collage: a rupee money bag, a bank with notes and gold coins, an unsecured business loan tile, a phone with appliances and the Chola One logo
Consumer (HL, CSEL, CD, Gold) disbursements up 103% to Rs 8,726 Cr in Q2 (H1 up 79% to Rs 14,684 Cr); AUM up 32%; loan losses improved to 2.2% from 3.2%; PBT up 88% to Rs 414 Cr (H1 up 83% to Rs 809 Cr).
Four rows of navy rounded label boxes on the left paired with light-blue text boxes on the right
Consumer disbursements by CSEL/HL/Gold: Q2 FY27 4,339 / 2,426 / 1,960 = 8,726 (+103%). AUM 17,216 / 25,240 / 3,446 = 45,902 (+32%).
Two boxed navy bar-chart panels side by side with growth arrows over each FY26/FY27 pair (stacked CSEL, HL, Gold)
Consumer income Rs 1,986 Cr in Q2 FY27 (+32%); PBT Rs 414 Cr (+88%), with CSEL contributing 148 and HL 271; totals include Gold.
Two boxed navy bar-chart panels side by side with growth arrows over each FY26/FY27 pair (stacked)
Consumer net income margin 10.9% (vs 10.1%), expenses 4.9%, loan losses 2.2% (vs 3.2%), ROA-PBT 3.8% (vs 2.6%) in Q2 FY27.
2x2 grid of boxed navy bar charts comparing Q1, Q2 and H1 FY26 vs FY27, with a dashed divider before the H1 pair
Consumer P&L, Q2 FY27 in Rs Cr: income 1,986, net income 1,200 (+38%), expenses 544 (+45%), net credit losses 242 (-13%), PBT 414 (+88%). Cost to net income 45.3%.
Full-width financial table (Rs Cr) with Q1/Q2/H1 FY26 vs FY27 columns, Q2 FY27 and H1 FY27 columns shaded light blue, PBT and ROA rows in grey bands
Section divider for Home Loans.
Navy banner over a warm golden-bokeh photo of a hand holding house keys, with a red triangular panel at the left
HL disbursements up 43% to Rs 2,426 Cr in Q2 (H1 up 22% to Rs 4,223 Cr); AUM up 24%; loan losses 1.0% vs 0.5% (including an ARC impact of 44 bps); PBT up 24% to Rs 271 Cr (H1 up 35% to Rs 540 Cr). Home Loans includes Affordable LAP.
Four rows of navy rounded label boxes on the left paired with light-blue text boxes on the right
ICRA expects affordable housing finance company AUM to rise 19-21% in FY27. Asset quality is expected to inch up as portfolios season. The 'Cholas Position' box cites first-time buyers in semi-urban and rural markets, a lean hub-and-spoke network and GenAI-powered collections.
Justified bullets above a blue-bordered 'Cholas Position' call-out with two paragraphs, with an ICRA source line
HL disbursements Q2 +43% (2,426), H1 +22% (4,223). AUM Rs 25,240 Cr (+24%), of which 25,026 is on-book and 214 assigned.
Two boxed navy bar-chart panels side by side with growth arrows over each FY26/FY27 pair (AUM stacked on-book/assigned)
HL income Rs 1,004 Cr in Q2 FY27 (+27%); PBT Rs 271 Cr (+24%); H1 PBT Rs 540 Cr (+35%).
Two boxed navy bar-chart panels side by side with growth arrows over each FY26/FY27 pair
HL net income margin 9.1% (vs 8.4%), expenses 3.8%, loan losses 1.0% (ARC impact), ROA-PBT 4.4% in Q2 FY27.
2x2 grid of boxed navy bar charts comparing Q1, Q2 and H1 FY26 vs FY27, with a dashed divider before the H1 pair
HL P&L, Q2 FY27 in Rs Cr: income 1,004, finance charges 440, net income 564 (+34%), expenses 233, net credit losses 60 (+121%), PBT 271 (+24%). Cost to net income 41.3%.
Full-width financial table (Rs Cr) with Q1/Q2/H1 FY26 vs FY27 columns, Q2 FY27 and H1 FY27 columns shaded light blue, PBT and ROA rows in grey bands
HL gross Stage 3 at 1.37% in Sep-26 (down from a peak of 1.85% in Sep-25), coverage 38.67%; Stage 2 & 3 at 3.55%.
Two stacked combo charts (Stage 3 and Stage 2 & 3): hatched stacked columns for net asset % and ECL provision, green triangles for gross %, and a blue line for provision coverage on a secondary axis, Sep-24 to Sep-26
Consumer and Small Enterprise Loan P&L, Q2 FY27 in Rs Cr: disbursements 4,339 (+103%), AUM 17,216 (+23%), income 860, net credit losses 174 (-30%), PBT 148 (+380%); H1 PBT 277 (+183%). Losses and provisions fell to 3.6% from 7.0%.
Full-width financial table (Rs Cr) with Q1/Q2/H1 FY26 vs FY27 columns, Q2 FY27 and H1 FY27 columns shaded light blue, PBT and ROA rows in grey bands
Section divider for the funding profile.
Section divider: blue-to-purple gradient panel with a red chevron edge and white title, beside a greyscale stock photo of a hand placing a coin on coin stacks with a seedling
Total borrowings grew from Rs 1,87,515 Cr (Q2 FY26) to Rs 2,31,522 Cr (Q2 FY27). In Q2 FY27 bank term loans were 44%, securitisation 16%, private debentures 13%, Tier II 8% and ECB/FCNR 7%, with the remainder in IFI, CP, CC/WCDL and public debentures.
Five 100% stacked columns with total borrowings above each bar and a ten-item legend
Borrowing mix by investor type: banks about 51%, securitisation 16%, mutual funds 7%, insurance 7%, overseas banks (ECB) 7%, IFI 6%, with trusts, corporates and individuals making up the rest.
Five 100% stacked columns with the same totals as the previous page
Asset-liability maturity table in Rs Cr across buckets from 1 month to more than 5 years. Total inflows and outflows of 2,75,539.29. The cumulative gap is positive in every bucket (25.59% at 1 month, 7.85% at 6m-1yr, 1.23% at 1-3 yr).
Dense navy-header table with grey cumulative rows
CAR rose from 18.57% (FY24) to 20.62% in Q2 FY27 (Tier I 16.02%, Tier II 4.60%), against an RBI minimum of 15%. Ratings: A1+ short-term from CARE, ICRA and CRISIL; AA+ long-term from India Ratings, CARE and ICRA (ICRA outlook Positive). Cash balance of Rs 21,352 Cr and a total liquidity position of Rs 21,974 Cr.
Stacked Tier I/Tier II column chart above a bordered credit rating table and a liquidity paragraph
Section divider for the consolidated financials.
Section divider: blue-to-purple gradient panel with a red chevron edge and white title, beside a greyscale stock photo of a finger touching a world map network
Consolidated, including Chola Securities, Chola Home Finance, Paytail and Payswiff, in Rs Cr: Q2 FY27 income 9,395 (+23%), PBT 2,187 (+40%), PAT 1,628 (+41%); H1 FY27 PAT 3,284 (+43%).
Compact table with Q2 FY27 and H1 FY27 columns shaded blue
Section divider for risk management.
Section divider: blue-to-purple gradient panel with a red chevron edge and white title, beside a greyscale stock photo of hands arranging wooden blocks and puzzle pieces
ERM framework as a temple: a Risk Vision roof, six pillars (capital and liquidity, credit, fraud, cyber and information security, regulatory and compliance, emerging risks), and a foundation of risk organization and risk governance and reporting.
Navy temple/pillar diagram with numbered circles
Key practices for the risk vision (a Risk Appetite Statement), capital and liquidity (diversified funding, HQLA governance), credit risk (model-based underwriting, stress testing, bounce-prediction collections) and fraud risk (preventive controls, training).
Two-column category / key highlights table with a blue header, alternating rows and numbered navy circles
Cyber risk (red teaming, honeypot threat intelligence, SOC, PAM, ISO/IEC 27001:2022), regulatory compliance (an in-house team of 20+ with 200+ years of combined experience), an ISO 9001 certified risk organization, and governance tracking 300+ risk metrics.
Same table format as the previous page
ALM internal thresholds stricter than RBI's (0% vs -10%/-20%) with no cumulative negative mismatch. Average daily LCR was 171% in Q2 FY27, 1.71x the RBI mandate of 100%; the lowest LCR recorded was 114%.
Left: threshold table and bullets; right: stacked columns showing the distribution of daily LCR observations with a 171% circle call-out
Total RWA of Rs 2,15,636 Cr at 30 Sep 2026. The regulatory Tier I requirement is 21,564, while Chola holds 34,551 (16.02% of RWA), including CET1 of 32,082 (14.9%).
Three boxed bars comparing RWA, the regulatory requirement and Tier I capital held
Business decision matrix (geography, product, customer segment); underwriting with 1,100+ input variables feeding a traffic-light outcome of straight-through, refer or reject; portfolio monitoring with bounce-prediction, roll-forward/roll-back and repossession models across DPD buckets.
Three chevron headers with icons over content panels: a hexagon diagram, a traffic-light flow and a model grid
A compliance-first tone from the Board, zero tolerance for non-compliance, a code of conduct covering DSAs and collection agents, and a Fair Practice Code; compliance and centralized legal teams of 20+ professionals.
Two panels: icon rows on the left, team responsibilities on the right
'Compliance is the only Way' cycle: annual Board policy review, Audit Committee, Internal Disciplinary Committee, monthly KYC and Fair Practice Code audits, a whistle-blower policy and automated insider-trading controls.
Circular cycle diagram with a central buoy icon and six surrounding boxes
People (security team, phishing simulations, cyber drills), process (code review, BCP/DR, VAPT, red teaming) and tools (SASE, DevSecOps, cloud and API security, PIM/PAM, 24x7 SOC/SIEM, DLP, brand monitoring).
Three blue columns with circular icons and red connector lines
Governance chain from the Board through the Risk Management Committee, MD & CEO and CRO to risk champions; RCSA; a table of nine Board committees and the risks each reviews; and a Wilful Defaulter Review Committee under the RBI 2024 directions.
Vertical org-chart flow on the left, committee table on the right
Section divider for information technology.
Section divider: blue-to-purple gradient panel with a red chevron edge and white title, beside a greyscale stock photo of a blue tech network with cloud and mobile icons
Technology stack: systems of engagement (LOS, CRM, Gaadi Bazaar, Chola One, partner integration), systems of record (LMS, customer database, collections, accounting, treasury), systems of intelligence (data repository, MIS, visualization) and other core areas.
Four labelled bands of navy 3D buttons
Digitized loan journey: sourcing (OEM integration, eKYC, video KYC, facial recognition, pre-approved offers), underwriting (bureau checks, bank statement analyzer, penny drop, account aggregator) and disbursement (e-sign, e-stamping, e-mandates).
Three light-blue chevron columns with 'Loan journey' and 'Digitization features' row labels
A collection management system linking field staff, tele-callers and managers to LMS, LOS/CRM and DMS, with 17 features including an EWS analytics engine, auto-allocation, e-receipts, BBPS and wallets, and a cloud dialer.
Flow diagram on the left, navy panel of 17 color-coded numbered features on the right
Chola One is fed by SEO, propensity customers, aggregators, partners, pre-approved offers and digital marketing; it offers lending, insurance and wealth management, and value-added services; phase 1 is CSEL, phase 2 adds VF, HL, SME, LAP and SBPL.
Curved navy pills feeding a Chola One logo circle, central bands of offerings, phase roadmap on the right
Gaadi Bazaar platform: used-vehicle marketplace, new-vehicle discovery and a repo-vehicle auction. KPIs: SEO score 92, 1.2M+ monthly unique users, #1 Google rank for 'used truck', 7.8K+ new listings and 4.1K+ vehicles sold per month, 3.1K+ dealers, 99% of service requests automated.
Phone app mock-up on the left, three navy feature blocks in the middle, KPI tile grid on the right
Analytics across credit assessment (UW scorecards, risk-based pricing), account monitoring (EWS and roll-forward models, bureau enrichment) and cross-sell (pre-approved offers, propensity models, CIBIL alerts).
Central three-segment circular graphic with call-out boxes
AI use cases: vernacular voice agents for sales and drop-offs, facial liveness and signature checks, an AI-powered LOS, alternate-data credit models, GenAI legal summarization and credit memos, OCR document verification, GenAI collection voice agents and slippage-prediction models.
Five color-coded row blocks (Sales, KYC, Onboarding & credit, Operations, Collections) each with two to five cards
Section divider for ESG.
Divider with a green paper-cut cityscape illustration of families, trees and wind turbines
Screenshot of Chola's ESG website, 'We Believe In Making A Positive Impact In The Society', with environmental (carbon footprint), social (financial inclusion) and governance (ethical conduct) pillars; it refers readers to cholamandalam.com/esg.
Website screenshot with a banner illustration and three colored panels
ESG scores: CSRhub 45 to 71 (FY24 to FY26), S&P 19 to 34 (FY23 to FY25), Sustainalytics risk 24.7 to 21.6, SES 78.6, NSE Sustainability 72, Crisil 69 (FY26). A constituent of the FTSE4Good Index series since FY2021.
2x3 grid of small 3D column charts with dotted trend lines
CSR spend by theme in Rs Cr, FY22 to FY26, across health, education, rural development, environment, disaster relief, sports and others. Health is the largest at 43 in FY26.
Horizontal stacked bars by fiscal year with a seven-color legend
Algengar spurningar um þessa glæru og undirliggjandi kynningarefni.
It is the 103-slide corporate presentation that Cholamandalam Investment and Finance Company (Chola), the Murugappa group's NBFC, filed with BSE/NSE on 28 October 2026 alongside its board meeting outcome. It covers results for the quarter and half-year ended 30 September 2026.
Indian companies use an April-March fiscal year, so FY27 runs from April 2026 to March 2027. Q2 FY27 is July to September 2026, and H1 FY27 is April to September 2026.
Q2 FY27 disbursements rose 47% to Rs 35,872 Cr, business AUM reached Rs 2,48,045 Cr (+25%), PBT rose 40% to Rs 2,188 Cr and PAT was Rs 1,630 Cr (+41%). ROE was 19.4% for the quarter, CAR was 20.62%, and RBI GNPA / NNPA were 4.44% / 2.92%.
Amounts are in Indian rupees, mostly Rs crore (Cr), written in the Indian digit grouping used on the slides (for example 2,48,045 Cr). One crore equals 10 million.
Vehicle Finance (Auto ecosystem); Loan Against Property, SME and Secured Business & Personal Loans (MSME ecosystem); and Home Loans, Consumer & Small Enterprise Loans and Gold loans (Consumer ecosystem). Each segment has its own performance summary, P&L, ratios and asset-quality trend.
Yes. The original PDF and a PPTX version converted from it are both available. The PPTX is machine-converted, so some charts and tables may need tidying before you reuse them as a template.
It was filed with BSE (and NSE) as part of Cholamandalam's October 2026 board meeting outcome disclosure. The BSE cover letter has been removed from this version.
Original filing including the cover letter 'Outcome of the Board - Oct 2026'

Create Your Own Slides
Turn your ideas into professional presentations in seconds with 2slides AI.
Sæktu innblástur í faglega hönnun, veldu þinn stíl og búðu til glærur með fullkominni textabirtingu. Knúið af Nano Banana—byrjaðu að búa til kynninguna þína núna.
Þinn AI-þjónn fyrir glærur. Sparaðu tíma, skín hraðar með snjallri kynningargerð.


© 2026 2slides. Allur réttur áskilinn.