
Hluti af safninu Dæmi um fjárfestakynningar · Dæmi um japanskar fjárfestakynningar · Dæmi um fjárfestakynningar hálfleiðarafyrirtækja
Advantest Q2 FY2026 Earnings Presentation (Financial Briefing, three months ended September 30, 2026) - a bilingual English/Japanese results deck from the world's leading semiconductor test equipment maker, published on TDnet on October 28, 2026
Notar forsíðu þessarar kynningar sem stílfyrirmynd fyrir glærur úr þínu eigin efni. Eða veldu hvaða síðu sem er hér fyrir neðan og notaðu uppsetningu hennar sem fyrirmynd.
Flýtileiðsögn
Merki
Deila glærunum
Advantest Q2 FY2026 Earnings Presentation (Financial Briefing, three months ended September 30, 2026) - a bilingual English/Japanese results deck from the world's leading semiconductor test equipment maker, published on TDnet on October 28, 2026
Ítarleg sýn á hverja glærusíðu, þar á meðal útlit, lykilefni og sjónræna þætti.
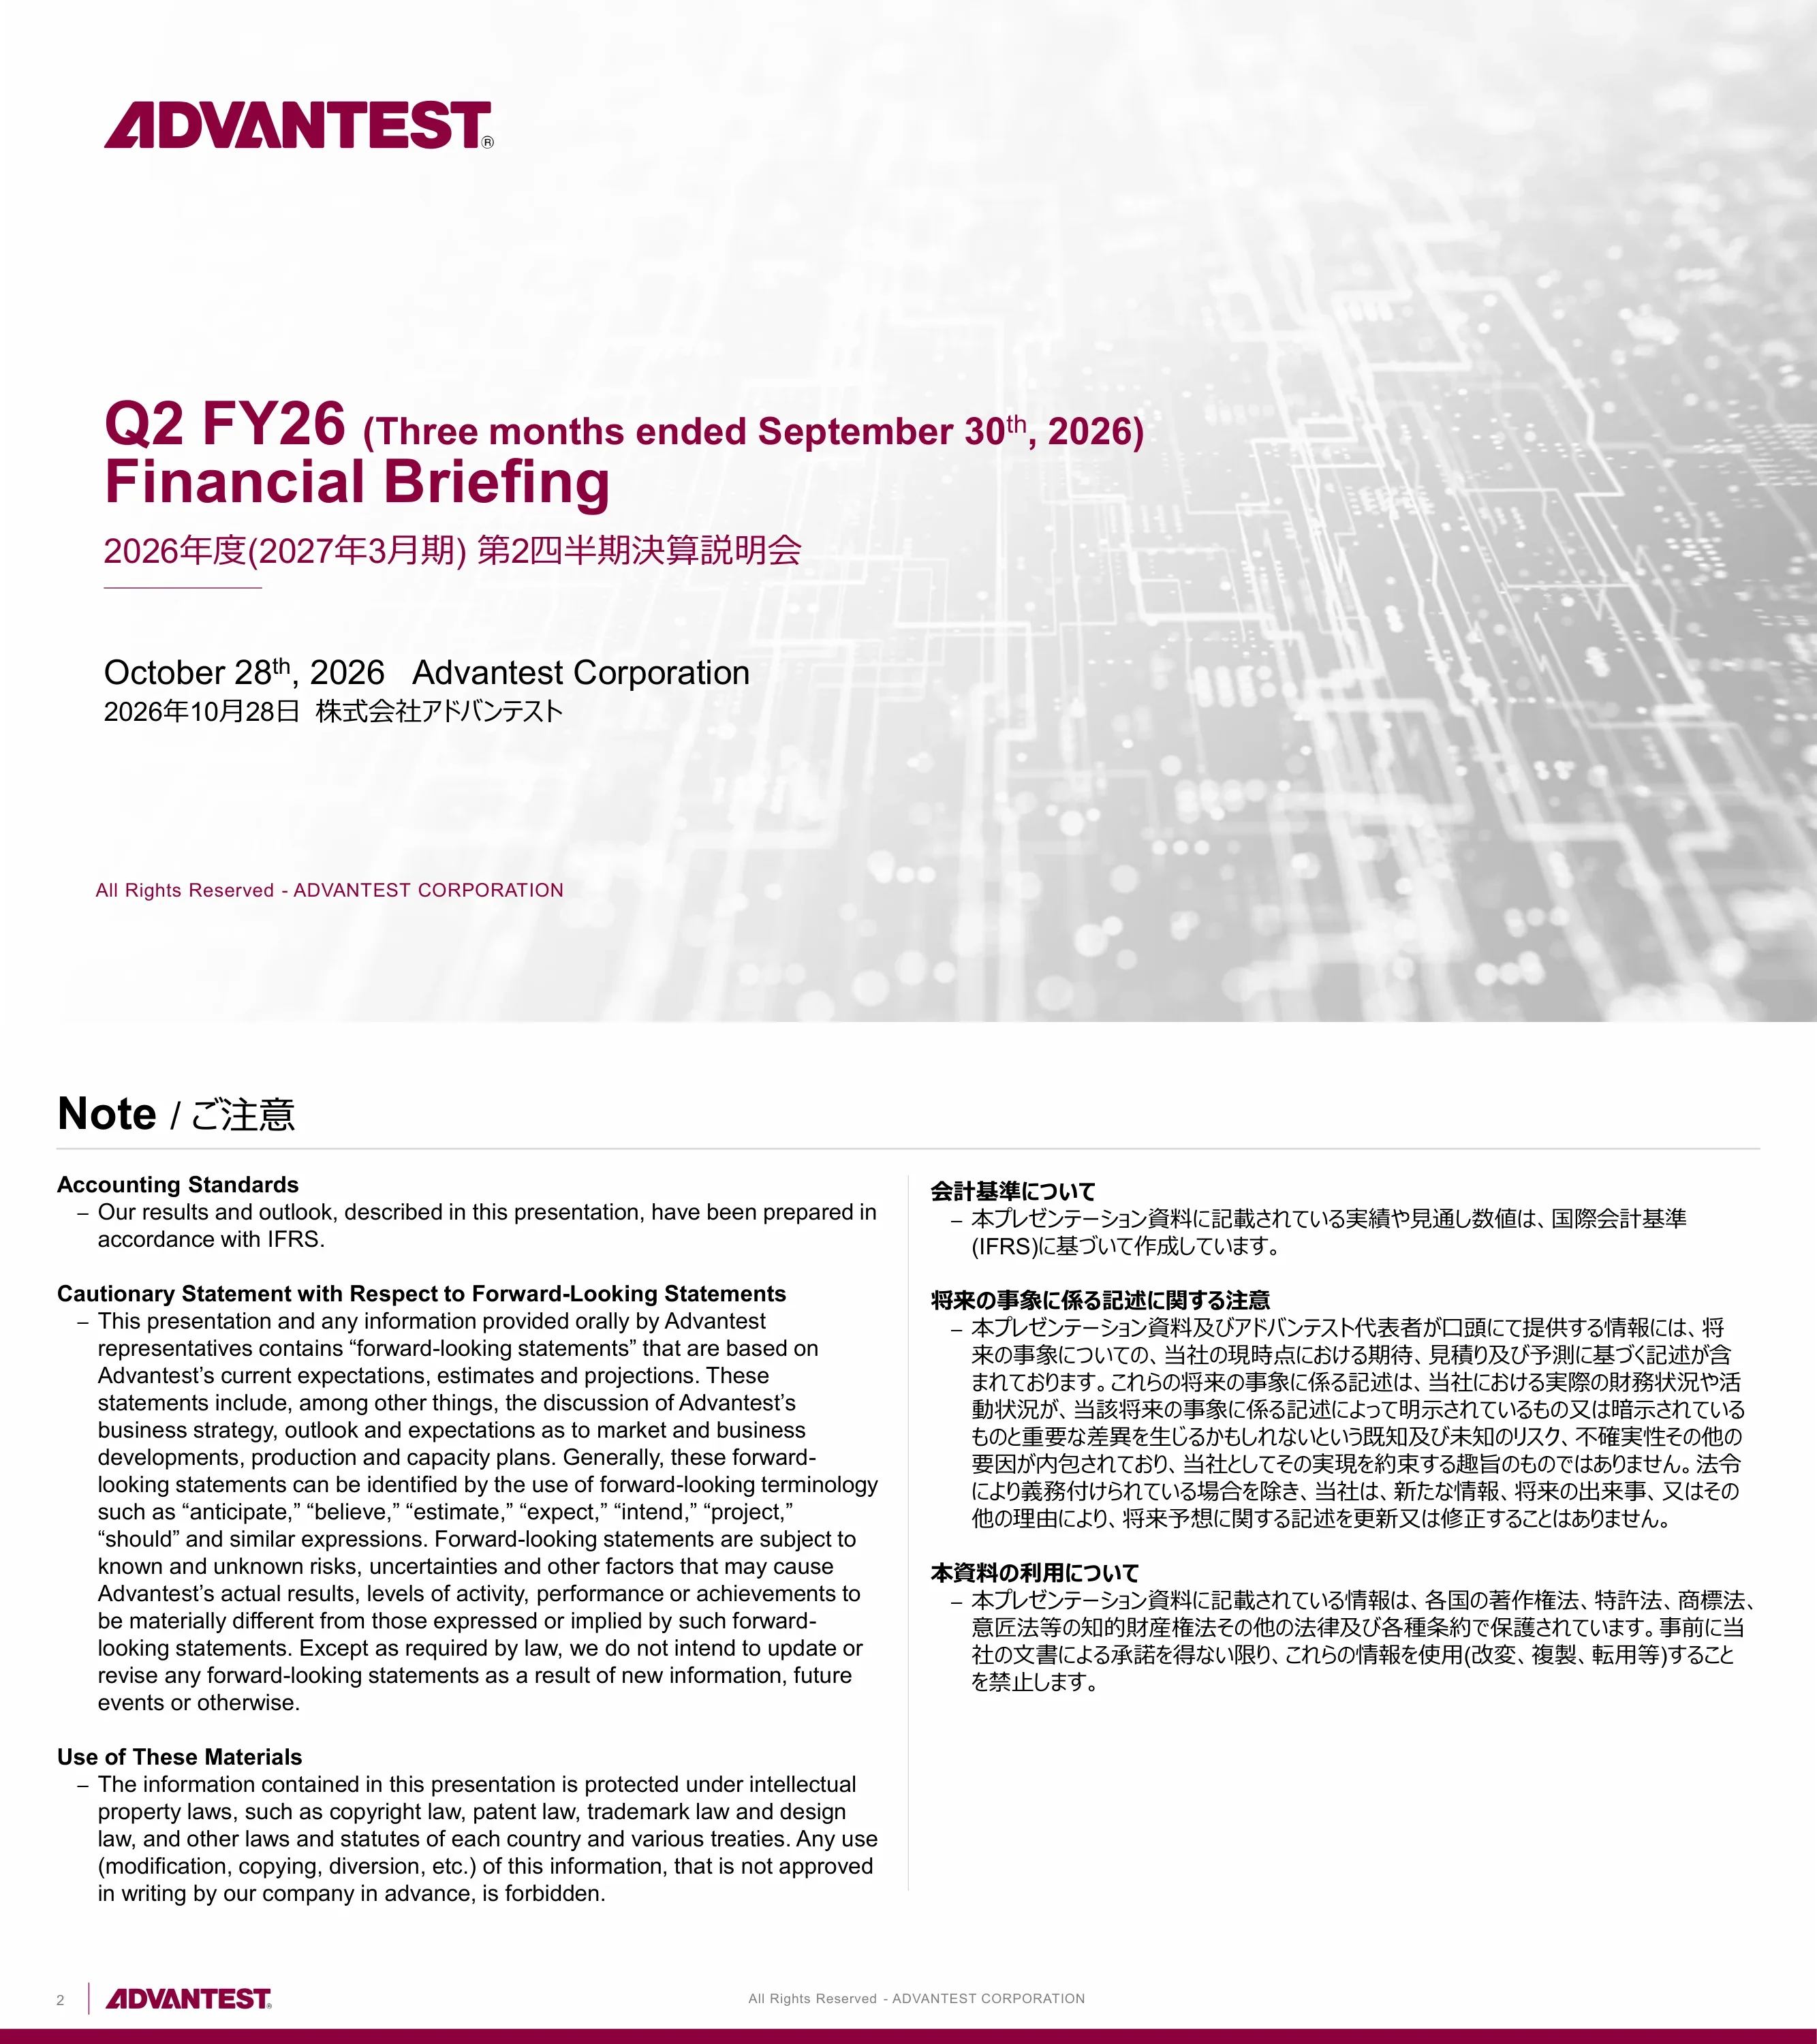
Title slide: 'Q2 FY26 (Three months ended September 30th, 2026) Financial Briefing' with the Japanese title 2026年度(2027年3月期) 第2四半期決算説明会, dated October 28th, 2026, Advantest Corporation.
Left-aligned title block over a pale grey circuit-board photo background, burgundy ADVANTEST wordmark top left, thin burgundy rule under the Japanese subtitle.
Disclaimers: results and outlook are prepared under IFRS; cautionary statement on forward-looking statements (anticipate, believe, estimate, expect, etc.) that may differ materially from actual results; and a notice that the material is protected by intellectual property law and may not be used without written approval.
Two-column text slide - English on the left, Japanese translation on the right, separated by a vertical hairline; bold run-in headings.
Five headline points: Q2 sales and profits reached new quarterly records with capacity being expanded for AI-related tester demand; the CY26 tester market outlook is unchanged from July with strength expected into CY27; the FY26 forecast is revised upward, with 2H operating margin expected above 50% (about 3 points above the July forecast) and full-year operating margin raised to 51.9% despite higher component costs; production capacity expansion is being further accelerated; and an increased interim dividend plus a new share repurchase program were approved.
Two-column bullet list, English left and Japanese right, each bullet led by a burgundy bold label.
Section header 'Financial Results for Q2 FY26' / 2026年度第2四半期決算報告.
Full-bleed faded circuit-board photo with large burgundy section title on the left and logo top left.
Quarterly P&L table in JPY billions: Q2 FY26 sales 477.7 vs. forecast 434.5 (+110.3 / +30.0% QoQ, +214.8 / +81.7% YoY); gross profit 339.8 at a 71.1% gross margin; operating income 266.8 vs. forecast 224.5 at a 55.9% margin (+40.4% QoQ, +146.0% YoY); income before tax 276.2; net income 193.3 (40.5% margin). Exchange rates 161 yen/US$ and 185 yen/euro; dividend per share JPY 49 (vs. 29 in Q2 FY25 and 30 in Q4 FY25). Includes FY25 Q1-Q4 and FY26 Q1 comparison columns.
Wide data table with grey header bands for FY25 and FY26 quarters; the Q2 Results column is outlined with a bold burgundy box; QoQ and YoY change columns on the right; separate exchange-rate and dividend sub-tables.
Nine-quarter stacked bars from FY24 Q2 (190.5) to FY26 Q2 (477.7) split into Test Systems (436.7 in Q2) and Services & Others (41.1). Inset breakdowns: Q2 Test Systems = SoC 353.3, Memory 53.4, Other Systems 29.9; Services & Others = Support Services 25.6 and Others 15.5. Note that intersegment transactions are eliminated from totals.
Large stacked column chart on the left with dashed callout lines leading to two framed inset charts on the right (teal-bordered boxes).
Stacked columns by ship-to region over nine quarters. In FY26 Q2 (477.7 total) Taiwan was largest at 261.3, followed by China 90.1, S. Korea 64.6, Others 38.1, Americas 15.7, Europe 6.1 and Japan 1.8 (JPY billions). FY26 Q1 comparison: Taiwan 178.6, China 69.4, S. Korea 67.4.
Single wide stacked column chart with a seven-colour legend on the right; segment values labelled inside bars and small region values beside them.
Combo chart of quarterly sales and operating income with gross and operating margin lines from FY24 Q2 to FY26 Q2: sales rise from 190.5 to 477.7, operating income from 63.6 to 266.8, gross margin from 57.8% to 71.1% and operating margin from 33.4% to 55.9%. Note: Q4 FY24 operating income includes an impairment loss of about JPY 21.4B on goodwill and intangibles; Q1 FY25 includes a gain of about JPY 2.5B from a partial business divestiture.
Clustered columns (light-blue sales, royal-blue operating income) with two overlaid line series (green squares for gross margin, blue dots for operating margin); footnote across the bottom.
Left: R&D expenses, capex and D&A per quarter - Q2 FY26 R&D 23.4, capex 12.1, D&A 7.4, with R&D at 4.9% of net sales (down from 9.0% in FY24 Q2). Right: operating cash flow 169.8, investing cash flow -108.3 and free cash flow 61.5 in Q2 FY26 (FY26 Q1: 137.2, -102.5, 34.7). Free cash flow is defined as operating plus investing cash flows.
Two-panel slide split by a vertical rule: grouped green columns with an R&D-ratio row underneath on the left; green operating CF bars above the axis, grey investing CF bars below and a dark-teal free cash flow line on the right.
Balance sheet snapshots at 09/30/2025, 03/31/2026, 06/30/2026 and 09/30/2026: total assets grew from 971.5 to 1,732.1 (JPY billions). At 09/30/2026 assets include cash 401.8, receivables 239.5, inventories 352.4, investment securities 432.6 and PP&E 129.7; liabilities include trade payables 188.5, other current liabilities 260.0 and bonds 89.5; equity attributable to owners of the parent is 1,145.1, an equity ratio of 66.1% (vs. 68.8% at 06/30/2026).
Two side-by-side stacked column charts (assets left, liabilities and equity right) with connector lines between bars and labelled categories at the right of each chart; equity-ratio row below.
Section header 'FY26 Outlook' / 2026年度の見通し.
Same circuit-board photo divider template as page 4, burgundy title left-aligned.
TAM chart in USD billions (approx.): CY24 6.0 (SoC 4.1, memory 1.9), CY25 9.0 (SoC 6.9, memory 2.1) and CY26e 13.0-14.5 (SoC 10.5-11.5, memory 2.5-3.0), unchanged from the July 2026 estimate. Commentary: SoC testers near the upper end and memory testers around the midpoint of the range; semiconductor complexity keeps driving test volume; barring geopolitical and macro factors, the industry is expected to stay supply constrained with demand exceeding supply in CY27.
Stacked column chart on the left with July estimates in parentheses beside the CY26e bar; teal-headed bilingual bullet commentary on the right separated by a rule.
FY26 capacity plan: SoC testers have achieved annual production capacity of more than 5,000 systems and aim to reach the 10,000-system target well ahead of the original schedule; memory testers are accelerating the production ramp in line with SoC. Conclusion: Advantest remains positioned to capture strong demand through a resilient, scalable supply chain.
Headline sentence on top, a rounded peach panel with two burgundy-labelled bullets, a large burgundy down arrow, and a centred concluding statement.
Revised FY26 forecast in JPY billions: sales 1,863.0 (+65.1% vs. FY25 1,128.6; July forecast 1,714.0, +149.0), operating income 967.0 at 51.9% margin (July 846.0 / 49.4%), income before tax 1,021.5, net income 741.5 and basic EPS JPY 1,027.08 (July 911.64). 1H results 845.2 sales / 456.8 operating income; 2H forecast 1,017.8 / 510.2 (50.1% margin). R&D 114.0, capex 60.0, D&A 31.5. Assumed rates 155 yen/US$ and 177 yen/euro; sensitivity is plus JPY 5.8B operating income per 1 yen depreciation vs. USD and minus JPY 0.4B vs. the euro.
Dense forecast table with FY25 results, FY26 Q1/Q2/1H/2H/FY columns, a burgundy box around the FY column, change-vs-FY25 columns and a separate July-forecast comparison block on the right; two footnotes below.
Test Systems sales trend: FY24 682.8, FY25 1,019.4 and FY26e 1,714.5 (July: 1,575.0); SoC portion 440.4, 767.4 and 1,375.0 (July 1,243.5). Growth is expected to be driven mainly by AI-related applications including ASICs and CPUs, with capacity expansion accelerating. Application mix: Computing/Communications 90% / 95% / 90% and Automotive/Industrial/Consumer/DDIC 10% / 5% / 10% for FY24 / FY25 / FY26e (rounded to the nearest 5%).
Stacked column chart with SoC highlighted in yellow and other segments greyed out; July forecast figures in parentheses; bilingual bullets and an orange-headed application-mix table on the right.
Same Test Systems chart with memory highlighted: 157.7 (FY24), 171.5 (FY25) and 229.0 forecast for FY26 (July: 227.0). DRAM back-end tester sales and non-volatile memory tester sales are both expected to grow, with continued capacity expansion. Application mix DRAM 95% / 90% / 85% and non-volatile memory 5% / 10% / 15% for FY24 / FY25 / FY26e.
Mirror of page 15 with the memory layer in green and a green-headed application table.
Services & Others sales: FY24 96.9, FY25 109.2 and FY26e 148.5 (July: 139.0). Support Services 55.7 / 65.0 / 86.0 (July 80.0), growing with the installed base; Others 41.2 / 44.2 / 62.5 (July 59.0), led by test interface boards.
Navy and blue stacked columns on the left; two teal-headed bilingual bullet sections (Support Services, Others) on the right.
Under the MTP3 policy Advantest targets a cumulative total return ratio of at least 50% over three years through dividends and buybacks. Resolutions adopted on the day: an FY26 interim dividend of JPY 49 (FY25 interim and year-end dividends were JPY 29 and 30), and a share repurchase of up to 11 million shares (1.5% of outstanding shares excluding treasury stock) for up to JPY 280B between October 29, 2026 and March 24, 2027.
Two mirrored columns (English left, Japanese right) with burgundy headline, diamond bullet for the resolutions and check-mark sub-items for dividend and repurchase.
Three items: Advantest was selected for the first time as a constituent of the JPX-Nikkei Index Human Capital 100; the Integrated Annual Report 2026 has been published (English and Japanese links, cover thumbnail 'Testing the Future'); and a Virtual IR Fireside Chat on November 12, 2026 themed 'Strategic Supply Chain Transformation Enables Future Growth and Delivers a Competitive Advantage'.
Checkbox-style list of three burgundy headlines with Japanese subtitles and notes; report cover thumbnail on the right.
End slide with the centred ADVANTEST wordmark and 'All Rights Reserved - ADVANTEST CORPORATION'.
Plain white slide with a centred burgundy logo.
Algengar spurningar um þessa glæru og undirliggjandi kynningarefni.
It is Advantest's 20-page Financial Briefing for the three months ended September 30, 2026: quarterly results, sales by segment and region, margins, cash flow and balance sheet, the CY26 tester market outlook, capacity expansion plans, the revised FY26 forecast by segment, and shareholder returns.
It is bilingual English/Japanese - every slide pairs English text with a Japanese translation (the Japanese title is 第2四半期決算説明会資料 / 決算説明会). The original was disclosed on TDnet, the Tokyo Stock Exchange's Timely Disclosure network, on October 28, 2026. Advantest trades on the TSE under code 6857.
Advantest's fiscal year runs April to March, so FY2026 covers April 2026 to March 2027 (the fiscal year ending March 2027, 2027年3月期). Q2 FY26 is July-September 2026. The tester market slides use calendar years (CY24, CY25, CY26e) instead.
Sales were JPY 477.7 billion (+81.7% YoY) and operating income JPY 266.8 billion with a 55.9% operating margin, both above the company's own forecast of JPY 434.5B and 224.5B. Net income was JPY 193.3 billion. All amounts in the deck are in JPY billions (10億円) and prepared under IFRS.
The full-year forecast was raised to JPY 1,863.0 billion in sales (from 1,714.0 in July) and JPY 967.0 billion in operating income (from 846.0), lifting the operating margin forecast to 51.9%. Net income is forecast at JPY 741.5 billion and basic EPS at JPY 1,027.08.
Advantest kept its CY26 tester TAM estimate at roughly USD 13.0-14.5 billion (SoC 10.5-11.5, memory 2.5-3.0), up from USD 9.0 billion in CY25, and expects the industry to stay supply constrained into CY27 as AI-related chips need more test volume.
Yes - the page offers the original PDF plus an editable PPTX converted from it, useful as a reference for bilingual earnings deck design. The content itself remains Advantest's copyrighted material; check the disclaimer on page 2 before reusing any data or wording publicly.

Create Your Own Slides
Turn your ideas into professional presentations in seconds with 2slides AI.
Sæktu innblástur í faglega hönnun, veldu þinn stíl og búðu til glærur með fullkominni textabirtingu. Knúið af Nano Banana—byrjaðu að búa til kynninguna þína núna.
Þinn AI-þjónn fyrir glærur. Sparaðu tíma, skín hraðar með snjallri kynningargerð.


© 2026 2slides. Allur réttur áskilinn.