
इस संग्रह का हिस्सा: निवेशक प्रेज़ेंटेशन के उदाहरण · ऑस्ट्रेलियाई इन्वेस्टर प्रेजेंटेशन उदाहरण
West African Resources Investor Presentation October 2026 — the 24-slide deck lodged with the ASX by West African Resources Limited (ASX: WAF), a Burkina Faso gold producer, titled "West Africa's Growing Mid Tier Producer: Targeting +500,000 oz pa Gold Production from 2027". It covers 2026 production guidance of 430–490 koz, A$437 million H1 2026 NPAT, the 13.7 Moz Mineral Resource and 7 Moz Ore Reserve, a 10-year production target averaging 533,000 oz a year, the Kiaka and Sanbrado production centres, near-mine drilling results, ESG programs and the capital structure. Dollar figures are in Australian dollars (A$) or US dollars (US$) exactly as the deck states them; WAF reports on calendar years.
आपके अपने कंटेंट से बनी स्लाइड्स के लिए इस प्रेज़ेंटेशन के कवर को स्टाइल रेफ़रेंस के रूप में इस्तेमाल करता है। या नीचे से कोई भी पेज चुनें और उसके लेआउट को रेफ़रेंस की तरह इस्तेमाल करें।
त्वरित नेविगेशन
टैग
स्लाइड साझा करें
West African Resources Investor Presentation October 2026 — the 24-slide deck lodged with the ASX by West African Resources Limited (ASX: WAF), a Burkina Faso gold producer, titled "West Africa's Growing Mid Tier Producer: Targeting +500,000 oz pa Gold Production from 2027". It covers 2026 production guidance of 430–490 koz, A$437 million H1 2026 NPAT, the 13.7 Moz Mineral Resource and 7 Moz Ore Reserve, a 10-year production target averaging 533,000 oz a year, the Kiaka and Sanbrado production centres, near-mine drilling results, ESG programs and the capital structure. Dollar figures are in Australian dollars (A$) or US dollars (US$) exactly as the deck states them; WAF reports on calendar years.
प्रत्येक स्लाइड पृष्ठ का विस्तृत दृश्य, लेआउट, मुख्य सामग्री और दृश्य तत्वों सहित।
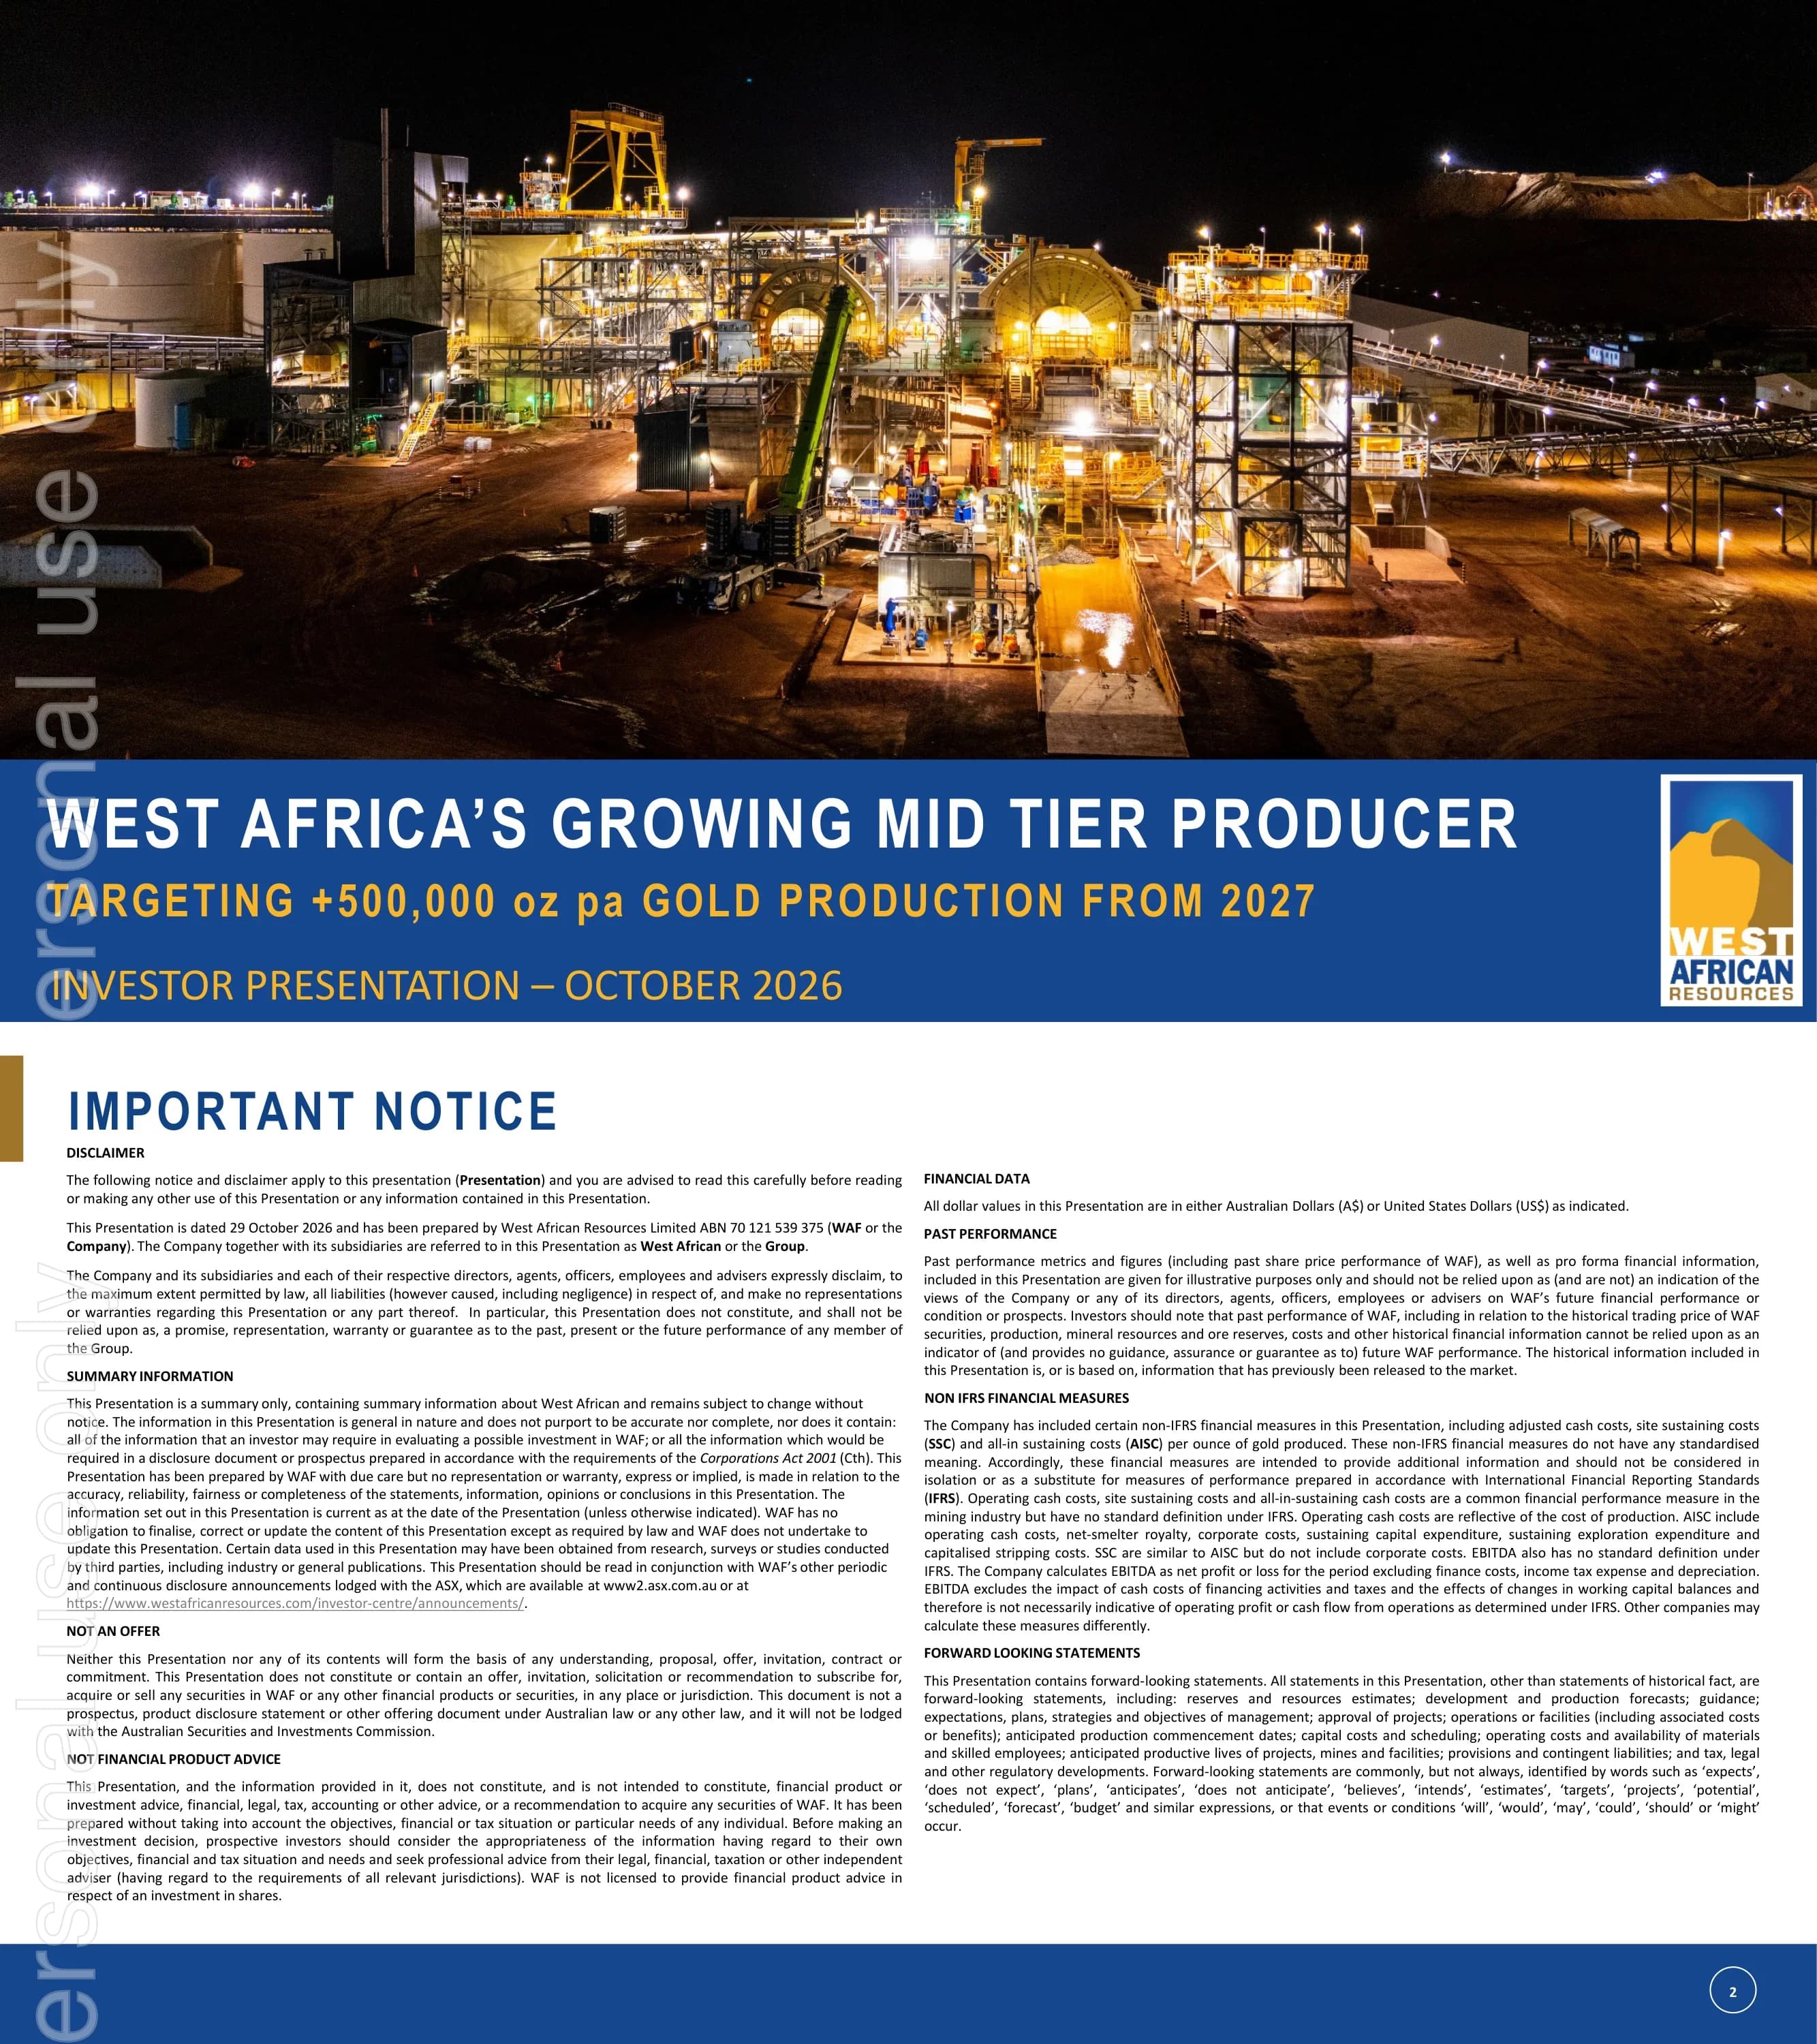
Cover slide announcing West African Resources as West Africa's growing mid-tier gold producer, targeting more than 500,000 oz a year of gold production from 2027, dated Investor Presentation – October 2026.
Full-bleed night photograph of a lit gold processing plant across the top two-thirds, with a navy band at the bottom carrying the white headline, a gold-coloured tagline and the presentation date, and the WAF logo boxed at bottom right.
Legal disclaimer dated 29 October 2026 for West African Resources Limited (ABN 70 121 539 375): summary information, not an offer, not financial advice, financial data in A$ or US$ as indicated, past performance, non-IFRS measures (cash costs, site sustaining costs, AISC and EBITDA defined) and forward-looking statements; directs readers to WAF's announcements lodged with the ASX.
Two dense text columns under a large navy heading with bold sub-headings for each disclaimer section; navy footer bar with page number.
Continuation of the disclaimer: forward-looking statement risk factors, the source of Mineral Resources, Ore Reserves and production targets (the 31 March 2026 announcement 'WAF 10-year gold production to average 533,000 oz per annum'), exploration results references, and a JORC Code note explaining the estimates may not comply with NI 43-101 or SEC Regulation S-K 1300.
Left text column with bold sub-headings and a shorter right column for the JORC Code paragraph, leaving white space at right.
Headline metrics table: 2026 guidance 430–490 koz, Mineral Resources 13.7 Moz, Ore Reserves 7 Moz, 10-year production target 5.3 Moz (82% from Ore Reserves), market capitalisation A$3,638m (1,144,102,726 shares at A$3.18 as at 23 October 2026), A$1,412m in cash and bullion at 30 September 2026, all 100% unhedged; includes the inferred-resource cautionary statement.
Aerial photograph of an open-pit mine and tailings dam as the background, with a translucent white metrics table across the lower third and the WAF logo top right.
Sixteen leadership profiles: Founder, CEO and Executive Chairman Richard Hyde; Executive Director and COO Lyndon Hopkins; Lead Independent Director Rod Leonard; Executive Director of HR Libby Mounsey; non-executive directors Stewart Findlay, Robin Romero and Jayde Webb; CFO and Company Secretary Padraig O'Donoghue; plus legal counsel, vice presidents for group operations and supply chain, the country manager and general managers for sustainability, finance, risk and technical services.
Three rows of circular black-and-white headshots (7, 5 and 4 people) with names in blue and titles in grey beneath each photo.
Map of Burkina Faso showing WAF's mines at Sanbrado and Kiaka and the Toega project south-east of Ouagadougou, alongside other current and former gold mines, greenstone belts, towns, rail and major roads, with an inset locating Burkina Faso in Africa.
Large shaded-relief country map filling most of the slide, an Africa inset at top left, and a legend with logo on the right.
Six highlights: A$437 million H1 NPAT; A$0.20 special dividend per share paid 7 October 2026; group production guidance 430,000–490,000 oz; group AISC guidance under US$1,900/oz; year-to-date production of 360,857 oz at AISC US$1,725/oz; and more than 100,000 m of drilling underway at Sanbrado and Kiaka targeting depth extensions and near-surface anomalies.
Bullet list on the left half, a photograph of a worker in a heat-protective suit pouring at a smelting furnace on the right, and source references in the footer.
Stacked bar chart of recovered gold ounces 2026–2035 split between Kiaka and Sanbrado (about 455 koz in 2026 rising to roughly 596 koz in 2030); bullets state resources increased to 13.7 Moz and reserves to 7 Moz, an average of 533,000 oz a year over 2026–2035, a 2030 peak of 596,000 oz, a target based on 82% Ore Reserves, 3% Indicated and 15% Inferred at a US$2,000/oz gold price, and a 2026 drilling program including 21,000 m underground at M5, 11,000 m at M5 North, 13,500 m at Toega, 7,500 m at Kiaka and 7,000 m at MV3.
Stacked column chart on the left with inferred-resource caveat below, bullet list with dash sub-points on the right.
Section divider photograph of the Kiaka processing plant with conveyors, crushing circuit and stockpiles in daylight.
Title and gold subtitle at top, with a full-width photograph filling the rest of the slide above the navy footer.
Fact sheet: south-central Burkina Faso; WAF 85% / government 15% (with a decree to acquire a further 25%); open pit with a 1.4:1 life-of-mine strip ratio; resources 391 Mt at 0.7 g/t for 9.2 Moz (US$3,000 shell); reserves 177 Mt at 0.8 g/t for 4.7 Moz (US$2,000); 16-year mine life; 10 Mtpa CIL plus gravity rising to 12 Mtpa in 2028; 92% recovery; first production June 2025; 2026 YTD production 209,305 oz; 10-year average 277,000 oz a year; 95% Burkinabe workforce; 27.5% tax; 15% government equity, 10% royalty (at US$4,000/oz) and 1% development fund.
Two-column label/value list on the left, a 3D site plan on the right showing the Kiaka main, central and south pits, plant, tailings facility, waste dumps and camp.
Northwest–southeast drill cross-section through Kiaka Main showing wide gold intercepts such as 315 m at 1.2 g/t, 324 m at 1.0 g/t, 249 m at 1.5 g/t and 185 m at 1.7 g/t Au, mineralisation open at depth about 700 m vertically, compared against the Stage 3 pit and a US$3,000 pit optimisation shell.
Large geological cross-section with callout labels for each intercept, a plan-view inset at top right and a legend at bottom right.
Section divider photograph of the Sanbrado processing plant lit at dusk.
Title and gold subtitle at top with a full-width dusk photograph below.
Fact sheet covering Sanbrado, Toega and MV3: WAF 85% / government 15%; open-pit and underground mining; resources 67 Mt at 2.0 g/t for 4.4 Moz (US$3,000); reserves 37 Mt at 1.9 g/t for 2.3 Moz (US$2,000); mine life of 11+ years; 3.2 Mtpa CIL plus gravity; 92% recovery; first production March 2020; 2026 YTD production 151,552 oz; 10-year average 256,000 oz a year; 95% Burkinabe workforce including 55% from the local region; 27.5% tax.
Satellite map on the left showing Sanbrado, the 12.6 km haul road to Toega and the 4 km proposed road to MV3; label/value list on the right.
More than 60,000 m of surface and underground drilling in progress; mineralisation at M1 South and M5 open at depth; M5 South underground drilling extending mineralisation about 400 m below the current resource; M5 North surface drilling has increased open-pit reserves with a cutback in the 10-year plan; M1 North drilling completed with cutback potential confirmed.
Bullet list on the left and a 3D model on the right of the M5 and M1 open pits, underground development and planned drilling fans.
A 2.5 km long section from M5 South to the M5 Far North pits showing recent intercepts including 29 m at 16.4 g/t, 22 m at 13 g/t, M5SRD_0027 27 m at 6.7 g/t and SAN25-DD031 16 m at 11.2 g/t Au; bullets note thick high-grade zones beneath the M5 South underground reserve and that infill drilling for the M5 open-pit reserve is complete.
Wide long-section diagram with many callouts (blue for current releases, black for previous), a grade-thickness legend, and two bullets beneath.
Équipe WAF: 3,653 total workforce, 2,491 group employees of whom more than 95% are Burkinabe, 54 internships; more than 32,000 training hours and a government-recognised accreditation program; the first SOMISA scholarship cohort graduated, the SOMISA–Toega program expanded to 4 scholarships a year and a Kiaka program launched with 4 scholarships.
Three headed bullet groups on the left and two stacked photos on the right (geologists underground; staff logging drill core).
ISO 45001-based occupational health and safety management system; WAF TRIFR of 0.87 versus a Western Australian gold industry IFR of 5.7; critical-risk assurance program, external ISO 45001 audits, dedicated OHS and emergency response teams and medical centres at Sanbrado and Kiaka; a multi-layered security strategy aligning company security, community relations and government.
Bold heading and bulleted aspects on the left, a photograph of an emergency response team running a confined-space rescue drill on the right.
Contributions since mining began in 2020: US$865 million paid directly to Burkina Faso in taxes and royalties, US$19 million in community projects and donations, US$48 million to the local development mining fund (1% of revenue) and US$6 million to the mine rehabilitation and closure fund.
Checkmark list at top left, the UN Sustainable Development Goals logo at lower left, and a three-photo collage of community programs on the right.
Programs grouped under education and training (school building with solar power, IT access, vocational training), livelihoods and local economic development (agriculture, livestock, small business, climate resilience and food security), community health (nutrition, health centres, disease prevention) and environmental stewardship (revegetation, seed collection, waste diversion, recycling), mapped to SDGs 2, 3, 4, 6, 8, 10, 12, 13 and 15.
Row of SDG icon tiles across the top right, four headed bullet groups on the left, and a 2x2 photo grid on the right.
Summary table by theme: Team (quality team aligned with shareholders, five years of meeting or beating production guidance), Gold exposure (7 Moz unhedged reserves, 13.7 Moz unhedged resources), ESG (community partnerships and international-standard programs) and Growth (strong cash flow, large land position on greenstone belts, more than 100,000 m of drilling in 2026, aiming to be a sustainable 500 koz+ producer by 2027).
Four-row table with navy label cells on the left and bullet text on translucent white cells, over a faded photo of haul trucks.
Closing slide repeating 'West Africa's growing mid-tier gold producer' with the website www.westafricanresources.com and ticker ASX: WAF.
Full-width group photo of the mine workforce celebrating between two large haul trucks, with a navy band at the bottom for the name, tagline, website and ticker.
ASX: WAF capital structure: 1,144,102,726 ordinary shares, 7,841,788 performance rights, top 20 holders 63%, cash US$830m and gold US$151m at 30 September 2026, Kiaka debt facilities US$213m, market capitalisation A$3,638m at A$3.18/share; analyst coverage from Argonaut, Barrenjoey, Canaccord, Cormark, Euroz Hartleys and Macquarie; investors by location Australia & NZ 53.3%, Europe 24.5%, North America 19.2%, Asia 2.9%; by type institutional 61.7%, retail 11.8%, Helikon Investments 11.8%, L1 Capital 6.9%, State Street 6.1%, insiders and management 1.6%.
Two tables on the left (capital structure, analyst coverage), a horizontal bar chart of investor geography top right and a pie chart of investor type bottom right.
JORC Mineral Resource table by deposit with cut-off grades and Measured, Indicated, Inferred and Total tonnes, grade and contained gold: total 458.5 Mt at 0.9 g/t for 13.7 Moz (Measured 990 koz, Indicated 8,450 koz, Inferred 4,220 koz), led by Kiaka at 9,200 koz and M1 South Underground at 1,320 koz at 8.0 g/t.
Full-width data table with a navy header row, beige unit row and grey total row.
JORC Ore Reserve table by deposit for Proved, Probable and Proved + Probable: total 214.5 Mt at 1.0 g/t for 6,990 koz (Proved 870 koz, Probable 6,120 koz), with Kiaka at 4,620 koz, M1 South UG at 950 koz at 5.8 g/t, Toega at 580 koz and M5 Open Pit at 460 koz.
Full-width data table matching the resource table style: navy category headers, beige unit row and grey total row.
इस स्लाइड और अंतर्निहित प्रस्तुति सामग्री के बारे में सामान्य प्रश्न।
It is a 24-slide investor presentation from West African Resources Limited (ASX: WAF), dated 29 October 2026 and lodged with the ASX. It presents WAF as West Africa's growing mid-tier gold producer, targeting more than 500,000 oz a year from 2027, and covers guidance, financial highlights, the Kiaka and Sanbrado operations, drilling results, ESG and capital structure.
2026 production guidance is 430,000–490,000 oz at AISC under US$1,900/oz, with 360,857 oz produced year to date at US$1,725/oz. H1 2026 NPAT was A$437 million, Mineral Resources are 13.7 Moz, Ore Reserves 7 Moz, and the 10-year target averages 533,000 oz a year (2026–2035), peaking at 596,000 oz in 2030.
Both, as labelled on each slide. Corporate figures such as NPAT (A$437m), the special dividend (A$0.20), market capitalisation (A$3,638m) and cash plus bullion (A$1,412m) are in Australian dollars. Operating and balance-sheet items such as AISC, gold price assumptions, cash (US$830m), gold (US$151m) and debt (US$213m) are in US dollars. WAF reports on calendar years, so 'H1' means January–June 2026.
WAF operates two production centres in south-central Burkina Faso: Sanbrado (open pit and underground, first gold in March 2020, including the Toega and MV3 deposits) and Kiaka (a large open-pit operation, first gold in June 2025). The Burkina Faso government holds a 15% stake in each.
The presentation was lodged with the Australian Securities Exchange (ASX) under ticker WAF and is also available from the investor centre on westafricanresources.com. This gallery page provides the original PDF and an editable PPTX conversion.
Yes. Its structure is a good model for a resources company: cover, legal notice, KPI snapshot, leadership, project map, highlights, production forecast chart, per-asset fact sheets with site maps, drilling sections, people, safety, ESG, investment summary and JORC appendix tables. Download the PPTX version to edit the layouts.
The PPTX is a machine conversion of the original PDF, so text boxes and tables are editable but complex diagrams such as drill sections and maps come across largely as images. Check spacing and fonts before reusing slides.
Slide 23 lists Mineral Resources of 458.5 Mt at 0.9 g/t for 13.7 Moz of gold across ten deposits and stockpiles, and slide 24 lists Ore Reserves of 214.5 Mt at 1.0 g/t for 6.99 Moz. Kiaka holds the largest share, while M1 South Underground is the highest-grade deposit.
Company announcements page cited in the deck's disclaimer, including the ASX releases referenced on each slide.

Create Your Own Slides
Turn your ideas into professional presentations in seconds with 2slides AI.
पेशेवर डिज़ाइन का संदर्भ लें, अपनी शैली चुनें, और सही टेक्स्ट रेंडरिंग के साथ स्लाइड्स जेनरेट करें। Nano Banana द्वारा संचालित—अभी अपना प्रेजेंटेशन बनाना शुरू करें।
स्लाइड के लिए आपका AI एजेंट। बुद्धिमान प्रस्तुति निर्माण के साथ समय बचाएं, तेजी से चमकें।


© 2026 2slides। सभी अधिकार सुरक्षित।