
इस संग्रह का हिस्सा: निवेशक प्रेज़ेंटेशन के उदाहरण · ई-कॉमर्स प्रेज़ेंटेशन के उदाहरण
Shopify Q2 2026 Investor Presentation — "Defining the next era of commerce": a 31-slide earnings deck covering Shopify's scale, its unified commerce hub, agentic AI commerce (Sidekick, Catalog, UCP), and quarterly GMV, revenue, payments, subscription, MRR, profitability, operating leverage and free cash flow, with a full non-GAAP reconciliation appendix
त्वरित नेविगेशन
टैग
स्लाइड साझा करें
Shopify Q2 2026 Investor Presentation — "Defining the next era of commerce": a 31-slide earnings deck covering Shopify's scale, its unified commerce hub, agentic AI commerce (Sidekick, Catalog, UCP), and quarterly GMV, revenue, payments, subscription, MRR, profitability, operating leverage and free cash flow, with a full non-GAAP reconciliation appendix
प्रत्येक स्लाइड पृष्ठ का विस्तृत दृश्य, लेआउट, मुख्य सामग्री और दृश्य तत्वों सहित।
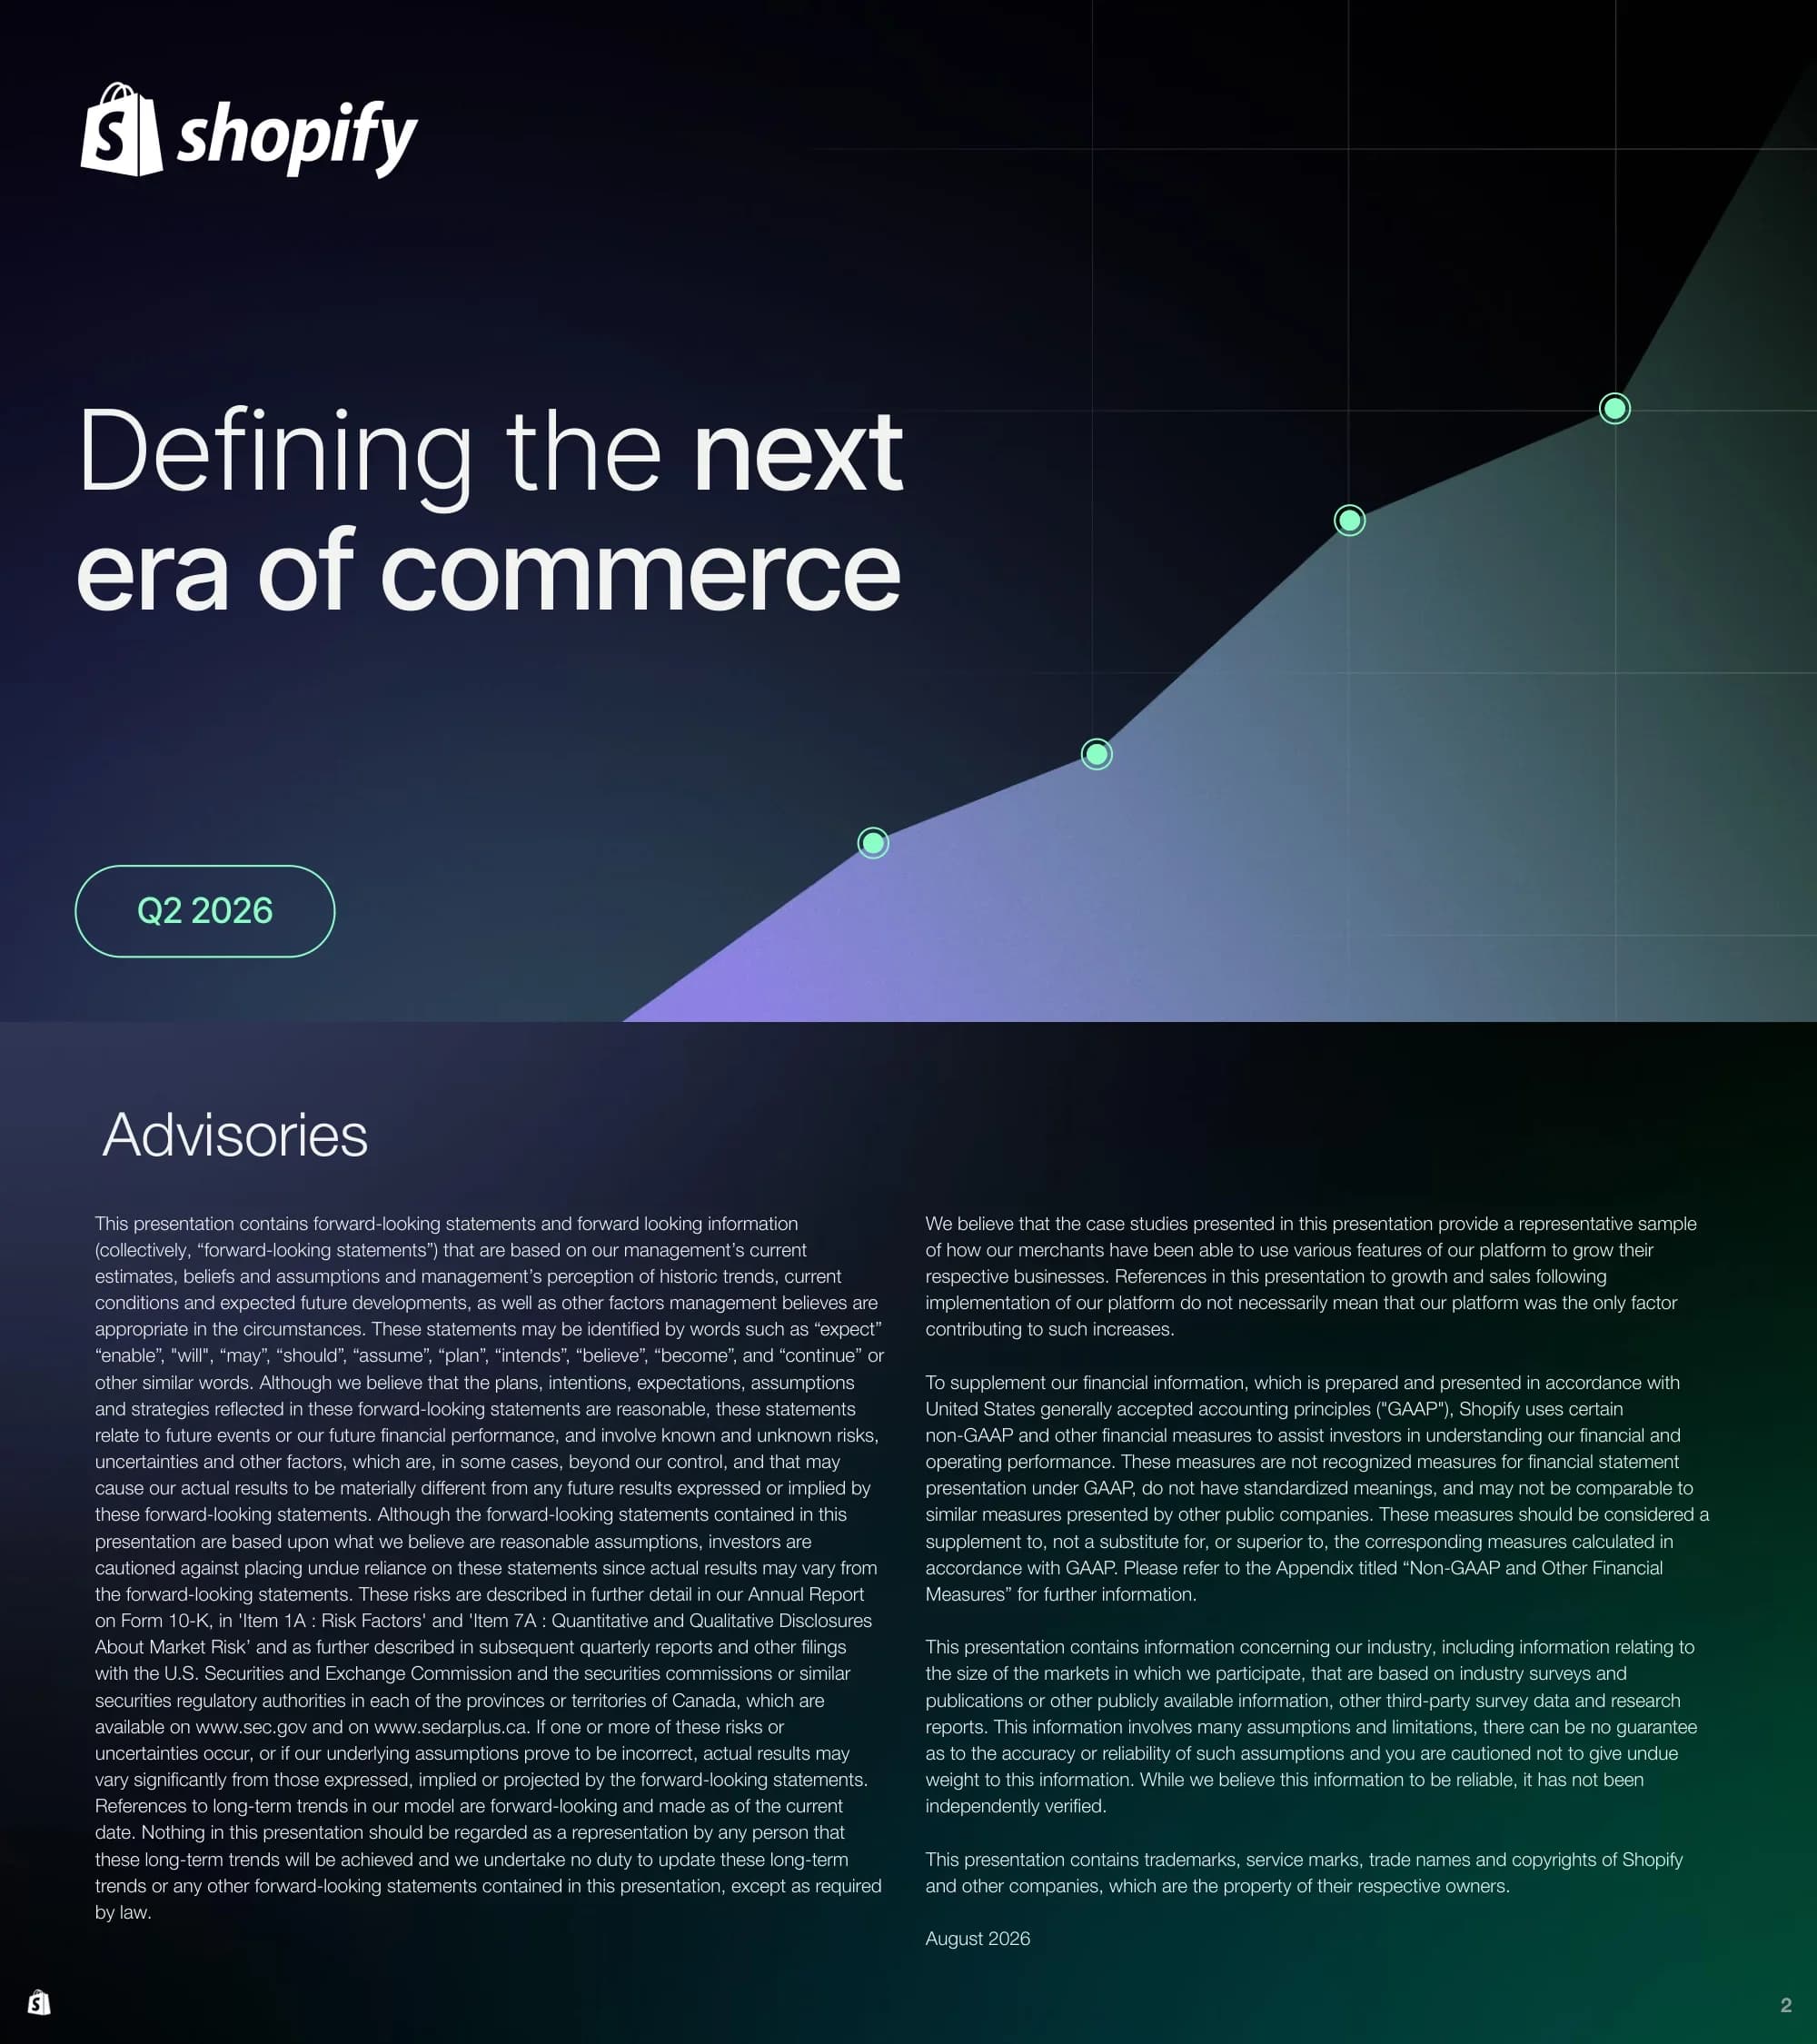
Cover slide with the Shopify logo, the headline "Defining the next era of commerce" with "next" in bold, and a mint-outlined pill badge reading Q2 2026.
Left-aligned logo and large two-line headline over a dark navy background; a rising purple-to-teal area chart with four glowing mint data points sweeps up from the bottom right; period pill anchored bottom left.
Legal disclaimer covering forward-looking statements and risk factors (Form 10-K, SEC and SEDAR+ filings), the representativeness of merchant case studies, use of non-GAAP measures, reliance on third-party industry data, and trademarks; dated August 2026.
Title top left with two dense columns of small body text on a dark blue-to-green gradient; page number bottom right and small logo bottom left.
Scale snapshot under the line "20 years of commerce. Ready for what's next.": $13.3B LTM revenue, $1.8T cumulative global commerce since inception, over 14% US e-commerce market share, 1B+ products in Shopify Catalog, and millions of merchants in 175+ countries.
Split layout: left half is a dark panel with five big-number rows separated by dotted rules and short labels; right half is a mosaic grid of black-and-white merchant portrait photos; footnotes define GMV and market share sources.
Shopify positioned as the Unified Commerce Hub at the center of every channel: Online Store, Offline, B2B, Social Commerce, Marketplaces (Amazon, eBay), Shop App, AI Chats and Shoppable Agentic Experiences.
Headline on the left; on the right a large circular wheel diagram with concentric purple rings, a glowing mint-to-lavender Shopify hub in the middle and eight dotted-line wedges each holding an icon and channel label.
Section opener with the pill label Platform Highlights and the statement "Strength of platform creates embedded customer relationships."
Full-bleed dark-to-lavender-to-teal gradient; mint outlined pill top left, logo top right, large mixed-weight headline bottom left.
Brand-wins wall by quarter: Q2 2025 (Canada Goose, Miele, Tatcha, Starbucks, Wedgwood, Burton), Q3 2025 (e.l.f., Stokke, Estée Lauder, Ladurée, Formlabs, UGG), Q4 2025 (Benetton, Sonos, Keurig Dr Pepper, GM, Amer Sports, L'Oréal), Q1 2026 (Lands' End, Mulberry, The Outnet, BevMo!, rag & bone, Balmain), plus new Q2 2026 brands Holt Renfrew, Guess, Fred Segal, Avon, Country Road Group and Arhaus.
Dark header bar with title and a mint highlight box for "+ Q2 2026 Brands"; four narrow columns of white logos separated by vertical rules, with a wider highlighted right column for the newest quarter.
Introduces the refreshed merchant Admin as the first merchant-facing surface for agentic commerce performance: a dashboard showing $103,813 earned and 8,935 agentic sessions in 30 days across ChatGPT, Google AI Mode, Copilot and Shop; a New Agentic section to see which AI channels a merchant is live on; buyer-query search to see product rank; and Sidekick flagging what to fix when discovery works but conversion does not.
Title and subtitle top left; a central collage of overlapping product UI screenshots (agentic sales card, Explore checklist, channel toggles, Sources panel, search results) with three mint-highlighted callouts on the left, right and lower left.
Sidekick, Shopify's AI assistant, now powers admin and app extensions across a grid of partner apps (TikTok, Amazon, Klaviyo, Yotpo, Google and others); stats bar shows 34M Sidekick conversations, daily active merchants up 3.6x YoY, and 36,000 custom apps created using Sidekick versus 12,000 in Q1.
Headline across the top; left a tile grid of app icons topped by the Sidekick mascot, linked by mint connector lines and a plus node to a large Shopify Admin home screenshot on the right; a three-part KPI strip spans the bottom.
Explains three building blocks: Catalog connects agents to product and variant data, Checkout converts buyer intent into a completed transaction, and UCP makes it interoperable across agents, merchants and platforms; AI searches powered by Catalog convert 2x more than those using scraped data, 1B+ products are listed, and 75% of AI-attributed orders came from outside the top 100 categories.
Bullet copy with a mint left rule at top left, two stat cards with mint left edges below; on the right a neon yellow sneaker linked by a callout line to a code-style structured product data card with colored keys.
Shopify merchants are seeing the impact of AI: a 3x increase in AI traffic to merchant storefronts YoY, a 3x increase in orders originating from AI searches YoY, and a 2x new-buyer order rate versus other channels.
Title and subtitle top left; three ascending green gradient pillars of increasing height, each with a large multiplier and description, connected by dotted lines like a staircase.
Section opener labeled Quarterly Financials with the line "When our merchants become more successful, Shopify becomes more successful."
Full-bleed navy-to-blue-to-teal gradient, mint pill label top left, logo top right, large headline bottom left with the second half in bold.
Quarterly GMV rising from $50B in Q1 2023 to $124B in Q4 2025 and $116B in Q2 2026 (+32% YoY, +30% constant currency); revenue rising from $1.5B to $3.6B in Q2 2026 (+34% YoY), with Merchant Solutions at 78% and Subscription Solutions at 22% of revenue.
Two-panel chart slide: left a lavender bar chart of GMV grouped by year with dotted separators and two YoY growth rows beneath; right a stacked area/line chart of revenue split into merchant and subscription solutions with percentage badges and matching YoY rows.
Quarterly revenue of the Q1 2015 merchant cohort from 2015 to 2026 (excluding Logistics), showing 3.3x growth and a 12% CAGR comparing the last four quarters to the cohort's first four full quarters.
Title and subtitle top left with a dark rounded stat box; a dense mint bar chart spans the width with year labels along the bottom axis and footnotes defining the calculation.
Revenue retention curves for eleven annual merchant cohorts from Q1 2015 to Q1 2025 plotted by age in quarters (up to 45), showing every cohort grows revenue over time with a seasonal Q4 sawtooth pattern.
Title top left, color-coded legend row beneath, full-width multi-line chart with axes labeled Revenue growth and Age in quarters; footnotes at the bottom.
YoY GMV growth in constant currency by region from Q1 2023 to Q2 2026: Europe peaking at 42% and at 34% in Q2 2026, North America rising from 14% to 28%, and total GMV growing from 18% to 30%.
Title top left with a three-item legend; three labeled line series (lavender Europe, blue total, mint North America) with every data point annotated across fourteen quarters.
Gross Payments Volume grew from $36B in Q1 2024 to $78B in Q2 2026, with GMV penetration rising from 60% to 68%.
Horizontal funnel-shaped gradient band widening from left to right with a small $36B circle on the left and a large $78B circle on the right; a thin timeline with drop lines to quarterly penetration percentages along the bottom.
Cumulative Shopify Payments volume from 2013 to 2026 follows an exponential curve, crossing $1.0T in Q2 2026.
Single area chart with mint line and green fill, dashed reference line at $1000B, and a large mint circle badge reading $1.0T at the curve's end.
Subscription solutions revenue grew from $382M in Q1 2023 to $802M in Q2 2026 (+22% YoY), with the mix in Q2 2026 at 52% Standard plans, 27% Shopify Plus and 21% apps, themes, domains and variable platform fees.
Fourteen stacked bars in indigo, lavender and mint with percentage labels inside each segment; start and end totals highlighted in dark circles; legend under the title.
MRR grew from $95M in Q2 2021 to $221M in Q2 2026, an 18% five-year CAGR; footnote defines MRR and notes the Q1 2024 methodology revision for paid trials.
Outlined white bar chart across 21 quarters, a dotted arrow from the first bar's mint $95M circle to a large lavender $221M circle, and a gradient pill callout for the CAGR.
Gross profit grew from $717M in Q1 2023 to $1.7B in Q2 2026 (+31% YoY), with gross margin listed per quarter ranging from 46.1% to 52.6% and 47.7% in Q2 2026.
Lavender gradient bar chart grouped by year with dotted dividers, value and YoY labels above each bar, and a gross margin row beneath the axis.
Operating expenses excluding one-time items as a percentage of revenue, compared by quarter across years: Q1 fell from 60% (2023) to 37% (2026), Q2 from 48% to 34%, Q3 from 43% to 37%, Q4 from 36% to 29%.
Mint gradient bars arranged in four same-quarter groups separated by dotted lines, with a dotted downward trend arrow running across the whole chart.
Adjusted operating expenses as a share of revenue fell from 37% in Q2 2024 to 33% in Q2 2025 and 30% in Q2 2026, broken into sales and marketing (17% to 14%), R&D (13% to 10%), G&A (4% to 3%) and transaction and loan losses (2% to 4%).
Three stacked columns with four color-coded cost segments and side labels; circled totals above each column connected by a dotted declining line; legend across the top.
Free cash flow margin by quarter from 6% in Q1 2023 to peaks of 21-22% in Q4, with 15% in Q1 2026 and 18% in Q2 2026; footnote notes merchant cash advance cash flows moved to investing activities starting April 2026.
Lavender gradient bar chart grouped by year with dotted vertical separators and percentage labels above bars; footnotes at bottom.
Closing narrative slide: "However commerce evolves, Shopify will be the engine behind it. The merchants who are the backbone of the economy demand it of us," illustrated by the founder of the merchant brand Yowie in her store.
Split layout: left half dark-to-blue gradient with mint pill and large statement; right half full-height color photo of a merchant in a retail shop with a white logo plate overlay.
Appendix section divider introducing non-GAAP and other financial measures.
Full-bleed green-teal-blue gradient with mint Appendix pill top left, logo top right and a large two-line headline bottom left.
Definitions of adjusted operating expenses, operating expenses excluding one-time items, operating leverage, free cash flow and free cash flow margin, plus why management uses them; dated August 2026.
White background text slide with a large black title and justified paragraphs across the full width; page number bottom right.
Quarterly table from Q1'23 to Q2'26 reconciling GAAP sales and marketing (to adjusted $489M, 14% of revenue in Q2'26) and GAAP research and development (to adjusted $351M, 10%) by removing SBC, accelerated SBC, severance and amortization of acquired intangibles.
White-background financial table with fourteen quarterly columns, bold subtotal rows with heavy rules, and percent-of-revenue rows.
Continuation table reconciling G&A, transaction and loan losses and total GAAP operating expenses (including the $1,340M Q2'23 logistics impairment) to adjusted operating expenses of $1,089M, 30% of revenue, in Q2'26.
Full-page white table without a title, same column structure as the previous slide, bold section headers and totals.
Table bridging GAAP operating expenses to operating expenses excluding one-time items (accelerated SBC, impairments, severance, litigation, logistics sale impairment), giving 34% of revenue in Q2'26 versus 48% in Q2'23.
White-background table with title, quarterly columns and a bold total plus percent-of-revenue row; lower half left empty.
Annual (2020-2025) and quarterly (Q1'23-Q2'26) free cash flow reconciliation: operating cash flow less capex; FY2025 FCF of $2,007M on $11,556M revenue (17% margin) and Q2'26 FCF of $654M on $3,583M revenue (18%).
Two stacked white tables, annual on top and quarterly below, with footnotes on capex definition and the merchant cash advance presentation change.
Closing slide with the Shopify logo and mission statement "Make commerce better for everyone."
Mirrors the cover: logo and two-line statement on the left over a dark background with the same rising gradient area chart and mint nodes on the right.
इस स्लाइड और अंतर्निहित प्रस्तुति सामग्री के बारे में सामान्य प्रश्न।
It is Shopify's 31-slide quarterly investor deck from August 2026. It covers company scale ($13.3B LTM revenue, over 14% US e-commerce share), the unified commerce hub, agentic AI commerce products like the refreshed Admin, Sidekick and Catalog, and quarterly financials including GMV, revenue, payments, subscription revenue, MRR, gross profit, operating leverage and free cash flow, plus a non-GAAP reconciliation appendix.
GMV of $116B (+32% YoY), revenue of $3.6B (+34% YoY), gross profit of $1.7B (+31%), Gross Payments Volume of $78B at 68% GMV penetration, subscription solutions revenue of $802M, MRR of $221M, and an 18% free cash flow margin. Cumulative GPV also crossed $1 trillion during the quarter.
Yes. The gallery page offers the original PDF and a PPTX version converted from it, so you can open it in PowerPoint, Keynote or Google Slides and reuse the chart layouts, section dividers and table structures.
It is a strong reference. The deck follows a clear arc of scale snapshot, platform strategy, AI story, financial trends and appendix, and its chart patterns (grouped quarterly bars with YoY rows, stacked revenue mix, cohort curves, KPI callout circles) adapt well to any SaaS, marketplace or commerce company.
A dark navy-to-purple base with soft gradient section dividers, mint-green accents and pill labels, lavender and mint charts, light-weight sans-serif headlines with bold emphasis words, and white document-style pages for the appendix tables.
Slides 7 to 10 pair product screenshots with adoption metrics: agentic storefront sales by AI channel, 34M Sidekick conversations, 36,000 Sidekick-built custom apps, Catalog-powered searches converting 2x better than scraped data, and 3x YoY growth in AI traffic and AI-originated orders.
Use 2Slides to generate a presentation from your own data or documents, or create slides in a similar style from this reference deck, then refine the charts and numbers to match your company's results.

Create Your Own Slides
Turn your ideas into professional presentations in seconds with 2slides AI.
पेशेवर डिज़ाइन का संदर्भ लें, अपनी शैली चुनें, और सही टेक्स्ट रेंडरिंग के साथ स्लाइड्स जेनरेट करें। Nano Banana द्वारा संचालित—अभी अपना प्रेजेंटेशन बनाना शुरू करें।
स्लाइड के लिए आपका AI एजेंट। बुद्धिमान प्रस्तुति निर्माण के साथ समय बचाएं, तेजी से चमकें।


© 2026 2slides। सभी अधिकार सुरक्षित।