
इस संग्रह का हिस्सा: निवेशक प्रेज़ेंटेशन के उदाहरण
Nan Ya Plastics Q3 2026 Earnings Presentation (3Q26 Operations & Performance, October 2026) - the English deck filed on Taiwan's Market Observation Post System (MOPS) for the investor conference (法說會) hosted by Taishin Securities. Nan Ya Plastics (TWSE: 1303), the Formosa Plastics Group company, reported record 3Q26 EPS of NT$4.90 (New Taiwan dollars), consolidated revenue of NT$95.60 billion and operating profit of NT$18.31 billion, as AI-driven shortages of PCB materials pushed electronic materials to 58.1% of quarterly revenue with a 30.9% operating margin. All 3Q26 figures are unaudited.
आपके अपने कंटेंट से बनी स्लाइड्स के लिए इस प्रेज़ेंटेशन के कवर को स्टाइल रेफ़रेंस के रूप में इस्तेमाल करता है। या नीचे से कोई भी पेज चुनें और उसके लेआउट को रेफ़रेंस की तरह इस्तेमाल करें।
त्वरित नेविगेशन
टैग
स्लाइड साझा करें
Nan Ya Plastics Q3 2026 Earnings Presentation (3Q26 Operations & Performance, October 2026) - the English deck filed on Taiwan's Market Observation Post System (MOPS) for the investor conference (法說會) hosted by Taishin Securities. Nan Ya Plastics (TWSE: 1303), the Formosa Plastics Group company, reported record 3Q26 EPS of NT$4.90 (New Taiwan dollars), consolidated revenue of NT$95.60 billion and operating profit of NT$18.31 billion, as AI-driven shortages of PCB materials pushed electronic materials to 58.1% of quarterly revenue with a 30.9% operating margin. All 3Q26 figures are unaudited.
प्रत्येक स्लाइड पृष्ठ का विस्तृत दृश्य, लेआउट, मुख्य सामग्री और दृश्य तत्वों सहित।
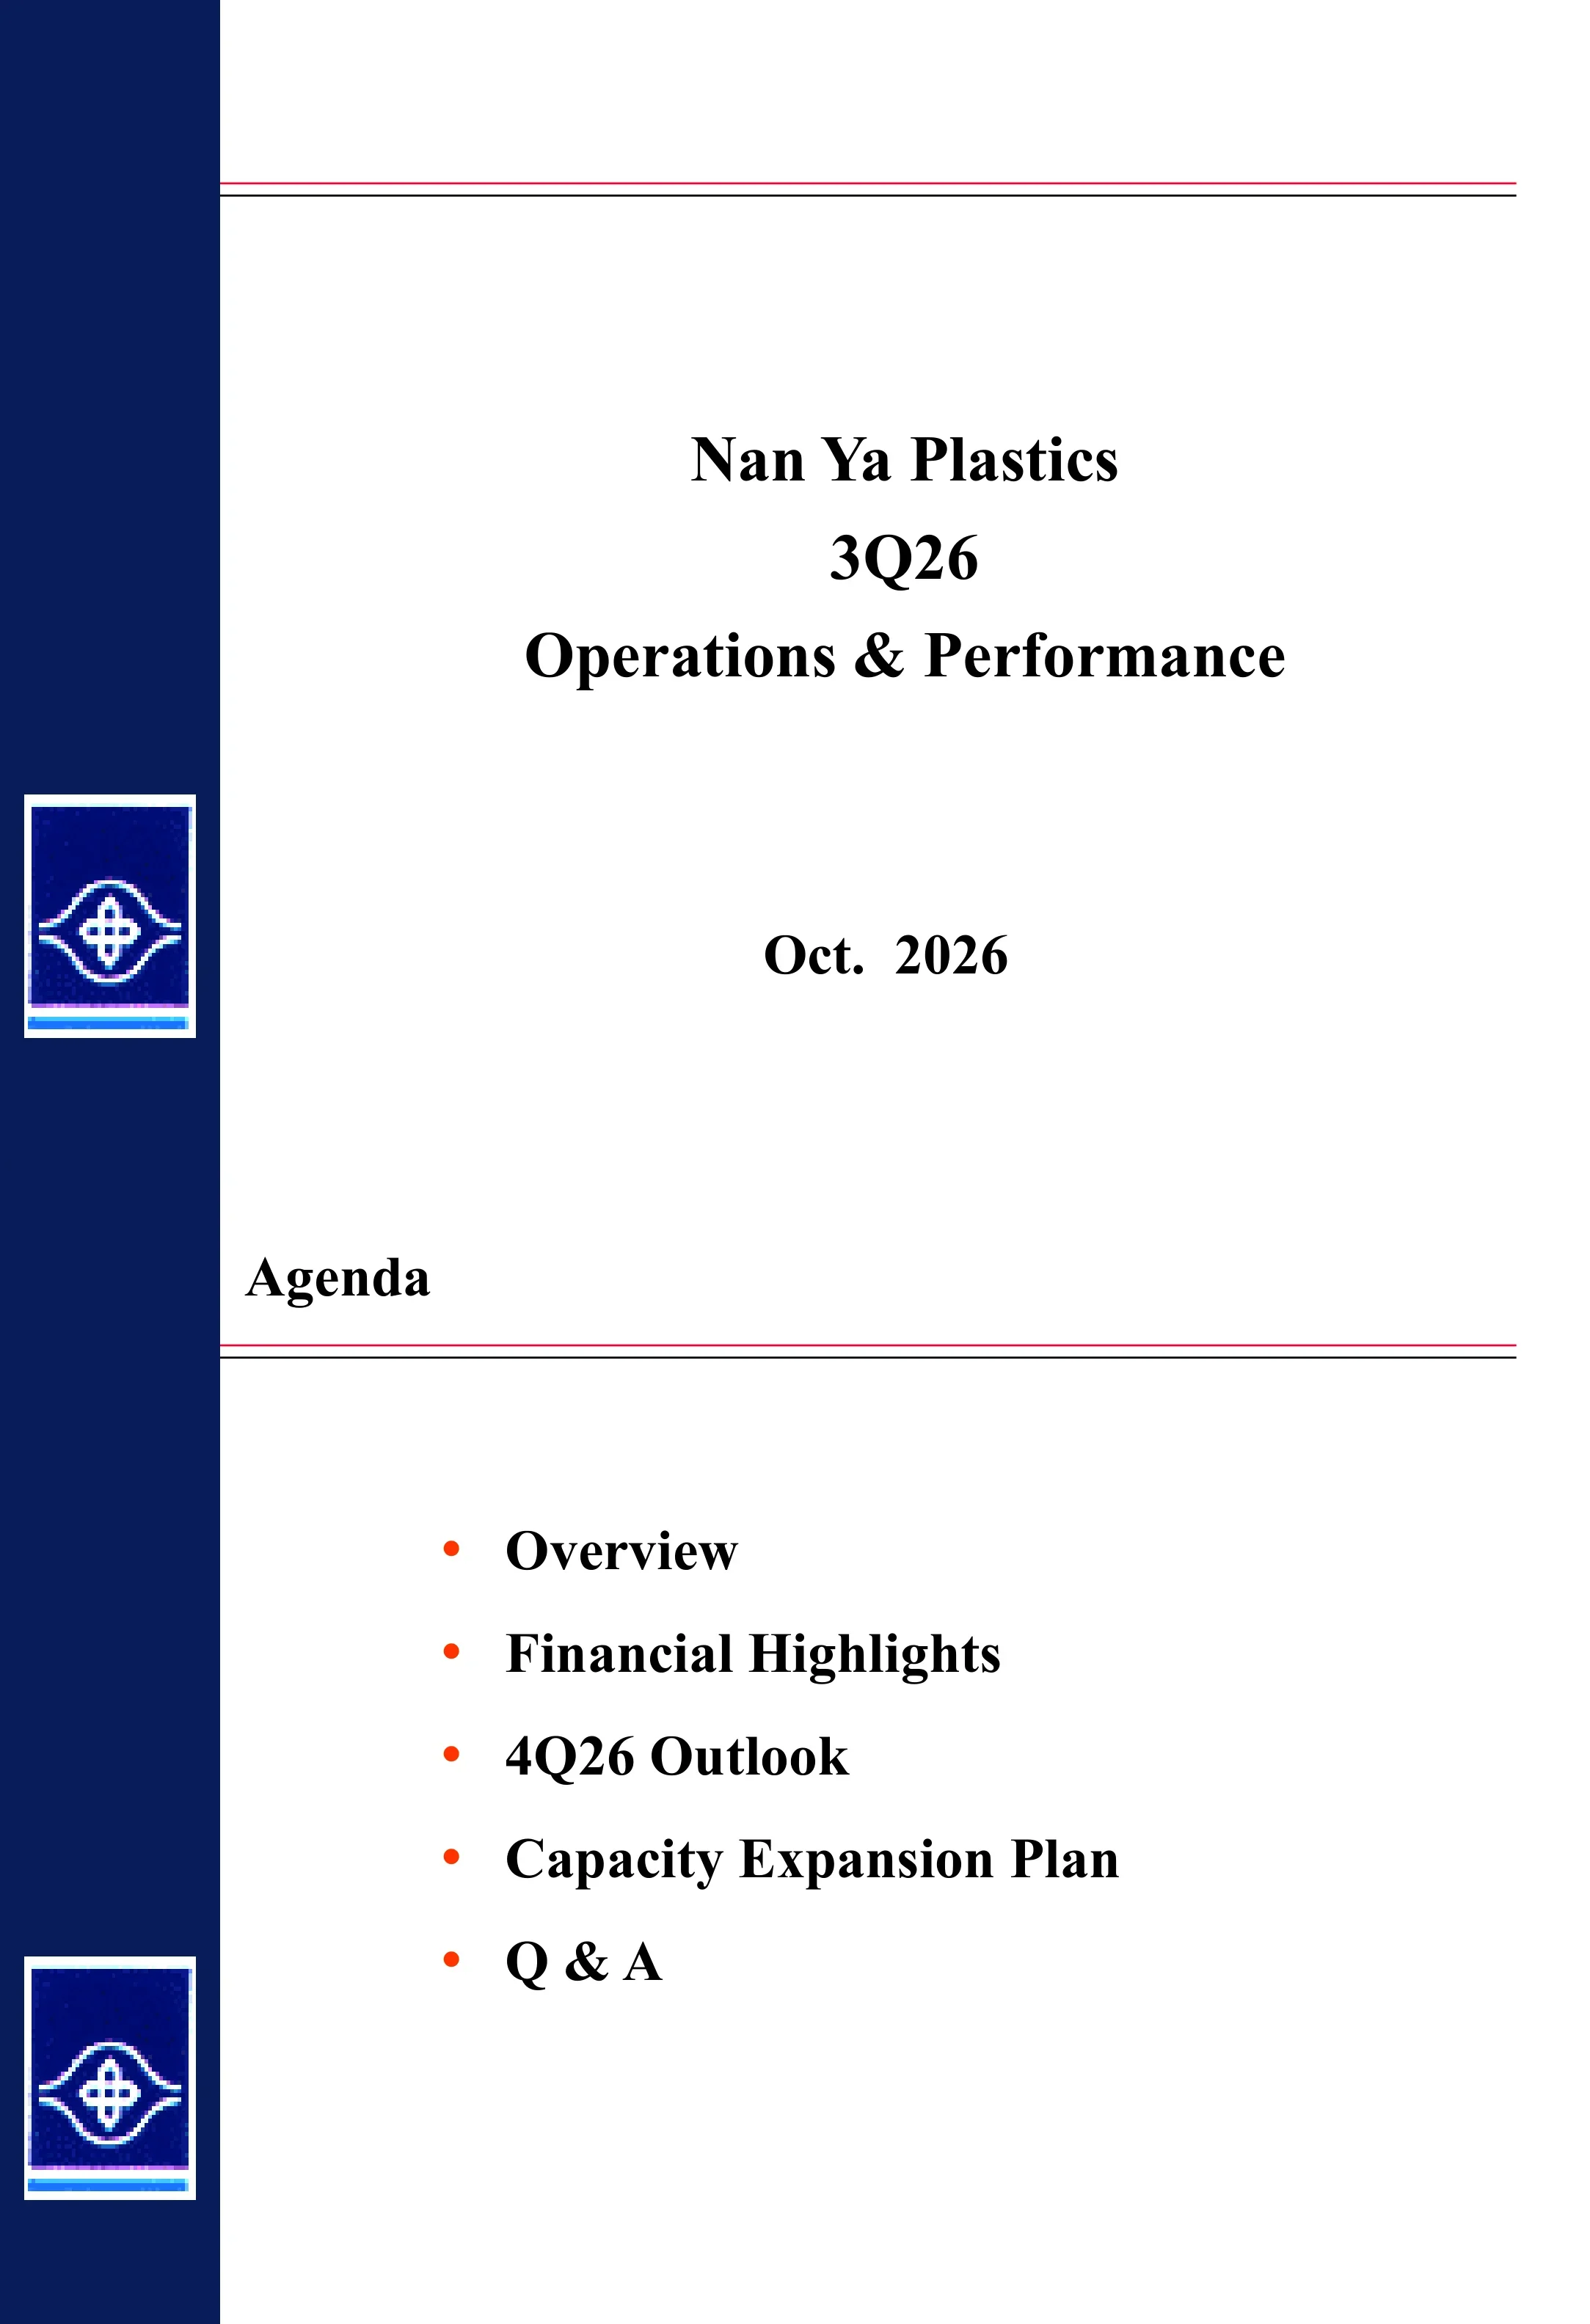
Cover slide titled 'Nan Ya Plastics 3Q26 Operations & Performance', dated October 2026.
Navy vertical band on the left with the Nan Ya logo at the bottom; centered serif title stack on white with a thin red-and-black rule across the top third.
Five agenda items: Overview, Financial Highlights, 4Q26 Outlook, Capacity Expansion Plan, and Q&A.
Slide title at top left under the standard header rule; a single bulleted list with red-orange bullets set in large bold serif type.
Company snapshot: market capitalization NT$2,403.0 billion (October 2026); 2025 sales revenue NT$259.9 billion excluding Nanya Technology, split 14% plastics, 22% chemicals, 46% electronics and 16% polyesters; 99 plants (57 in Taiwan, 34 in China, 8 in the US); 28,616 employees, counting the consolidated reporting group.
Central three-circle cycle graphic (Market Capitalization, Sales Revenue, Worldwide Distribution) around the Formosa group emblem, with callout text blocks placed beside each circle.
Global capacity rankings as of FY2025: No. 1 in plastics processing; No. 2 in electronic glass fiber yarn; No. 3 in copper clad laminate and glass fabrics; No. 4 in EG (ethylene glycol); No. 5 in epoxy resin and BPA.
Five large interlocking numbered rings (1 to 5) running left to right over a faint world map, each with color-matched product labels beneath; footnote at the bottom.
Timeline of Nan Ya's expansion: plastics (1958), polyester (1968), printed circuit boards (1984), electronic materials (1985), semiconductors (1995), petrochemicals (1996), medical materials (2021), and composite materials and power engineering (2026). Bullets say electronics and related materials now contribute more than 50% of revenue, and that the company runs integrated bases in Taiwan, China, the US and Vietnam under a 'Diversified Portfolio, Innovation-Driven Development' strategy.
Four justified bullets across the top half; below, a horizontal arrow timeline with alternating above/below year markers, circular product photos, and a large blue arrow labelled with the strategy slogan.
2025 sales breakdown by business, with regional split for each: Plastics 14% (PVC sheeting, rigid film, PU leather, pipe and fittings, window frames, compounds, PP synthetic paper; Taiwan 61%, China 24%, USA 15%); Electronics 46% (glass yarn, glass fabrics, epoxy resin, copper foil, CCL, PCB; China 57%, Taiwan 43%); Chemicals 22% (EG, BPA, 1,4BG, plasticizer, PA, 2EH, INA, MA; Taiwan 58%, USA 27%, China 15%); Polyesters 16% (staple fiber, PET resin, filament, PET film; USA 56%, Taiwan 39%, China 5%).
Four-quadrant grid; each quadrant has a blue banner with icon, segment name and large percentage, a product list on the left and a stacked bar of regional shares on the right.
EPS of NT$3.37 in 2Q26 and NT$4.90 in 3Q26, a single-quarter record; NT$10.07 for 1Q-3Q26 versus -NT$0.05 for 1Q-3Q25. The QoQ gain came from electronic materials (operating profit up 96.1% QoQ at a 30.9% margin) on supply shortages, early next-generation material development and price increases, plus equity-method gains from Nanya Technology on rising memory prices. Nine-month EPS exceeded one full unit of capital stock. Figures marked unaudited.
Four-bar column chart across the top (light blue for 2Q26, navy for the other periods) with value labels; two red-square headed commentary paragraphs below explaining the QoQ and YoY change.
Revenue of NT$83.65 billion in 2Q26 and NT$95.60 billion in 3Q26; NT$247.84 billion for 1Q-3Q26 versus NT$195.45 billion for 1Q-3Q25. AI infrastructure build-outs drove monthly price rises and spec upgrades for high-speed, ultra-low-loss materials; electronic-material lines are close to full utilization and reached 58.1% of quarterly revenue. Ethylene glycol prices hit multi-year highs as Middle Eastern capacity stayed offline, and Middle East conflict lifted chemical prices with feedstock costs through 2Q-3Q26.
Same template as the EPS slide: four-bar column chart in NT$ billion on top, two explanatory paragraphs for QoQ and YoY growth below.
Operating profit of NT$11.36 billion in 2Q26 and NT$18.31 billion in 3Q26; NT$33.41 billion for 1Q-3Q26 versus NT$2.37 billion for 1Q-3Q25. Electronic materials led the QoQ rise as AI demand pushes PCB materials to higher layer counts and more complex formulations. Year on year, all four segments improved: electronic materials operating profit surged 995.1% YoY, chemicals benefited from higher prices and wider spreads, and polyester returned to profit as low-price dumping eased.
Column chart of four periods on top, two commentary blocks below with red square bullets; title positioned slightly higher than on other slides.
Pre-tax income of NT$30.76 billion in 2Q26 and NT$47.22 billion in 3Q26; NT$94.06 billion for 1Q-3Q26 versus NT$0.62 billion for 1Q-3Q25. QoQ: operating profit up NT$6.95 billion (electronic materials +NT$8.42 billion) and equity income up NT$10.32 billion (Nanya Tech +NT$9.92 billion, FPCC +NT$1.27 billion). YoY: operating profit up NT$31.04 billion (electronic materials +NT$27.88 billion, chemicals +NT$1.99 billion) and equity income up NT$60.95 billion (Nanya Tech +NT$46.14 billion, FPCC +NT$14.49 billion); the slide labels this second equity line 'QoQ', though it sits under the YoY heading.
Four-bar chart on top; numbered lists under two red-square headings breaking the change into operating profit and equity income contributions.
Net sales mix for three quarters. 3Q25 (NT$64.18 billion): electronics 46.6%, chemicals 22.9%, polyesters 14.7%, plastics 14.0%, others 1.8%. 2Q26 (NT$83.65 billion): electronics 52.6%, chemicals 17.4%, polyesters 15.9%, plastics 12.2%, others 1.9%. 3Q26 (NT$95.60 billion): electronics 58.1%, chemicals 16.2%, polyesters 13.5%, plastics 10.4%, others 1.8%. Commentary cites in-house development of Low Dk and Low CTE glass fibers, HVLP copper foils, proprietary hydrocarbon resins and ultra-low-loss CCL across an integrated PCB value chain.
Three donut charts side by side with quarter and revenue headings underlined; three red-square bullet paragraphs beneath.
Two tables across 3Q25, 4Q25, 1Q26, 2Q26 and 3Q26. Share of operating profit: electronic material 108.5%, 187.0%, 127.2%, 77.1%, 93.8%; chemical -103.8%, -152.2%, -47.9%, 2.7%, 0.5%; polyester -35.0%, -23.2%, -6.3%, 6.3%, 0.1%; plastics 73.0%, 60.1%, 22.9%, 8.7%, 2.9%. Operating margins: electronic material 3.8%, 7.6%, 13.1%, 19.9%, 30.9%; chemical -7.3%, -17.5%, -16.0%, 2.1%, 0.6%; polyester -3.9%, -3.1%, -2.2%, 5.3%, 5.4%; plastics 8.4%, 8.9%, 9.4%, 9.7%, 0.2%.
Two stacked data tables with blue header rows and alternating grey row shading, each introduced by a red-square subheading.
Nan Ya expects 4Q26 consolidated revenue and overall performance to exceed 3Q after record nine-month results. Electronic materials: restarting and optimizing lines to lift output, with high-end materials entering concurrent shipment and qualification in 4Q. Chemicals and polyesters: downstream demand has not clearly recovered and customers place short-term orders around Golden Week and year-end stock counts. Polyesters: high fiber raw-material prices and US Thanksgiving and Christmas shutdowns weigh on volumes, while polyester films grow on AI server and electronics demand. Plastics: year-end public infrastructure spending and a housing construction rush lift building-material demand.
Text-only slide: an intro paragraph followed by four red-square segment headings in blue sans-serif, each with a justified serif paragraph.
Expansion table. Taiwan: co-polyester resin polymer line upgrade, 36 KMT new (2026/10); polyester release film 5th and 6th sets, each 144,000 KM2 added to 360,000 KM2 (+40%, 2026/10); fluoropolymer tubing 240 and fittings 60 tons, new (2028/1); electronic-grade liquid CO2 36,000 tons, new (2027/3); solar PV system 56,266 KW (2026/12, with 33,318.5 KW installed as of September 2026). Mainland China: copper foil 23,400 tons added to 60,000 tons (+39%, 2028/1). USA: flexible PVC sheeting 14 KMT added to 48 KMT (+29%, 2026/10).
Full-width table with merged area cells (Taiwan, Mainland China, USA) and columns for product, unit, current capacity, expansion, increase % and estimated commissioning date; two notes below.
Closing slide reading 'THE END'; the agenda's Q&A session followed.
Large centered serif text on white with the navy gradient sidebar and logo on the left.
इस स्लाइड और अंतर्निहित प्रस्तुति सामग्री के बारे में सामान्य प्रश्न।
According to the deck, 3Q26 consolidated revenue was NT$95.60 billion (New Taiwan dollars), operating profit NT$18.31 billion, pre-tax income NT$47.22 billion and EPS NT$4.90, a single-quarter record. All 3Q26 figures are marked unaudited.
It is the English deck Nan Ya Plastics (TWSE: 1303) filed on Taiwan's Market Observation Post System (MOPS) for its investor conference (法說會) hosted by Taishin Securities in October 2026. A Chinese-language version is also filed on MOPS.
The deck credits AI infrastructure demand, which created shortages of PCB materials such as glass fiber yarn, copper foil and CCL and lifted prices month after month. Electronic materials reached a 30.9% operating margin in 3Q26. Equity income from Nanya Technology, which benefited from higher memory prices, and from FPCC added substantially to pre-tax income.
Electronics was 46.6% of net sales in 3Q25, 52.6% in 2Q26 and 58.1% in 3Q26. For full-year 2025 the split was 46% electronics, 22% chemicals, 16% polyesters and 14% plastics.
Management expects 4Q revenue and overall performance to exceed 3Q, driven by electronic materials as high-end products move into concurrent shipment and qualification. Chemicals and polyesters face cautious short-term ordering, while plastics should benefit from year-end infrastructure and housing construction.
The plan includes polyester release film (+40%), co-polyester resin and a flexible PVC sheeting expansion in the USA (+29%) commissioning in October 2026, a 56,266 KW solar system by December 2026, electronic-grade liquid CO2 in March 2027, and copper foil in mainland China (+39%) plus fluoropolymer tubing and fittings in January 2028.
Yes. The page offers the original PDF and a PPTX version converted from it, which you can edit and reuse as a structure for your own quarterly earnings presentation.
It is a compact 15-slide structure: cover, agenda, company overview, four KPI charts with QoQ and YoY commentary, a revenue-mix comparison, a segment margin table, outlook and a capex table. It suits industrial and materials companies presenting to analysts.
Official disclosure system where Taiwan-listed companies file investor conference materials, including this deck.

Create Your Own Slides
Turn your ideas into professional presentations in seconds with 2slides AI.
पेशेवर डिज़ाइन का संदर्भ लें, अपनी शैली चुनें, और सही टेक्स्ट रेंडरिंग के साथ स्लाइड्स जेनरेट करें। Nano Banana द्वारा संचालित—अभी अपना प्रेजेंटेशन बनाना शुरू करें।
स्लाइड के लिए आपका AI एजेंट। बुद्धिमान प्रस्तुति निर्माण के साथ समय बचाएं, तेजी से चमकें।


© 2026 2slides। सभी अधिकार सुरक्षित।