
इस संग्रह का हिस्सा: निवेशक प्रेज़ेंटेशन के उदाहरण
Jio Financial Services Q2 FY27 & H1 FY27 Earnings Presentation (October 15, 2026) — a 32-page quarterly results deck from Jio Financial Services Limited (JFSL), filed with the Indian stock exchanges (BSE/NSE), covering the quarter ended September 30, 2026 (Indian FY27 runs April 2026 to March 2027). It walks through group-wide growth across lending, payments, payments banking, insurance broking, asset management and reinsurance, the JioFinance app, the BlackRock, Allianz and Bank of America partnerships, and full consolidated, standalone and Jio Credit financial statements in ₹ crore.
आपके अपने कंटेंट से बनी स्लाइड्स के लिए इस प्रेज़ेंटेशन के कवर को स्टाइल रेफ़रेंस के रूप में इस्तेमाल करता है। या नीचे से कोई भी पेज चुनें और उसके लेआउट को रेफ़रेंस की तरह इस्तेमाल करें।
त्वरित नेविगेशन
टैग
स्लाइड साझा करें
Jio Financial Services Q2 FY27 & H1 FY27 Earnings Presentation (October 15, 2026) — a 32-page quarterly results deck from Jio Financial Services Limited (JFSL), filed with the Indian stock exchanges (BSE/NSE), covering the quarter ended September 30, 2026 (Indian FY27 runs April 2026 to March 2027). It walks through group-wide growth across lending, payments, payments banking, insurance broking, asset management and reinsurance, the JioFinance app, the BlackRock, Allianz and Bank of America partnerships, and full consolidated, standalone and Jio Credit financial statements in ₹ crore.
प्रत्येक स्लाइड पृष्ठ का विस्तृत दृश्य, लेआउट, मुख्य सामग्री और दृश्य तत्वों सहित।
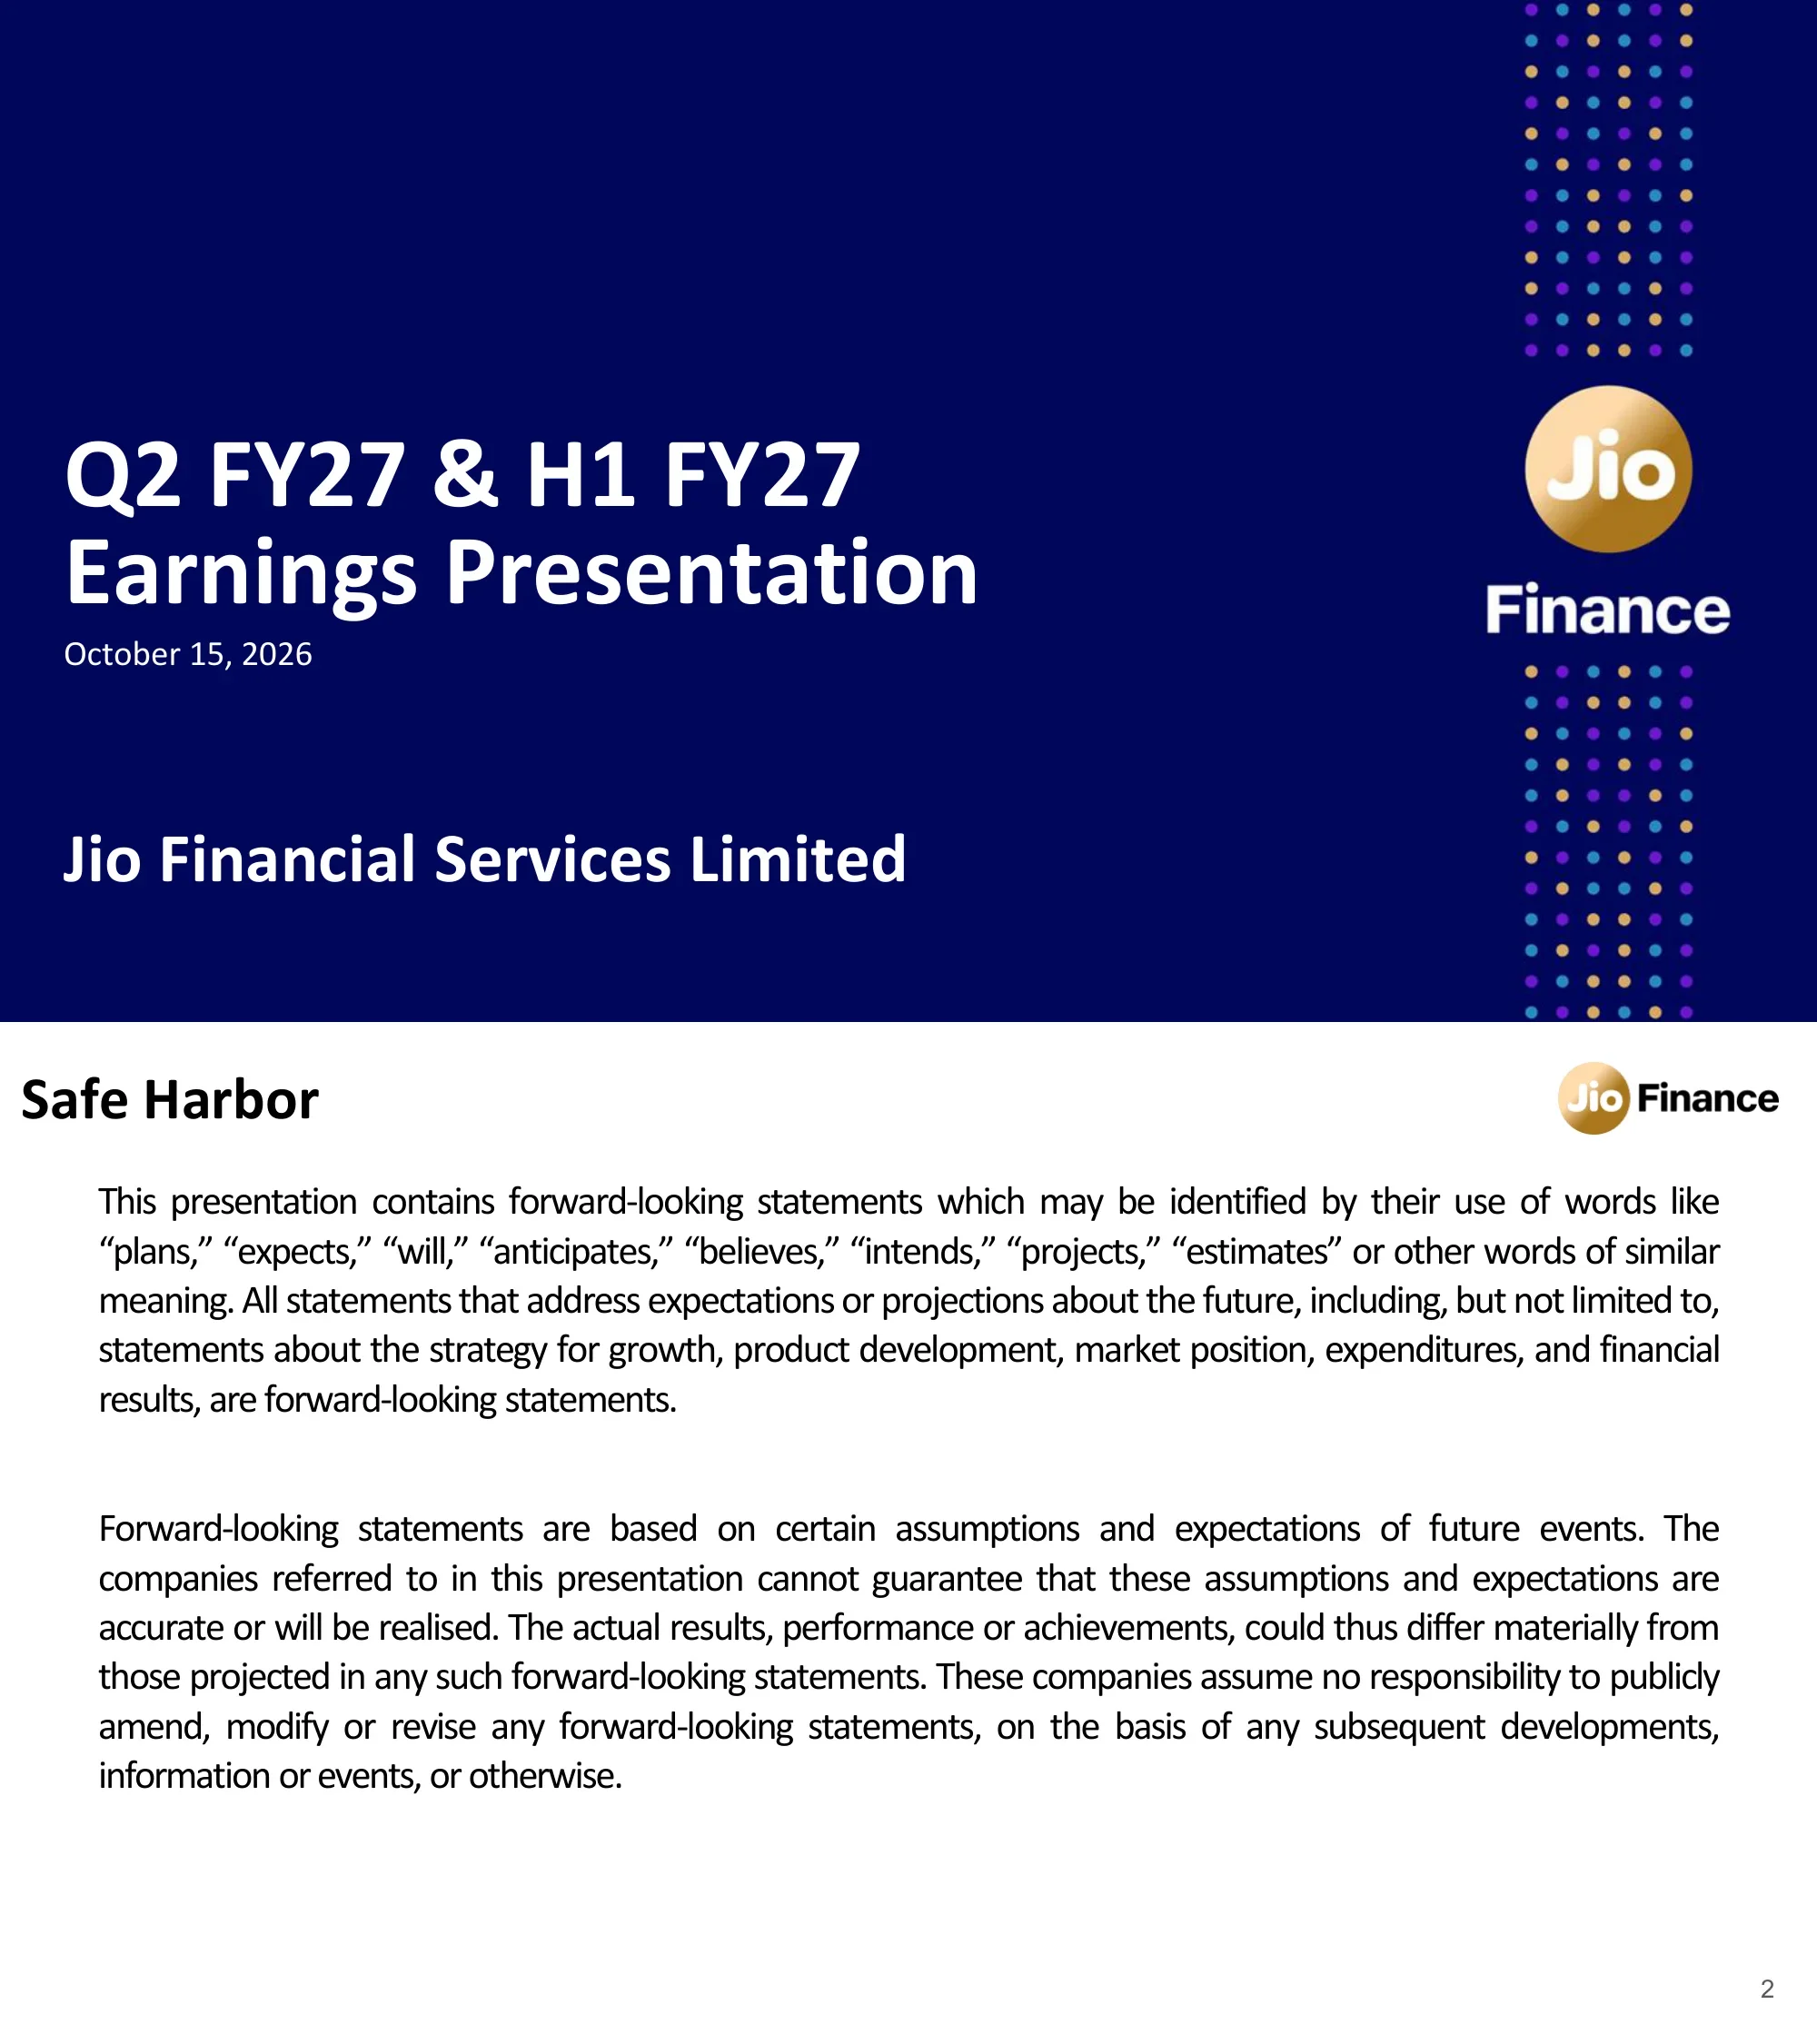
Cover slide titled 'Q2 FY27 & H1 FY27 Earnings Presentation', dated October 15, 2026, for Jio Financial Services Limited.
Full-bleed deep navy background; large white title left-aligned at mid-height with the date beneath and the company name lower; a vertical strip of multicoloured dots on the right with the gold Jio Finance logo in its centre.
Standard forward-looking statements disclaimer: statements using words like 'plans', 'expects', 'will', 'anticipates' are forward-looking, actual results may differ materially, and the companies assume no responsibility to revise them.
White slide with bold black title top-left, logo top-right, and two justified paragraphs of body text.
Six-panel KPI dashboard comparing Q2 FY26, Q2 FY27 and Q1 FY27 (₹ crore): NBFC gross AUM 14,709 → 37,320 (+154%); payments bank deposits 421 → 643 (+53%); payment solutions TPV 13,566 → 14,682 (+8%), Q1 FY27 19,208; insurance premium facilitated 347 → 346; AMC closing AUM 14,515 → 22,746 (+57%); reinsurance premium underwritten 0 → 244 (Allianz Jio Reinsurance began operations in March 2026).
2×3 grid of small bar charts, each with a bold heading over a purple rule, three gold-gradient bars, a dashed separator before the Q1 FY27 bar and a growth arrow with percentage; footnotes along the bottom.
Consolidated ex-dividend results: total income ₹733 → ₹1,699 crore (+132% YoY), H1 ₹1,353 → ₹3,195 crore (+136%); PPOP ₹310 → ₹574 crore (+85%), H1 ₹676 → ₹1,079 crore (+60%); PBT ₹325 → ₹489 crore (+51%), H1 ₹715 → ₹951 crore (+33%). Notes full consolidation of Reliance Services & Holdings (RSHL) as a 100% step-down subsidiary from April 29, 2026, NBFC PAT up 140% to ₹120 crore, and total consolidated shareholders' equity of ₹1.3 lakh crore as of September 30, 2026.
Three bar-chart panels (income, PPOP, PBT), each split into a quarterly section and a beige-shaded H1 section; a beige callout box with three bullets and a brown banner stating total equity.
Quarter milestones: JioFinance app unveiled JioFinance+ (value-back subscription) and JioFinance360 (financial assessment and advisory tool) and launched JioSilver; JioBlackRock Broking launched a self-directed investing platform with an introductory zero-brokerage plan; JioBlackRock AMC added a Nifty 50 ETF, a Balanced Advantage Fund and the Prism Hybrid Long-Short SIF; Bank of America agreed a JV to acquire up to 49.9% of Jio Credit in August 2026. 3.2 crore unique users across all digital properties.
Left purple-gradient panel with a phone mockup of the JioFinance app and a large '3.2 Cr' stat; right side has four rows, each a purple circular icon plus text, separated by dashed pink lines.
Ecosystem map in four quadrants around the Jio Finance Platform and Service Limited (JFPSL) app: Invest (BlackRock JVs for asset management, wealth management and broking), Borrow (Jio Credit Limited), Transact (Jio Payments Bank, Jio Payment Solutions) and Protect (Jio Insurance Broking, Allianz JVs for reinsurance, general and life). Entities are marked as growth phase (green) or incubation phase (yellow). Below, five structural moats: brand strength, strong capital base, zero tech-debt, cost engineering at scale and late-entrant advantage.
Large rounded beige frame divided into four quadrants with a central circle holding a phone mockup; a lavender band below with five pill-shaped moat badges with purple icons; a colour legend at the bottom.
Three partner cards: BlackRock (over USD 15 tn AUM, 40+ markets) for asset management, wealth management and broking; Allianz (135+ years, ~70 countries, ~9.7 crore customers, EUR 186.9 bn business volume in 2025) for reinsurance, general and health insurance and life insurance; Bank of America (USD 3.4 tn total assets, 35+ countries) for lending. Banner: JFSL emerges as preferred partner for global institutions looking to tap the India growth story.
Three tall rounded cards side by side, each with a partner logo, a description and a purple band naming the business line; a full-width purple banner below and footnotes.
Three-layer product stack: Layer 1 proprietary products (Borrow: HL, LAP, LAMF, LAS, LAETF; Invest: MF, ETF, SIF, Savings Pro, Wealth Checkup, Smart Switch, Broking; Transact: UPI, CASA, biometric payments; Protect: reinsurance, general and life insurance to be launched); Layer 2 marketplace aggregation (personal loans, credit cards, fixed deposits, Jio Gold, Jio Silver, insurance, tax filing); Layer 3 the core pivot to a customer-first, AI-native, conversational, N=1 hyper-personalised interface.
Stacked 3D platform layers (gold base, beige middle, purple top) on the right, a tall navy upward arrow on the left with a caption for each layer.
Distribution channels: JioFinance, MyJio and web portals as the main digital acquisition engine; Jio Credit in 19 cities with 26 offices; JioBlackRock AMC partnering with 15,000+ distributors; Jio Payments Bank BC network scaled to 633,000+ from ~200,000 in Q2 FY26; Jio Payment Solutions merchant network across 26 states with AI-enabled onboarding and an automated Deal Negotiator. Banner: financial access across 19,000+ PIN codes.
Large circular image of a gold network map of India on the left; five rounded-rectangle rows cascading to the right, each with an icon and one line of text; purple banner at the bottom.
AI and automation metrics across four areas. Business operations: JPBL customer engagement email automation 57% → 87%, merchant payment settlement automation 44% → 89%, B2B partner settlement and JCL debt collection 100% automated/digitised. Customer experience: 59% conversion via AI/ML hyper-personalisation, merchant onboarding TAT cut from 24 hours to under 2 hours. Risk: fraudulent email detection 53% → 78%, complaint-handling automation 72% → 78%. Growth: 172% conversion improvement from cohort-led campaigns, +59% microsite and +36% website leads from JCL SEO.
Gold header banner with a mission statement; four purple column headers; a grid of white cards, each showing a large before → after metric in grey and purple with a caption.
Jio Credit gross AUM ₹14,709 → ₹37,320 crore (+154%), disbursements ₹6,624 → ₹13,135 crore (+98%). AUM mix: mortgages 44.5%, retail loans against securities 11.3%, corporates and SMEs 44.2%; disbursement mix 26.1% / 20.0% / 53.9%. Mortgage average ticket ₹1.4 crore and tenor 15.9 years; retail LAS ticket ₹1.3 crore and tenor 3 years; corporate and SME tenor 3.26 years.
Two bar charts top-left, two horizontal 100% stacked bars below with a legend, and a right-hand beige panel holding three product cards with brown icons; purple banner at the bottom.
Borrowings ₹12,006 → ₹42,007 crore (+250%); borrowing mix in Q2 FY27 of 50% bank loans, 22% NCDs and 28% CP/ICD/B-TREPS; capital adequacy ratio 31.41% → 18.50% (22.35% in Q1 FY27); average cost of borrowing 7.08% vs 7.07% in Q1 FY27; total shareholders' equity ₹7,379 crore at September 30, 2026.
Three charts in a row (bar chart, 100% stacked columns, bar chart), two rounded stat cards below and a purple banner.
Jio Credit profitability: net interest income ₹140 → ₹302 crore (+116%), pre-provision operating profit ₹80 → ₹201 crore (+151%), profit after tax ₹50 → ₹120 crore (+140%); Q1 FY27 figures 257, 154 and 96. Banner: operating leverage from AUM expansion and scale-based cost efficiencies.
Three equal-width bar-chart panels with purple underlined headings and YoY growth arrows; purple banner at the bottom.
Total income ₹30 → ₹94 crore (+213%); CASA customers 29.0 → 40.0 lakh (+38%); customer deposits ₹421 → ₹643 crore (+53%); BC network 200,313 → 633,030 (3.2x). Average balance per customer ₹1,573 (+14% YoY); 20 toll plazas and 2 MLFF operational; regulatory approvals for a 3-in-1 savings account and Banker to an Issue for public issues including IPOs. A Forbes 2026 World's Best Banks badge sits beside the title.
Four bar charts across the top, three rounded stat cards beneath, purple banner and footnotes.
TPV ₹13,566 → ₹14,682 crore (+8%), gross fee and commission income ₹76 → ₹130 crore (+70%), net fee and commission income ₹12 → ₹21 crore (+74%). Product launches: Tap-and-Pay on POS for UPI and RuPay, cross-border collections in 100+ currencies with T+2 settlement, dynamic currency conversion pre-auth, a unified subscription hub, and pre-payment pages, static links and in-chat payments. Net processing margin 14 bps vs 9 bps a year earlier; net fee and commission per employee up 2x YoY.
Three bar charts across the top; a 'Product Launches' bullet panel with a gold header bottom-left; two stat cards on the right; purple banner.
JioFinance app product suite in four quadrants — Borrow (home loan, LAP, loans against shares/MFs/ETFs, 71 credit-card variants from 16 brands, personal loans from 11 partners), Invest (mutual funds, wealth management, broking, fixed deposits from 7 partners, Savings Pro, Jio Gold, Jio Silver), Transact (tax filing, UPI, CASA, biometric and split payments), Protect (94 plans from 23 insurers). Q2 FY27 highlights: Jio Gold purchase transactions +199% YoY, tax filings +40% YoY, FD GMV +50% QoQ, 25% higher products per customer among JioPoint users, 34 crore+ points issued to 77 lakh customers. 3.2 crore unique users, ~80 lakh average MAU, ~36,000 products purchased daily.
Four rounded quadrant cards with gold headers around a central app icon; a beige highlights column on the right with five stacked stat cards; three purple-outlined stat cards along the bottom.
Three signature offerings: JioPoints (loyalty framework, points redeemable across 110+ brands), JioFinance+ (value-back membership sharing platform commission as cash valueback, extra Jio Gold and Silver and accelerated points; launched for a closed user group in October 2026) and JioFinance360 (holistic financial fitness score across spending, borrowing, wealth, insurance and tax, with AI-driven recommendations; launching shortly).
Purple banner under the title; three columns, each with a phone screenshot above a gold-bordered card containing a heading and three bullets.
Asset management: closing AUM ₹14,515 → ₹22,746 crore (+57%), quarterly average AUM ₹12,890 → ₹22,769 crore (+77%); regular plans launched; liquid fund ranked #1 since inception (QAAUM ₹10,000 crore+); SIF AUM ₹478 crore within 3 months; GIFT City fund launching in Q3 FY27; ~800 institutional and 12 lakh retail investors covering 90% of PIN codes, 40% retail AUM from B30 cities, 18.6% new-to-mutual-fund investors. Wealth management: free Aladdin-powered wealth check-up, advice from ₹350/yr, Smart Switch. Broking: JioBlackRock Trade & Invest app live on Android and iOS, zero-brokerage plan.
Gold 'Asset Management' header with two bar charts and a bullet list; three stat cards; a purple banner; then two columns for Wealth Management and Broking with brown headers and bullet lists.
Reinsurance: ₹510 crore gross written premium in the first six months of operations, expanded surety participation, focus on nation-building risks such as semiconductors, data centres and battery energy storage. General insurance: Jio Allianz General Insurance in advanced stages of regulatory approval. Life insurance: non-binding agreement in place to set up a life insurance JV in India.
Two columns with gold header bars; each item is a white rounded card with a beige folded-corner icon tab.
Total premium facilitated ₹347 → ₹346 crore (Q1 FY27 ₹238 crore); total fee and commission income ₹37 → ₹54 crore (+46%). Premium mix shifted to 21% retail and 79% corporate from 9% / 91%. Direct-to-customer conversion up 55% QoQ across 200+ journeys; institutional originations drove 35% growth in account acquisitions and renewals; digital POSP premium up ~7x YoY across 42 motor, health and term policies.
Two bar charts top-left, a horizontal stacked mix chart beneath, three channel cards on the right, purple banner and footnote.
Section divider introducing the financial statements.
Full navy background with white section title on the left and the vertical dot-matrix band on the right.
Consolidated P&L (₹ crore): interest income 1,258 (+221% YoY); total income 1,699 (+132% YoY, +14% QoQ); finance cost 578; total expenses 1,125; PPOP 574 (+85%); provisions 41; dividend income nil vs 269 a year earlier; share of associates and JV −44; profit before tax 489 (−37% YoY); PAT 340 vs 695 in Q2 FY26 and 830 in Q1 FY27. H1 FY27 total income 3,195, PPOP 1,079, PAT 1,171 vs 1,020 in H1 FY26.
Full-width table with a gold header row, columns for Q2 FY26, Q1 FY27, Q2 FY27, % YoY, % QoQ, H1 FY26 and H1 FY27; subtotal rows bolded with beige shading; current-period columns tinted.
Consolidated balance sheet (₹ crore), March 31, 2026 vs September 30, 2026: cash and bank 3,598 → 12,459; investments 133,089 → 130,348; loans 25,711 → 37,493; total assets 163,497 → 181,666; net worth 133,854 → 129,596 (equity share capital 6,353 → 6,603); other liabilities 29,643 → 52,070.
Centred three-column table with a gold header, Assets and Liabilities sub-headers, italic sub-rows and bold totals; the latest column tinted beige.
Standalone JFSL P&L (₹ crore): interest income 154 (Q2 FY26: 7); total income 233 (+73% YoY); total expenses 59; PPOP 174 (+132%); dividend income 445; profit before tax 615; PAT 575 (+26% YoY, +447% QoQ). H1 FY27 PAT 681 vs 528.
Same table format as the consolidated P&L with quarterly, YoY, QoQ and H1 columns.
Standalone balance sheet (₹ crore): cash and bank 1,028 → 3,102; investments 28,094 → 30,993; loans 224 → 1,459; total assets 29,436 → 35,657; net worth 29,305 → 35,521; other liabilities 131 → 136.
Centred two-period balance sheet table matching the consolidated layout.
Jio Credit P&L (₹ crore): interest income 900 (+202% YoY); finance cost 599; net interest income 302 (+116%); net total income 322; total expenses 121; PPOP 201 (+151%); provisions 41; profit before tax 160; PAT 120 (+140% YoY, +24% QoQ). H1 FY27 NII 559, PPOP 355, PAT 216.
Full-width P&L table with quarterly, YoY, QoQ and H1 columns, shaded subtotal rows.
Jio Credit balance sheet (₹ crore): investments 3,027 → 11,893; loans 25,711 → 37,493; total assets 29,580 → 50,337; net worth 7,163 → 7,379; borrowings and debt securities 21,768 → 42,007; other liabilities 649 → 951.
Centred two-period balance sheet table with an extra borrowings row.
Closing slide reading 'Thank you'.
Navy background with white text on the left and the dot band with Jio Finance logo on the right, mirroring the cover.
Investor relations contacts: Mr. Dipak Daga, Group Chief Strategy Officer and Chief Investor Relations Officer, and Mr. Rishabh Rathod, Investor Relations; email investor.relations@jfs.in and website www.jfs.in.
Navy background, white heading and two columns of names and titles, contact lines below, logo band on the right.
Section divider introducing the annexure on group structure.
Navy background, white title left, dot-matrix band right.
Org chart of JFSL, a listed core investment company acting as group holding company, with 100% subsidiaries: Jio Credit (NBFC, RBI), Jio Insurance Broking (IRDAI), Jio Payment Solutions (payment aggregator, RBI), Jio Payments Bank (RBI), Jio Finance Platform and Service, Reliance Industrial Investments and Holdings (which owns Reliance Services and Holdings), Jio Leasing Services (50% of Reliance International Leasing IFSC, regulated by IFSCA) and Jio Alternative Investment Manager (Category II AIF, SEBI).
Tree diagram with a gold root box, connector lines, gold ownership-percentage badges and outlined child boxes with italic regulator captions.
JV ownership chart: 50/50 JVs with BlackRock — Jio BlackRock Asset Management and Trustee (SEBI), with 100%-owned Jio BlackRock International AMC (IFSC); Jio BlackRock Investment Advisers (wealth management) with 100%-owned Jio BlackRock Broking — and 50/50 JVs with Allianz: Allianz Jio Reinsurance and Jio Allianz General Insurance (IRDAI).
Tree diagram with JFSL at top and BlackRock and Allianz as gold partner boxes at the bottom, arrows and 50%/100% badges connecting to JV entity boxes; a dashed outline groups the asset-management entities.
इस स्लाइड और अंतर्निहित प्रस्तुति सामग्री के बारे में सामान्य प्रश्न।
It is the 32-page Q2 FY27 & H1 FY27 earnings presentation that Jio Financial Services Limited (JFSL) filed with the Indian stock exchanges (BSE and NSE) on October 15, 2026. It covers the quarter ended September 30, 2026 — Indian fiscal year FY27 runs from April 2026 to March 2027 — with segment results, strategy updates and full financial statements.
Per the deck, consolidated total income (ex-dividend) was ₹1,699 crore, up 132% YoY; consolidated PPOP was ₹574 crore, up 85%; reported consolidated PAT was ₹340 crore; NBFC gross AUM reached ₹37,320 crore, up 154%; and total consolidated shareholders' equity stood at ₹1.3 lakh crore as of September 30, 2026.
Jio Credit (NBFC lending), Jio Payments Bank, Jio Payment Solutions (payment aggregator), Jio Insurance Broking, the JioFinance app, the JioBlackRock joint ventures in asset management, wealth management and broking, and the Allianz joint ventures in reinsurance, general and life insurance, plus the Bank of America agreement to take up to 49.9% of Jio Credit.
Yes. The gallery page offers the original PDF and an editable PPTX version, so you can reuse the chart layouts, financial-statement tables and section dividers in your own presentation.
Yes. It follows a common investor-relations structure — cover, safe harbor, KPI dashboard, strategy, segment pages, financial statements, contacts and annexure — and uses one repeatable chart pattern (prior-year quarter, current quarter, prior quarter with a YoY arrow) that adapts to any listed company or fintech.
Deep navy cover and divider slides with a vertical multicoloured dot band and gold Jio Finance logo; white content slides with gold-gradient bar charts, purple underlined headings and a purple takeaway banner at the foot of most slides; and tables with a gold header row and beige-shaded subtotal rows.
Amounts are in Indian rupees, mostly in ₹ crore (1 crore = 10 million). Customer counts use lakh (100,000) and crore, and partner statistics for BlackRock, Allianz and Bank of America are in USD or EUR trillions or billions as the deck states them.
The presentation was filed with BSE and NSE as part of Jio Financial Services' quarterly disclosure and is available from the BSE corporate filings archive and the company's investor relations site, www.jfs.in.

Create Your Own Slides
Turn your ideas into professional presentations in seconds with 2slides AI.
पेशेवर डिज़ाइन का संदर्भ लें, अपनी शैली चुनें, और सही टेक्स्ट रेंडरिंग के साथ स्लाइड्स जेनरेट करें। Nano Banana द्वारा संचालित—अभी अपना प्रेजेंटेशन बनाना शुरू करें।
स्लाइड के लिए आपका AI एजेंट। बुद्धिमान प्रस्तुति निर्माण के साथ समय बचाएं, तेजी से चमकें।


© 2026 2slides। सभी अधिकार सुरक्षित।