
Intuitive Surgical Q2 2026 Investor Presentation
त्वरित नेविगेशन
टैग
स्लाइड साझा करें
Intuitive Surgical Q2 2026 Investor Presentation
प्रत्येक स्लाइड पृष्ठ का विस्तृत दृश्य, लेआउट, मुख्य सामग्री और दृश्य तत्वों सहित।
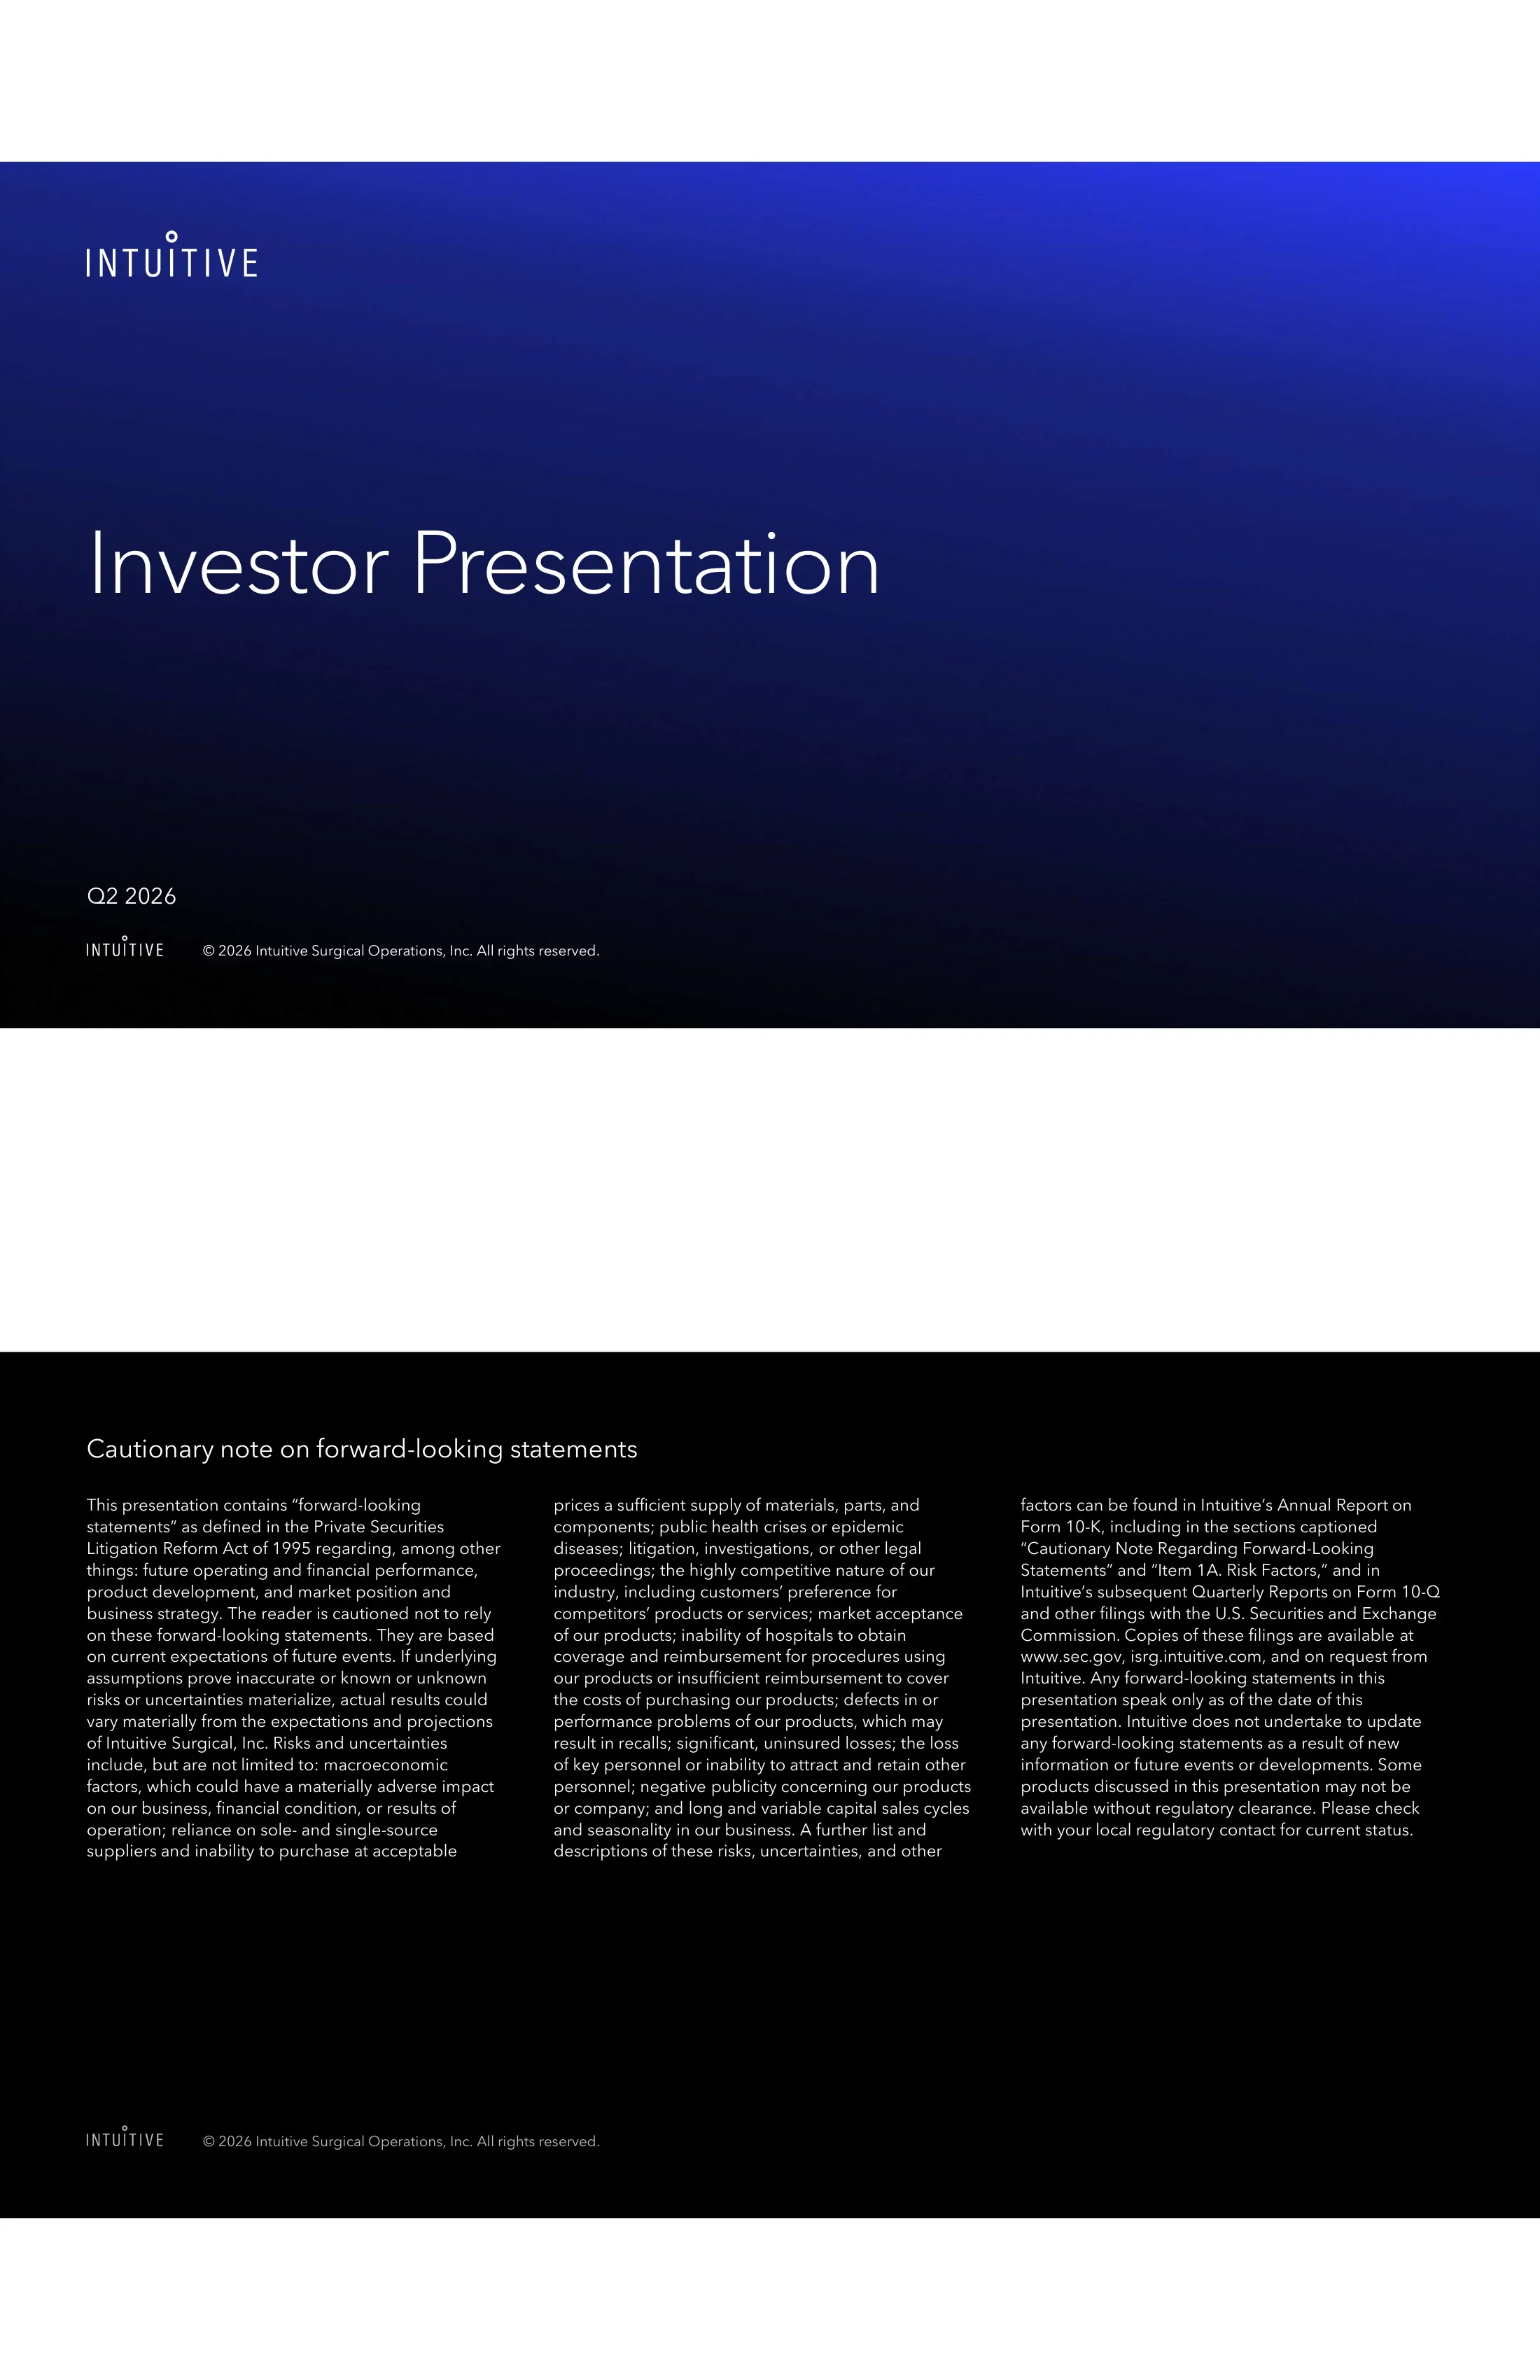
Cover slide titled 'Investor Presentation' with the period 'Q2 2026' and the Intuitive Surgical Operations copyright line.
Full-width navy-to-electric-blue gradient band (dark at bottom-left, bright blue at top-right); white INTUITIVE wordmark top-left, very large light sans-serif title left-aligned at mid-height, period label and small footer wordmark at bottom-left.
Standard safe-harbor disclaimer under the Private Securities Litigation Reform Act of 1995, listing risks such as macroeconomic factors, sole-source suppliers, litigation, competition, reimbursement, product defects and long capital sales cycles, and pointing to the Form 10-K and 10-Q filings at sec.gov and isrg.intuitive.com.
Solid black background with a white title top-left and dense white body text flowing across three equal newspaper-style columns; footer wordmark and copyright at the bottom.
Mission: minimally invasive care is life-enhancing care, and Intuitive expands the potential of physicians to heal without constraints. Vision: a future of care that is less invasive and profoundly better, where diseases are identified early and treated quickly. Value tags read Purpose, Value, Innovative, Commitment and Transformative.
Two-column layout on a warm light-grey background: left column stacks 'Our mission' and 'Our vision' headings (with italic key words) and body paragraphs; right side shows two overlapping photos, a rounded square of a surgeon's hands on robot controls and a circle of a family, with floating pill-shaped value labels.
Five customer value pillars, each with sub-metrics: Improve clinical outcomes (length of stay, complications, readmission and more), Enhance patient experience, Improve care team experience, Lower total cost of care, and Expand access to care.
Centered title over five equal columns; each column has a rounded-square portrait photo connected by a thin horizontal blue line running across the slide, a blue light-weight pillar heading and a black list of 3-5 focus areas.
3.2M+ procedures on Intuitive systems in 2025 and 20.4M+ to date; 1,900+ systems placed in 2025 and 12,000+ systems in hospitals globally (10,720+ Multiport, 370+ Single port, 990+ Ion); 4,000+ peer-reviewed articles published in 2025 and 48,000+ to date.
Three columns separated by thin vertical rules on a navy-to-blue gradient; each column has two oversized white numbers with captions, and the procedure and system figures sit above translucent blue pill bars splitting the total into Multiport, Single port and Ion.
System placements 2020-2025 split into greenfield/incremental and trade-in, rising from roughly 950 in 2020 to about 1,700 in 2025; da Vinci installed base by region (United States, Europe, Asia, Rest-of-world) grew to about 11,000 in 2025, a +12% YoY increase.
Two side-by-side stacked column charts on a pale blue-to-greige gradient: left chart in navy and light blue (greenfield vs. trade-in), right chart with four stacked regional segments in navy, royal blue, periwinkle and grey, with a large '+12% YoY' callout at top-right.
Annual revenue 2017-2025 (USD millions) split into recurring and non-recurring, reaching about $10 billion in 2025 (+21% YoY); the recurring share climbs from 71% in 2017 to 84% in 2025. Side notes list approximate prices: $0.6M-$3.1M per da Vinci system, $900-$3,700 in instruments and accessories per procedure, $95K-$225K per year in services, and fixed-payment or usage-based operational leases.
Wide stacked column chart (navy recurring base, light blue non-recurring top) with a percentage label and step line marking the recurring share beside each bar, a '+21% YoY' callout above 2025, and a right-hand text column of four bold blue headings with price ranges.
Section divider introducing the da Vinci robotic surgical platforms, showing four da Vinci patient-side systems in a row.
Dark teal-navy background with a thin white rounded-rectangle frame; white title on the left and a lineup of four white da Vinci robot renders on the right, the last breaking out of the frame edge.
Multi-port procedures grew 17% YoY to 3.0M+ in 2025 (from 1.2M+ in 2020); installed base grew 12% to 10.7K+ (from 5.9K+); utilization grew 3% to 300+ procedures per system (from 210+).
Three white rounded cards on a greige background, each with a bold label, a large colored growth percentage, 'YoY Growth' caption and a six-bar 2020-2025 column chart annotated with start and end values; bars are royal blue, periwinkle and teal respectively.
Da Vinci 5 has clearances in the U.S., Korea, Japan and Europe, with 270,000+ procedures performed to date, 1,200+ systems installed globally, 10,400+ surgeons using it and 11% higher utilization than Xi (Q4 2025 U.S. estimate), as of December 2025.
Three-zone layout on a soft light-blue to peach gradient: large black headline and subheading on the left, a close-up render of the da Vinci 5 surgeon console viewer in the center, and a right column of four blue stats separated by thin rules.
Single-port procedures grew 87% YoY to 55K+ in 2025 (from 5K+ in 2020); installed base grew 39% to 370+ (from 60+); utilization grew 29% to 180+ (from 110+).
Same three-card KPI template as the Multi-port slide: white rounded cards on greige, each with a large growth percentage and a 2020-2025 bar chart showing steep late-period growth.
Section divider for Ion, Intuitive's robotic endoluminal system, shown as a render of the robotic arm, flexible catheter and touchscreen controller.
Dark navy background with the thin white rounded frame used on other dividers; single-word white title on the left and a large product render with cyan light rings filling the right half and extending beyond the frame.
Ion procedures grew 51% YoY to 140K+ in 2025 (from 1K+ in 2020); installed base grew 24% to 990+ (from 30+); utilization grew 9% to 160+ (from 80+).
Three white rounded KPI cards on greige (procedures, installed base, utilization) with large growth percentages and 2020-2025 bar charts, matching the da Vinci platform slides.
Section divider introducing the Q2 2026 quarterly results.
Full-bleed navy-to-electric-blue gradient identical to the cover, with a large white left-aligned title and footer wordmark.
Operating metrics: 15% da Vinci procedure growth Y/Y, 12% da Vinci installed base growth Y/Y and 468 da Vinci systems placed. Financials: $2.89 billion revenue (+19% Y/Y), 70.0% non-GAAP gross margin and $2.80 non-GAAP EPS.
Two large white rounded cards side by side on a pale blue-to-greige gradient; each card stacks three big blue numbers with black captions, operating KPIs on the left and financial KPIs on the right.
11,710 da Vinci systems installed worldwide as of June 30, 2026: 6,615 in the United States, 2,325 in Europe, 2,111 in Asia and 659 in the Rest of World.
Faint white world map across a pale blue gradient; a large navy total inside square brackets at the center, connected by thin lines to two solid royal-blue panels on the left (US, Europe) and right (Asia, Rest of World) with white numbers.
Theme 'Accelerate access to and quality of minimally invasive care' with four priorities: 01 Platform growth (global expansion of da Vinci 5, SP and Ion), 02 Procedure adoption (training, commercial and market access), 03 Quality and manufacturing (industrial scale and operations), 04 Innovation to reach more patients (early-stage R&D for new disease states).
Left column with black title and blue subtitle; right two-thirds hold a 2x2 grid of frosted white rounded cards, each with a large black numeral (01-04), a blue heading and a short black description.
States that outcomes-focused innovation to enhance physician and care team performance and improve patient outcomes is core to Intuitive's business and aligned with its environmental sustainability, social responsibility and governance work, with a link button to the 2025 Corporate Impact Report.
Full-bleed aerial photo of people on a green lawn; a centered frosted-glass translucent panel holds a large white serif title and body text, with a royal-blue pill button below it.
Closing brand slide with the INTUITIVE wordmark and no other text.
Navy-to-electric-blue gradient matching the cover, with the white wordmark centered.
इस स्लाइड और अंतर्निहित प्रस्तुति सामग्री के बारे में सामान्य प्रश्न।
The 19-page deck covers a forward-looking statements disclaimer, mission and vision, five customer value pillars, company-wide scale metrics, worldwide capital and revenue trends, KPI dashboards for da Vinci Multi-port, da Vinci 5, da Vinci SP and Ion, Q2 2026 results, the regional da Vinci installed base, 2026 priorities and a Corporate Impact slide.
The results slide shows $2.89 billion in revenue (+19% Y/Y), 70.0% non-GAAP gross margin, $2.80 non-GAAP EPS, 15% da Vinci procedure growth, 12% da Vinci installed base growth and 468 da Vinci systems placed. A separate slide puts the worldwide da Vinci installed base at 11,710 systems as of June 30, 2026.
It opens with a cover and disclaimer, moves into purpose and customer focus, then scale and financial trends, followed by two product chapters (Da Vinci platforms and Ion), each opened by a dark section divider slide. It then covers Q2'26 results, 2026 priorities and corporate impact, and ends on a closing wordmark slide.
Reuse one chart template for every product line (three rounded cards showing procedures, installed base and utilization, each with a big growth percentage and a mini bar chart). Keep the palette to navy, royal blue, periwinkle and teal. Switch between dark gradient section dividers and light data slides. Put a source footnote on every data slide.
It uses stacked column charts for system placements (greenfield vs. trade-in), regional installed base and recurring vs. non-recurring revenue, plus mini bar charts on the KPI cards. It also has a world-map layout for the regional installed base and big-number stat layouts with segmented pill bars that split totals into Multiport, Single port and Ion.
The PDF pages are landscape 4:3 (792x612 points). The slide artwork itself is a 16:9 band centered on each page, with white margins above and below.
Yes. The gallery page offers the original PDF and an editable PPTX. The PPTX was machine-converted from the PDF, so check layouts, fonts and charts after opening it and adjust them if needed.
It was published by Intuitive Surgical on its investor relations website, isrg.intuitive.com. It is provided here for reference and design study, not as investment advice.
Official investor relations site where the Q2 2026 investor presentation is published.

Create Your Own Slides
Turn your ideas into professional presentations in seconds with 2slides AI.
पेशेवर डिज़ाइन का संदर्भ लें, अपनी शैली चुनें, और सही टेक्स्ट रेंडरिंग के साथ स्लाइड्स जेनरेट करें। Nano Banana द्वारा संचालित—अभी अपना प्रेजेंटेशन बनाना शुरू करें।
Your AI Agent for slides. Save time, shine faster with intelligent presentation creation.




© 2026 2slides. All rights reserved.