
इस संग्रह का हिस्सा: निवेशक प्रेज़ेंटेशन के उदाहरण
Constellation Energy Q3 2026 Earnings Presentation is the English-language slide deck Constellation Energy published on its investor relations site for its third quarter 2026 earnings conference call on 9 November 2026, with amounts in US dollars. It covers Q3 results, raised full-year Adjusted Operating Earnings guidance, nuclear long-term agreements and the Peak+ product, capital allocation, and a modeling and reconciliation appendix.
आपके अपने कंटेंट से बनी स्लाइड्स के लिए इस प्रेज़ेंटेशन के कवर को स्टाइल रेफ़रेंस के रूप में इस्तेमाल करता है। या नीचे से कोई भी पेज चुनें और उसके लेआउट को रेफ़रेंस की तरह इस्तेमाल करें।
त्वरित नेविगेशन
टैग
स्लाइड साझा करें
Constellation Energy Q3 2026 Earnings Presentation is the English-language slide deck Constellation Energy published on its investor relations site for its third quarter 2026 earnings conference call on 9 November 2026, with amounts in US dollars. It covers Q3 results, raised full-year Adjusted Operating Earnings guidance, nuclear long-term agreements and the Peak+ product, capital allocation, and a modeling and reconciliation appendix.
प्रत्येक स्लाइड पृष्ठ का विस्तृत दृश्य, लेआउट, मुख्य सामग्री और दृश्य तत्वों सहित।
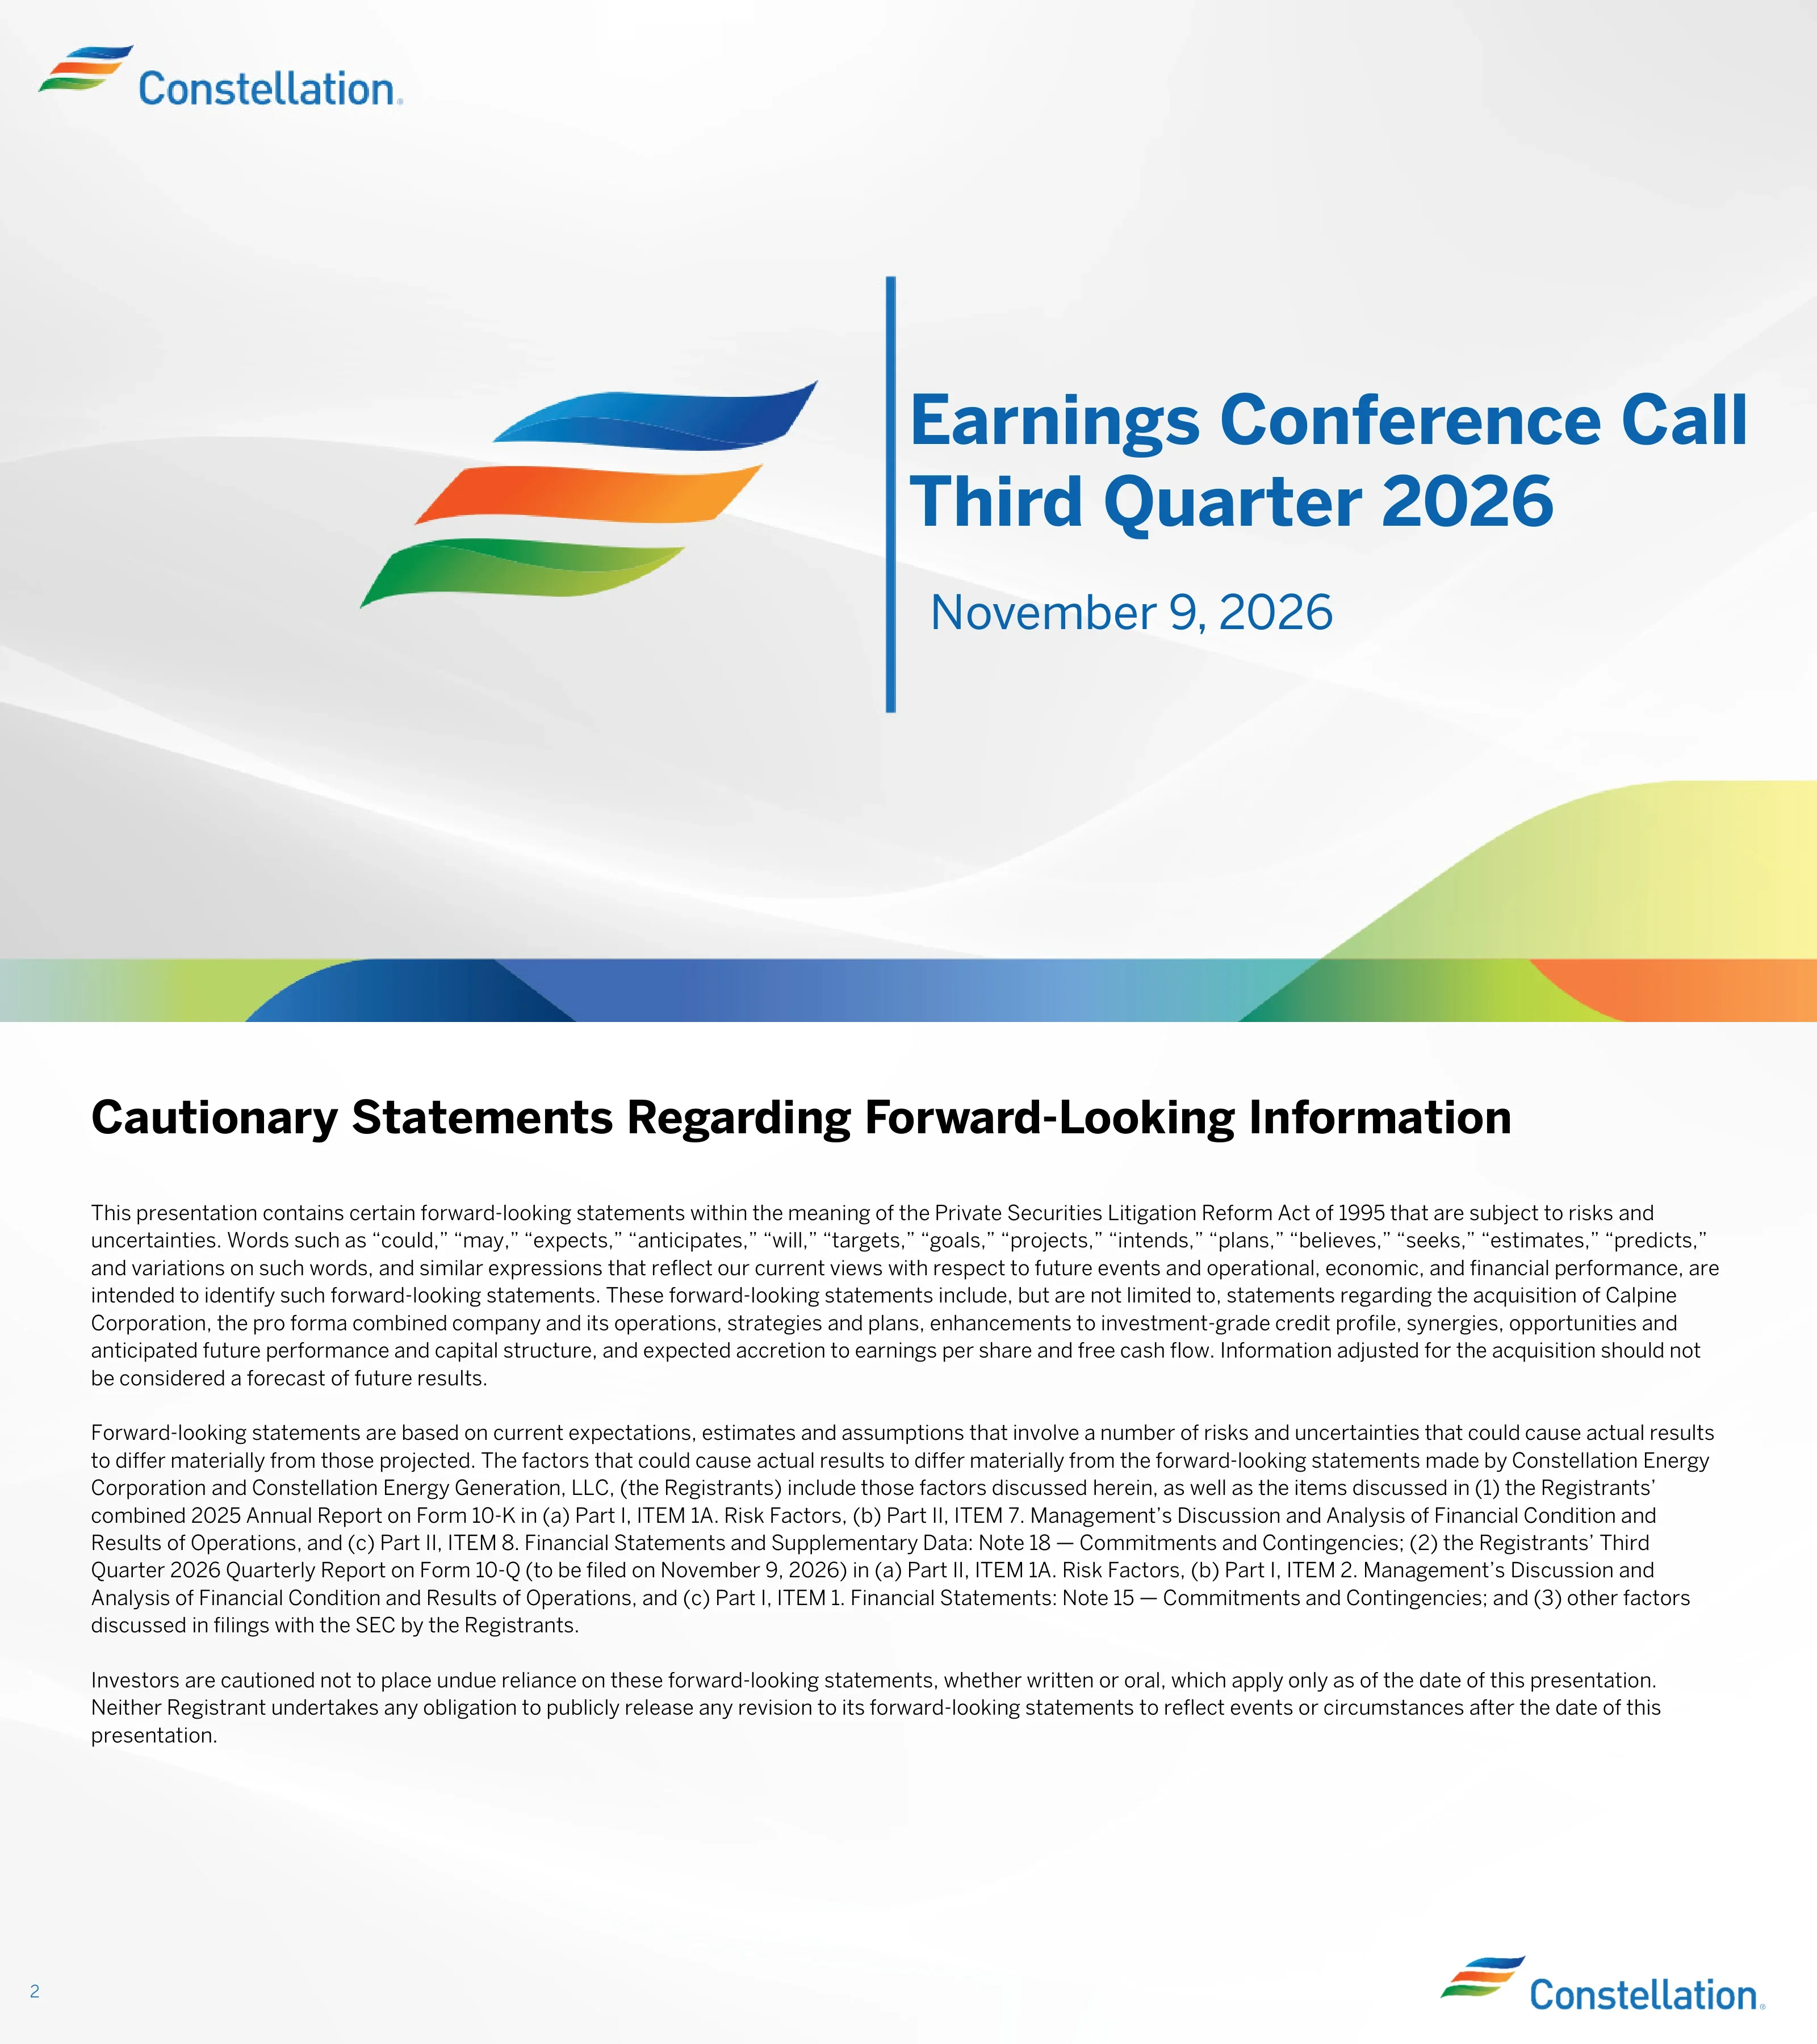
Title slide for Constellation's Earnings Conference Call for the third quarter of 2026, dated November 9, 2026.
Large tri-color wave logo at left of center, separated by a vertical blue rule from the title and date at right; small wordmark top left on a soft gray wave background.
Standard forward-looking statement disclaimer under the Private Securities Litigation Reform Act of 1995. It names the Calpine acquisition, pro forma combined company, synergies, credit profile and expected accretion as covered topics, and refers to the 2025 Form 10-K and the Q3 2026 Form 10-Q to be filed November 9, 2026.
Title at top and three dense paragraphs of body text; page number bottom left and logo bottom right.
Defines the non-GAAP measures used in the deck: Adjusted Operating Earnings, free cash flow before growth (FCFbG), adjusted gross margin and adjusted O&M, including what each excludes. It states that forward-looking non-GAAP guidance cannot be reconciled to GAAP because of fair value uncertainty.
Bulleted definitions with bold italic terms and indented sub-bullets, followed by a closing paragraph.
Explains why management uses non-GAAP measures: to assess performance, allocate resources, set incentive compensation and plan. Notes they are not GAAP-defined, may not be comparable across companies, are marked with an asterisk, and are reconciled in the appendices.
Title and three short paragraphs at the top of an otherwise empty slide.
Q3 GAAP earnings of $5.19 per share and Adjusted Operating Earnings of $5.06 per share, with full-year Adjusted Operating Earnings guidance raised to $12.50 - $12.80. Highlights include about 4,560 MWs contracted with three customers in Q3 (about 270 MWs through Peak+), about 8,500 MWs of long-term agreements year to date, a 99.2% summer nuclear capacity factor, a $5.0B DOE loan commitment, about $3.0B deployed on share repurchases, and an agreement to acquire the 609 MW Rhode Island State Energy Center.
Grid of rounded callout boxes at left, with the two teal boxes on top for earnings and guidance, and a large rounded photo at right with a caption; footnotes below.
Expected generation from the clean baseload fleet supported by long-term agreements rises from 60 million MWhs in 2029 to 71 in 2030, 83 in 2031, 91 in 2032 and about 94 in 2040+. Long-term agreements support 45% of the clean baseload fleet by 2032. A pie chart shows 91% of customers supporting nuclear agreements are rated AA- or better and 9% BBB+ to A+.
Two-column layout with a bar chart on the left and a pie chart on the right, each under a teal heading, plus a callout box beneath each.
43 million annual MWhs have been signed since the March Business Update. Stacked bars of 2032 expected generation move long-term agreements from 48 to 91 million MWhs, with 113 million MWhs available; the current bar splits the remainder into NIHub 65, PJM-W 39 and ERCOT 9 (versus 86, 52 and 9 in March). A cost chart compares a new build CCGT LCOE of $110 - $130/MWh with a $20 - $50/MWh nuclear premium to the PTC floor. Three paths are listed: corporate, state and utility procurements; colocation and powered land; and Peak+.
Two charts across the top (stacked bars left, cost range chart right) and three rounded boxes in a row below.
Describes Peak+ as an integrated customer solution combining new capacity for peak demand growth with tailored energy products. It notes regulators focus on connecting large loads quickly without hurting reliability or raising costs, that historical CCGT capacity factor is about 60%, and that better use of capacity could save US households $110 - $170 billion over 10 years, citing Brattle.
Two stacked outlined boxes with a down arrow at left, and a tall rounded panel at right with three icon rows.
Q3 2026 GAAP net income was $5.19 per share versus $2.97 in Q3 2025, and Adjusted Operating Earnings were $5.06 versus $3.04. Drivers cited are the Calpine contribution, strong commercial performance and higher capacity revenue, partly offset by lower PTC revenue. Full-year guidance moved from $11.00 - $12.00 originally, to $11.50 - $12.50 previously revised, to $12.50 - $12.80 with a $12.65 midpoint, driven by commercial outperformance partly offset by higher O&M.
Left bar chart of Q3 results and right floating-range chart of guidance, each with a bulleted callout box beneath.
Q3 nuclear capacity factor was 97.2% with 20 planned refueling outage days completed. A combo chart shows quarterly TWhs (about 40 to 42) and capacity factor from Q3 24 to Q3 26. The slide states the nuclear fleet delivered strong reliability while PJM set peak load records this summer, citing EIA.
Bar and marker combo chart at left with dual axes, a teal banner and aerial photo of Calvert Cliffs at right, and footnotes below.
Long-term agreements enable 1,165 MWs of uprates at about $4.3B project cost, phased as 110 MWs in 2027-2028, 605 in 2029-2030 and 450 in 2031-2032. About $3.0B of incremental growth capital funds uprates from 2028 to 2032, with $1.3B already in 2026-2027 guidance. A $5.0B DOE conditional loan covers up to 80% of eligible costs, with a 30-year tenor at T+37.5 bps and potential pre-tax savings of $40M annually.
Waterfall-style bar chart at left and two outlined text panels with headings at right.
Capital management priorities are a strong credit rating (BBB+/Baa1 with $14.0B in credit facilities), contracted cash flow, a 2.00 - 2.25x Debt/EBITDA target and staggered maturities. A spread chart from Oct-23 to Oct-26 shows CEG 30-year spreads at +97 BPS and 40-year at +109 BPS versus a high yield index at +337 BPS in Oct-26. Constellation's 30-year new issue spreads have compressed by about 140 bps since 2023.
Top two-column table of priorities with an arrow to shareholder benefits, then a line chart across the bottom with a callout box at right.
A table lists base opportunities with earnings and FCFbG upside: 1 GW nuclear PPA ($0.40 - $1.00; $125M - $325M), 1 GW natural gas powered land ($0.20 - $0.50; $75M - $175M), natural gas capacity factor ($0.10 - $0.20), commercial margin ($0.10 - $0.30), PTC floor inflation at 3% vs 2% ($0.30; $100M) and capital allocation ($0.25 - $0.80+). Progress includes about 5,500 MW of premium agreements, the RISEC agreement, about $3.0B of repurchases year to date with about $2.0B remaining, and about 11 million shares repurchased.
Teal-headed table at left and a progress checklist with share repurchase tiles at right.
Three themes: strong 20%+ Base EPS growth from 2026 to 2029 (excluding upside from nuclear premium value, gas contracts and capital allocation), with a long-term target of rolling three-year Base EPS growth of 10%+; assets that cannot be replicated, with a new build cost of the roughly 55 GW fleet above 3x current enterprise value; and value from capital allocation, including a $5.0B buyback authorization and $3.9B of growth capital.
Three horizontal bands, each with a colored label block (blue, orange, green) at left and bullets in a rounded outline at right; logo mark at far left.
Section divider introducing the additional disclosures part of the deck.
Single centered bold title on a blank wave background.
Illustrative 2026 payoff for non-state-supported units. The PTC provides up to $15.00/MWh of support when revenues are between $26.00 and $44.75/MWh, and none above $44.75 (the $47.00/MWh case). At $35.00/MWh revenue the unit would receive $7.80/MWh PTC, for a total of $42.80/MWh, or $45.40/MWh on a tax-adjusted basis.
Line chart at left with a shaded support band and orange and green dashed lines, and four bullets at right.
The PTC runs through 12/31/2032, with a 2026 maximum of $15.00/MWh reduced by 80% of gross receipts above $26.00/MWh and phasing out after $44.75/MWh. Inflation adjustment uses the GDP price deflator relative to 2023. A table from 2026 to 2032 shows maximum PTC, price threshold and zero-PTC price under 2.0%, 2.5%, 3.0% and 3.5% scenarios, with Base EPS impacts versus the August outlook such as $1.25 for 3.0% and $1.55 for 3.5% in 2032.
Two overview columns with bullets and a formula on top, and a wide grouped table with a blue Base EPS Impacts block below.
As of 9/30/2026, total long-term debt is $19.5B: $14.5B at CEG and $4.9B at CPN, including $13.4B corporate and $6.0B subsidiary debt (figures as shown, may not sum due to rounding). A bar chart in $M shows maturities from 2026 to 2066, with the largest bars at $2,393M in 2031 and $1,950M and $1,397M around 2028-2029, split by CEG Sr. Notes, CEG tax-exempt bonds and CPN Sr. Notes.
Wide column chart by year across the slide with a summary table at top right and a legend below.
Section divider introducing the modeling slides.
Single centered bold title on a blank wave background.
Splits earnings into Base Earnings (60-70% of total) and Enhanced Earnings (30-40% of total). Base earnings rest on long-term contracts, available nuclear at the PTC floor assuming 2% inflation, minimum expected fossil earnings and 10-year weighted commercial margins. Enhanced earnings reflect forward prices above base assumptions, commercial margins above the 10-year average and volatility capture.
One stacked column at left (green over blue) with two outlined explanation boxes at right.
Base earnings of $6.65 - $6.75 in 2026, $7.60 - $7.70 in 2027 and $11.40 - $11.90 in 2029, a Base Earnings CAGR of about 20%. Enhanced earnings are about 40% of the total in 2026, 35% - 40% in 2027 and 30% - 35% in 2029. The 2029 projection includes announced nuclear and gas offtakes and PTC at 2% inflation, and excludes incremental deals, higher gas utilization, wider commercial margins and higher return investments.
Stacked bars for three years with a curved CAGR arrow above, and two include and exclude lists at right.
Defines the base gross margin categories: Contracted Clean (carbon-free contracted over 5 years), Available Nuclear (CMC units and remaining PTC units), Natural Gas and Oil, Wind/Solar/Hydro, Non-Nuclear Capacity and Commercial Margin, which includes other commercial margins of about $475M per year.
Two-column table with a teal header row, category names at left and bulleted details at right.
Quantities and prices for 2026 and 2027, including Illinois CMC units at 53 and 23 million MWhs, remaining units at 101 and 127 million MWhs ($44.75 and $45.75/MWh), contracted clean at 36 and 45 million MWhs ($70.00/MWh), gas spark spreads by region, capacity prices, commercial margins and nuclear fuel amortization of 179 and 184 million MWhs.
Small two-bar chart at left and a large two-year table at right with grouped rows and five footnotes.
Other base modeling inputs for 2026 and 2027 in $M: adjusted O&M of ($6,900) and ($7,025), TOTI of ($675), depreciation and amortization of ($1,825) and ($2,000), and tax rates of 26% / 26% and 25% / 26%. Enhanced tools show gross margin of $3,200 - $3,300 and $2,150 - $2,550. Reference prices as of 9/30/2026 include NIHub ATC of $42.88 and $43.59/MWh.
Single wide table with section header rows (base inputs, enhanced tools, additional information, reference prices) and six footnotes.
Five-year inputs for 2026 to 2030: Illinois CMC volumes of 53 and 23 million MWhs; remaining units of 101, 127, 148, 146 and 147 million MWhs with PTC prices from $44.75 to $49.88/MWh; contracted clean of 36 to 54 million MWhs at $70.00 rising to $88.00/MWh; total nuclear volumes of 179 to 190 million MWhs; and 13 to 15 planned refueling outages per year.
Boxed grid with a blue year header row and grouped row labels at left; footnotes below.
Cleared and committed capacity volumes and prices by market. PJM nuclear totals 15,550 MW for 2025/2026 and 2026/2027 and 15,525 MW for 2027/2028, with prices around $270, $329 and $333/MWd; MISO nuclear is 1,100 MW at $217 and $126; ISO-NE totals 2,225, 2,275 and 2,075 MW; CAISO net qualifying capacity is 5,925 MW (95%) in 2026. The slide notes these are not additive to Base Earnings.
Stacked tables by region (PJM, MISO, ISO-NE, CAISO) with year column groups and eight footnotes.
Section divider introducing the appendix with reconciliations of non-GAAP measures.
Centered bold two-part title on a blank wave background.
For the three months ended September 30, GAAP net income attributable to common shareholders was $1,835M ($5.19 per share) in 2026 and $930M ($2.97) in 2025. After adjustments including unrealized fair value of ($127M), Calpine merger and integration costs of $73M and income tax adjustments of ($108M), Adjusted Operating Earnings were $1,792M ($5.06) versus $952M ($3.04). Share counts were 354 million and 313 million.
Two-year table with per-share columns, a bold total row and six footnotes beneath.
Reconciles GAAP O&M of $7,850M (2026) and $7,775M (2027) to Adjusted O&M of $7,075M in both years, after adjustments for decommissioning-related activities, direct cost of sales, Calpine merger and integration costs of ($475M) and ($125M), and a CCEC settlement of ($50M) in 2026. Amounts are rounded to the nearest $25M.
Compact two-column table at upper left with a footnote block at the bottom.
Closing slide giving the investor relations email address (InvestorRelations@constellation.com) and a list of links: Events and Presentations, Reports & SEC Filings, Constellation Sustainability Report and Nuclear 101.
Contact and link list at left and a large rounded photo of a plant worker at right.
इस स्लाइड और अंतर्निहित प्रस्तुति सामग्री के बारे में सामान्य प्रश्न।
It is the English-language presentation Constellation Energy published on its investor relations site for its third quarter 2026 earnings conference call held on 9 November 2026. Amounts are in US dollars.
The deck shows GAAP earnings of $5.19 per share and Adjusted Operating Earnings of $5.06 per share for Q3 2026, compared with $2.97 and $3.04 in Q3 2025.
Full-year 2026 Adjusted Operating Earnings guidance is raised and narrowed to $12.50 - $12.80 per share, with a $12.65 midpoint, up from $11.50 - $12.50 previously and $11.00 - $12.00 originally.
The deck describes Peak+ as an integrated customer solution that combines new capacity for peak demand growth with tailored energy products. About 270 MWs were contracted through it in Q3.
In 2026 the PTC is up to $15.00/MWh, reduced by 80% of gross receipts above $26.00/MWh and fully phased out after $44.75/MWh. It runs through 12/31/2032 and is inflation-adjusted, with an example table across 2.0% to 3.5% inflation scenarios.
Slides 21 to 26 cover base earnings targets, margin definitions, quantities and prices, other modeling inputs and cleared capacity detail. Slides 28 and 29 give the GAAP to non-GAAP reconciliations.
Yes. It combines disclaimer pages, KPI callout grids, bar, pie, waterfall and line charts, dense footnoted tables and a closing contact slide in a consistent teal, blue, orange and green style.
Most are legible at slide size, though the smallest footnotes on the modeling and PTC table slides are tiny and should be checked against the original filing. The deck contains forward-looking statements and non-GAAP measures and is not investment advice.

Create Your Own Slides
Turn your ideas into professional presentations in seconds with 2slides AI.
पेशेवर डिज़ाइन का संदर्भ लें, अपनी शैली चुनें, और सही टेक्स्ट रेंडरिंग के साथ स्लाइड्स जेनरेट करें। Nano Banana द्वारा संचालित—अभी अपना प्रेजेंटेशन बनाना शुरू करें।
स्लाइड के लिए आपका AI एजेंट। बुद्धिमान प्रस्तुति निर्माण के साथ समय बचाएं, तेजी से चमकें।


© 2026 2slides। सभी अधिकार सुरक्षित।