
BCG AI at Work 2025 Survey - Workplace AI Adoption Insights (Japanese Edition)
त्वरित नेविगेशन
टैग
स्लाइड साझा करें
BCG AI at Work 2025 Survey - Workplace AI Adoption Insights (Japanese Edition)
प्रत्येक स्लाइड पृष्ठ का विस्तृत दृश्य, लेआउट, मुख्य सामग्री और दृश्य तत्वों सहित।
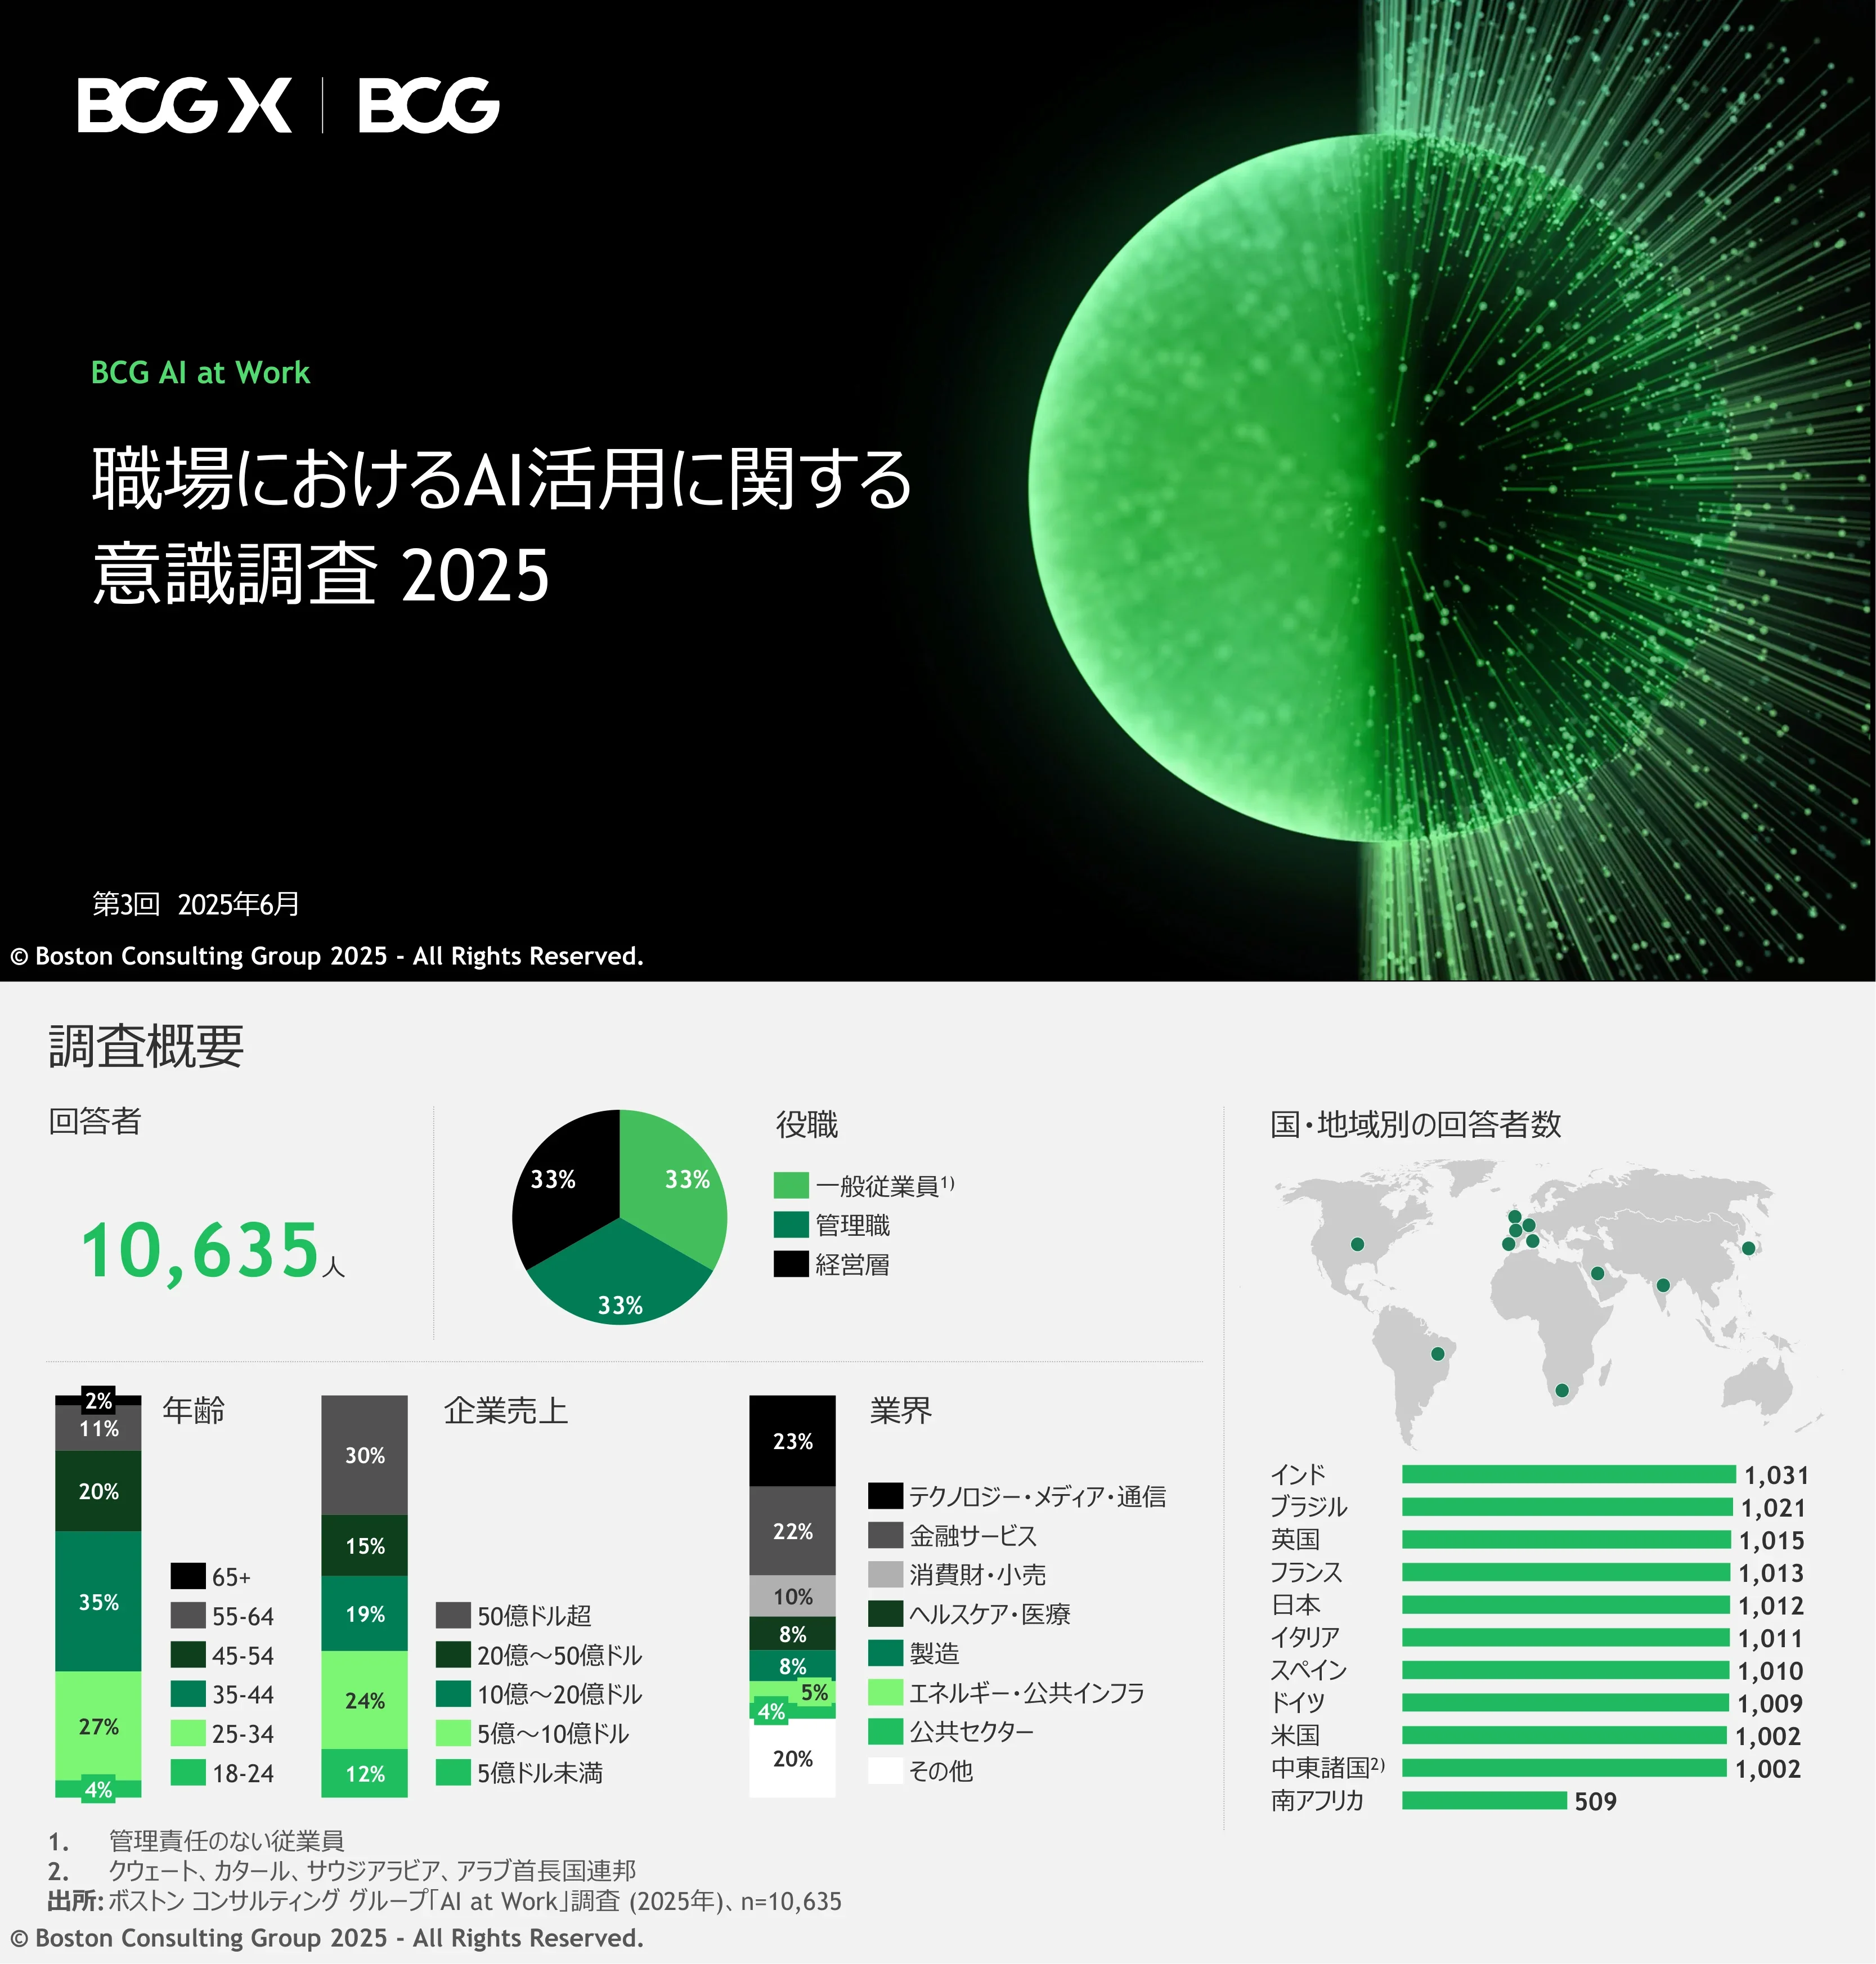
Title slide for BCG's third annual AI at Work survey, June 2025. Features BCG X and BCG logos with futuristic green data sphere visual.
Full-bleed dark background with centered title text and decorative 3D green sphere graphic on right
10,635 respondents across 12 countries. Breakdown by role (33% each: employees, managers, executives), age groups, company revenue, industry sectors, and country-level sample sizes.
Multi-chart dashboard layout with pie chart, stacked bar charts, horizontal bar chart, and world map with country data
Five key discoveries: (1) AI use is routine for 72% but stagnating among non-managers at 51%, (2) Training, tools, and leadership support are key enablers, (3) Global South AI adoption reaches record highs with India at 92%, (4) Focus shifting from adoption to value creation through organizational redesign, (5) AI agent adoption remains limited at only 13%.
Five-column layout with gradient green-to-gray color blocks, numbered 1-5
AI usage in work is becoming routine, but adoption among non-managerial employees is stagnating.
Full-screen dark green gradient background with centered white text
Comparing 2018, 2023, and 2025 data: optimism stable at 52%, interest peaked at 61% in 2023, confidence in effectiveness jumped +19pp to 36%, concerns dropped -12pp to 28%, anxiety stable at 11%.
Split layout: left side has key insight text on black background, right side has horizontal grouped bar chart with three time periods
Regular GenAI usage by role: Non-managers 51% (barely changed from 52% in 2024), Managers 78% (+14pp), Executives 85%. Non-manager adoption has plateaued while management usage surges.
Split layout: left black panel with key stat and insight text, right panel with horizontal grouped bar chart by role level
Weekly GenAI usage by country: India 92%, Middle East 87%, Spain 78%, Brazil 76%, South Africa 72%, UK 68%, Italy 68%, Germany 67%, France 64%, US 64%, Japan 51% (lowest). Global average 72%.
Vertical bar chart with countries on x-axis, dashed line for global average at 72%, light/dark green color coding for Global South vs North
41% of respondents believe their job will probably or definitely disappear in the next 10 years. Non-managers at 36%, but managers/executives higher at 43% (+7pp gap).
Split layout: left black panel with large 41% stat in green, right panel with three vertical bars comparing overall, non-managers, and managers/executives
Countries with highest GenAI usage also show highest job loss fears. Middle East 63%, Spain 61%, India 48%. Among Global North: Japan 40%, Germany 36%, Italy 36%. Brazil lowest at 27%.
Vertical bar chart with countries ordered by anxiety level, top-3 AI usage countries highlighted with circular badges showing their usage rates
47% save 6+ hours per week. Time savings redirected to: more tasks (54%), quality/speed improvement (52%), strategic work (44%), further AI experimentation (36%), expertise development (34%), colleague relationships (29%), wellbeing (29%), non-work activities (27%). Only 1/3 have clear guidance on reallocating saved time.
Split layout: left black panel with 47% stat, right panel with horizontal bar chart of time reallocation activities
Adequate training, appropriate tools, and leadership support are the three keys to promoting AI adoption.
Full-screen dark green gradient background with centered white text in quotation format
Three key barriers identified from non-manager responses: (1) Insufficient skills/training - only 36% received adequate AI transformation training, (2) Inadequate tools - 37% say company doesn't provide appropriate tools, 54% would use unauthorized AI tools, (3) Insufficient leadership support - only 25% feel adequately supported.
Three-row layout with icons, each barrier in a green-toned card with key statistics and explanations
Only 36% received sufficient AI training. Key training effectiveness factors: Duration (18% → 63% → 82% → 89% for none/1-5h/5-10h/10h+), Format (67% non-face-to-face vs 79% face-to-face, +12pp), Coaching (70% without vs 84% with coach, +14pp).
Complex dashboard: left side has donut chart showing 36% trained, right side has three grouped bar charts comparing training duration, format, and coaching impact
54% of respondents would use AI tools even without company approval. Gen Z and Millennials are 19pp more likely (62%) compared to others (43%). Shadow AI poses significant security risks.
Split layout with left green panel for key message, right side with donut chart (54%) and generational comparison squares
Among non-managers who received clear leadership support: AI daily use 82% vs 41% (+41pp), believe AI makes work enjoyable 55% vs 15% (+40pp), believe AI positively impacts career 62% vs 13% (+49pp). Only 25% of non-managers received such support.
Split layout: left panel with key 25% stat in green, right panel with three horizontal paired bar charts showing with/without support comparison
Restructuring workflows and organizational functions with AI to move from adoption to value creation.
Full-screen dark green gradient background with centered white text
Three stages of AI maturity: Adoption (72% have deployed GenAI tools), Redesign (50% are redesigning workflows end-to-end), Creation (22% are creating new AI-driven business models). BCG finds companies creating most value focus 80% of investment on Redesign and Creation.
Three donut charts in a row showing the three maturity stages, with descriptions and examples below each
Industry breakdown of workflow redesign adoption: Financial Services 54%, Technology 54%, Manufacturing 48%, Energy/Utilities 47%, Telecom 43%, Consumer/Retail 41%, Healthcare 41%, Public Sector 31%. Global average 50%.
Vertical bar chart with industries on x-axis, dashed average line at 50%
Comparison of adoption-only vs redesigning companies across 6 metrics: Training 5h+ (49% vs 67%, +18pp), Leadership support (40% vs 59%, +19pp), AI value tracking (36% vs 59%, +23pp). Results: Time savings 1h+/day (29% vs 55%, +26pp), Strategic time (35% vs 44%, +9pp), Better decisions (76% vs 89%, +13pp).
Two-column layout: left shows three input metrics, right shows three outcome metrics, each with paired horizontal bars
Paradoxically, employees at companies redesigning workflows feel more job anxiety (46%) than those at adoption-only companies (34%), compared to global average of 41%. +12pp gap. Clear communication and proper upskilling are essential.
Split layout: left black panel with key insight text, right side with three vertical bars comparing overall (41%), adoption-only (34%), redesigning (46%)
AI agents hold many possibilities, but implementation is still halfway through.
Full-screen dark green gradient background with centered white text
77% believe AI agents will become important in 3-5 years, but only 33% fully understand them. Company AI agent status: 31% not yet introduced, 56% experimental/pilot/human-supervised, only 13% integrated into broad workflows.
Four-quadrant layout: two donut charts on left (77% and 33%), stacked horizontal bar on right showing agent adoption stages
Perception of AI agents by familiarity level: Among those who understand agents, 71% see them as valuable collaborative tools (+46pp vs those who don't understand). Only 2% of knowledgeable users see agents as threats vs 16% of unfamiliar users (-14pp).
Split layout: left black panel with key insight, right panel with two horizontal paired bar charts showing value perception vs threat perception
Country-level AI agent workflow integration: Brazil 18%, India 17%, Spain 16%, US 15%, South Africa 13%, UK 13%, Germany 13%, Middle East 11%, Italy 11%, France 11%, Japan 7% (lowest). Global average 13%.
Vertical bar chart with countries ranked by agent adoption, dashed line at 13% global average
Top 3 AI agent concerns: Decisions made without human oversight (46%), Unclear accountability when problems arise (35%), Biased or unfair treatment (32%).
Split layout: left black panel with key insight text, right side with three horizontal green bars showing concern percentages
Four imperatives: (1) Don't underestimate training - invest time, money, and leadership support responsibly, (2) Track AI-driven productivity, work quality, and employee satisfaction gains, (3) Redesign workflows and invest in people to unlock AI value - predict impact on jobs and workers, build upskilling/reskilling systems, (4) Accelerate the learning curve through rigorous AI agent experimentation and A/B testing.
Four-column layout with gradient green-to-dark color blocks, numbered 1-4
Closing slide with BCG X and BCG logos and bcg.com URL.
Full-bleed dark background with centered logos and green data burst visual effect from top
इस स्लाइड और अंतर्निहित प्रस्तुति सामग्री के बारे में सामान्य प्रश्न।
It is Boston Consulting Group's third annual global survey on AI adoption in the workplace, covering 10,635 respondents across 12 countries. It examines AI usage patterns, employee sentiment, training effectiveness, workflow redesign, and AI agent adoption as of June 2025.
72% of respondents use generative AI regularly (weekly or daily). However, there is a significant gap between managers/executives (78-85%) and non-managerial employees (51%), whose adoption rate has plateaued.
Global South countries lead: India (92%), Middle East (87%), Spain (78%), and Brazil (76%). Among Global North countries, the US and France are at 64%, while Japan is lowest at 51%.
The three key barriers are: (1) insufficient skills and training - only 36% received adequate training, (2) lack of appropriate tools - 37% say their company doesn't provide proper AI tools, and (3) insufficient leadership support - only 25% of non-managers feel adequately supported.
Shadow AI refers to the use of AI tools without company permission or IT oversight. 54% of respondents would use AI tools even without company approval, with Gen Z and Millennials at 62%. This poses significant security risks for organizations.
Companies are progressing through three stages: Adoption (72% have deployed GenAI tools), Redesign (50% are redesigning end-to-end workflows), and Creation (22% are building new AI-driven business models). BCG finds that companies creating the most value concentrate 80% of investment on Redesign and Creation.
AI agents are still in early stages: 31% of companies haven't introduced them, 56% are in experimental or pilot phases, and only 13% have integrated agents into broad workflows. 77% believe agents will become important within 3-5 years.
Yes, this is the Japanese-language edition of the BCG AI at Work 2025 survey, making it ideal for Japanese business leaders, HR professionals, and strategy teams looking to understand global AI workplace trends.

Create Your Own Slides
Turn your ideas into professional presentations in seconds with 2slides AI.
पेशेवर डिज़ाइन का संदर्भ लें, अपनी शैली चुनें, और सही टेक्स्ट रेंडरिंग के साथ स्लाइड्स जेनरेट करें। Nano Banana द्वारा संचालित—अभी अपना प्रेजेंटेशन बनाना शुरू करें।
Your AI Agent for slides. Save time, shine faster with intelligent presentation creation.




© 2026 2slides. All rights reserved.