
Analog Devices Company Overview FY2025 — a 52-slide evergreen investor deck positioning ADI as the bedrock of the modern digital economy, covering the company snapshot, semiconductor industry megatrends, business model and competitive advantages, financial model and capital returns, leadership, and non-GAAP reconciliations.
त्वरित नेविगेशन
टैग
स्लाइड साझा करें
Analog Devices Company Overview FY2025 — a 52-slide evergreen investor deck positioning ADI as the bedrock of the modern digital economy, covering the company snapshot, semiconductor industry megatrends, business model and competitive advantages, financial model and capital returns, leadership, and non-GAAP reconciliations.
प्रत्येक स्लाइड पृष्ठ का विस्तृत दृश्य, लेआउट, मुख्य सामग्री और दृश्य तत्वों सहित।
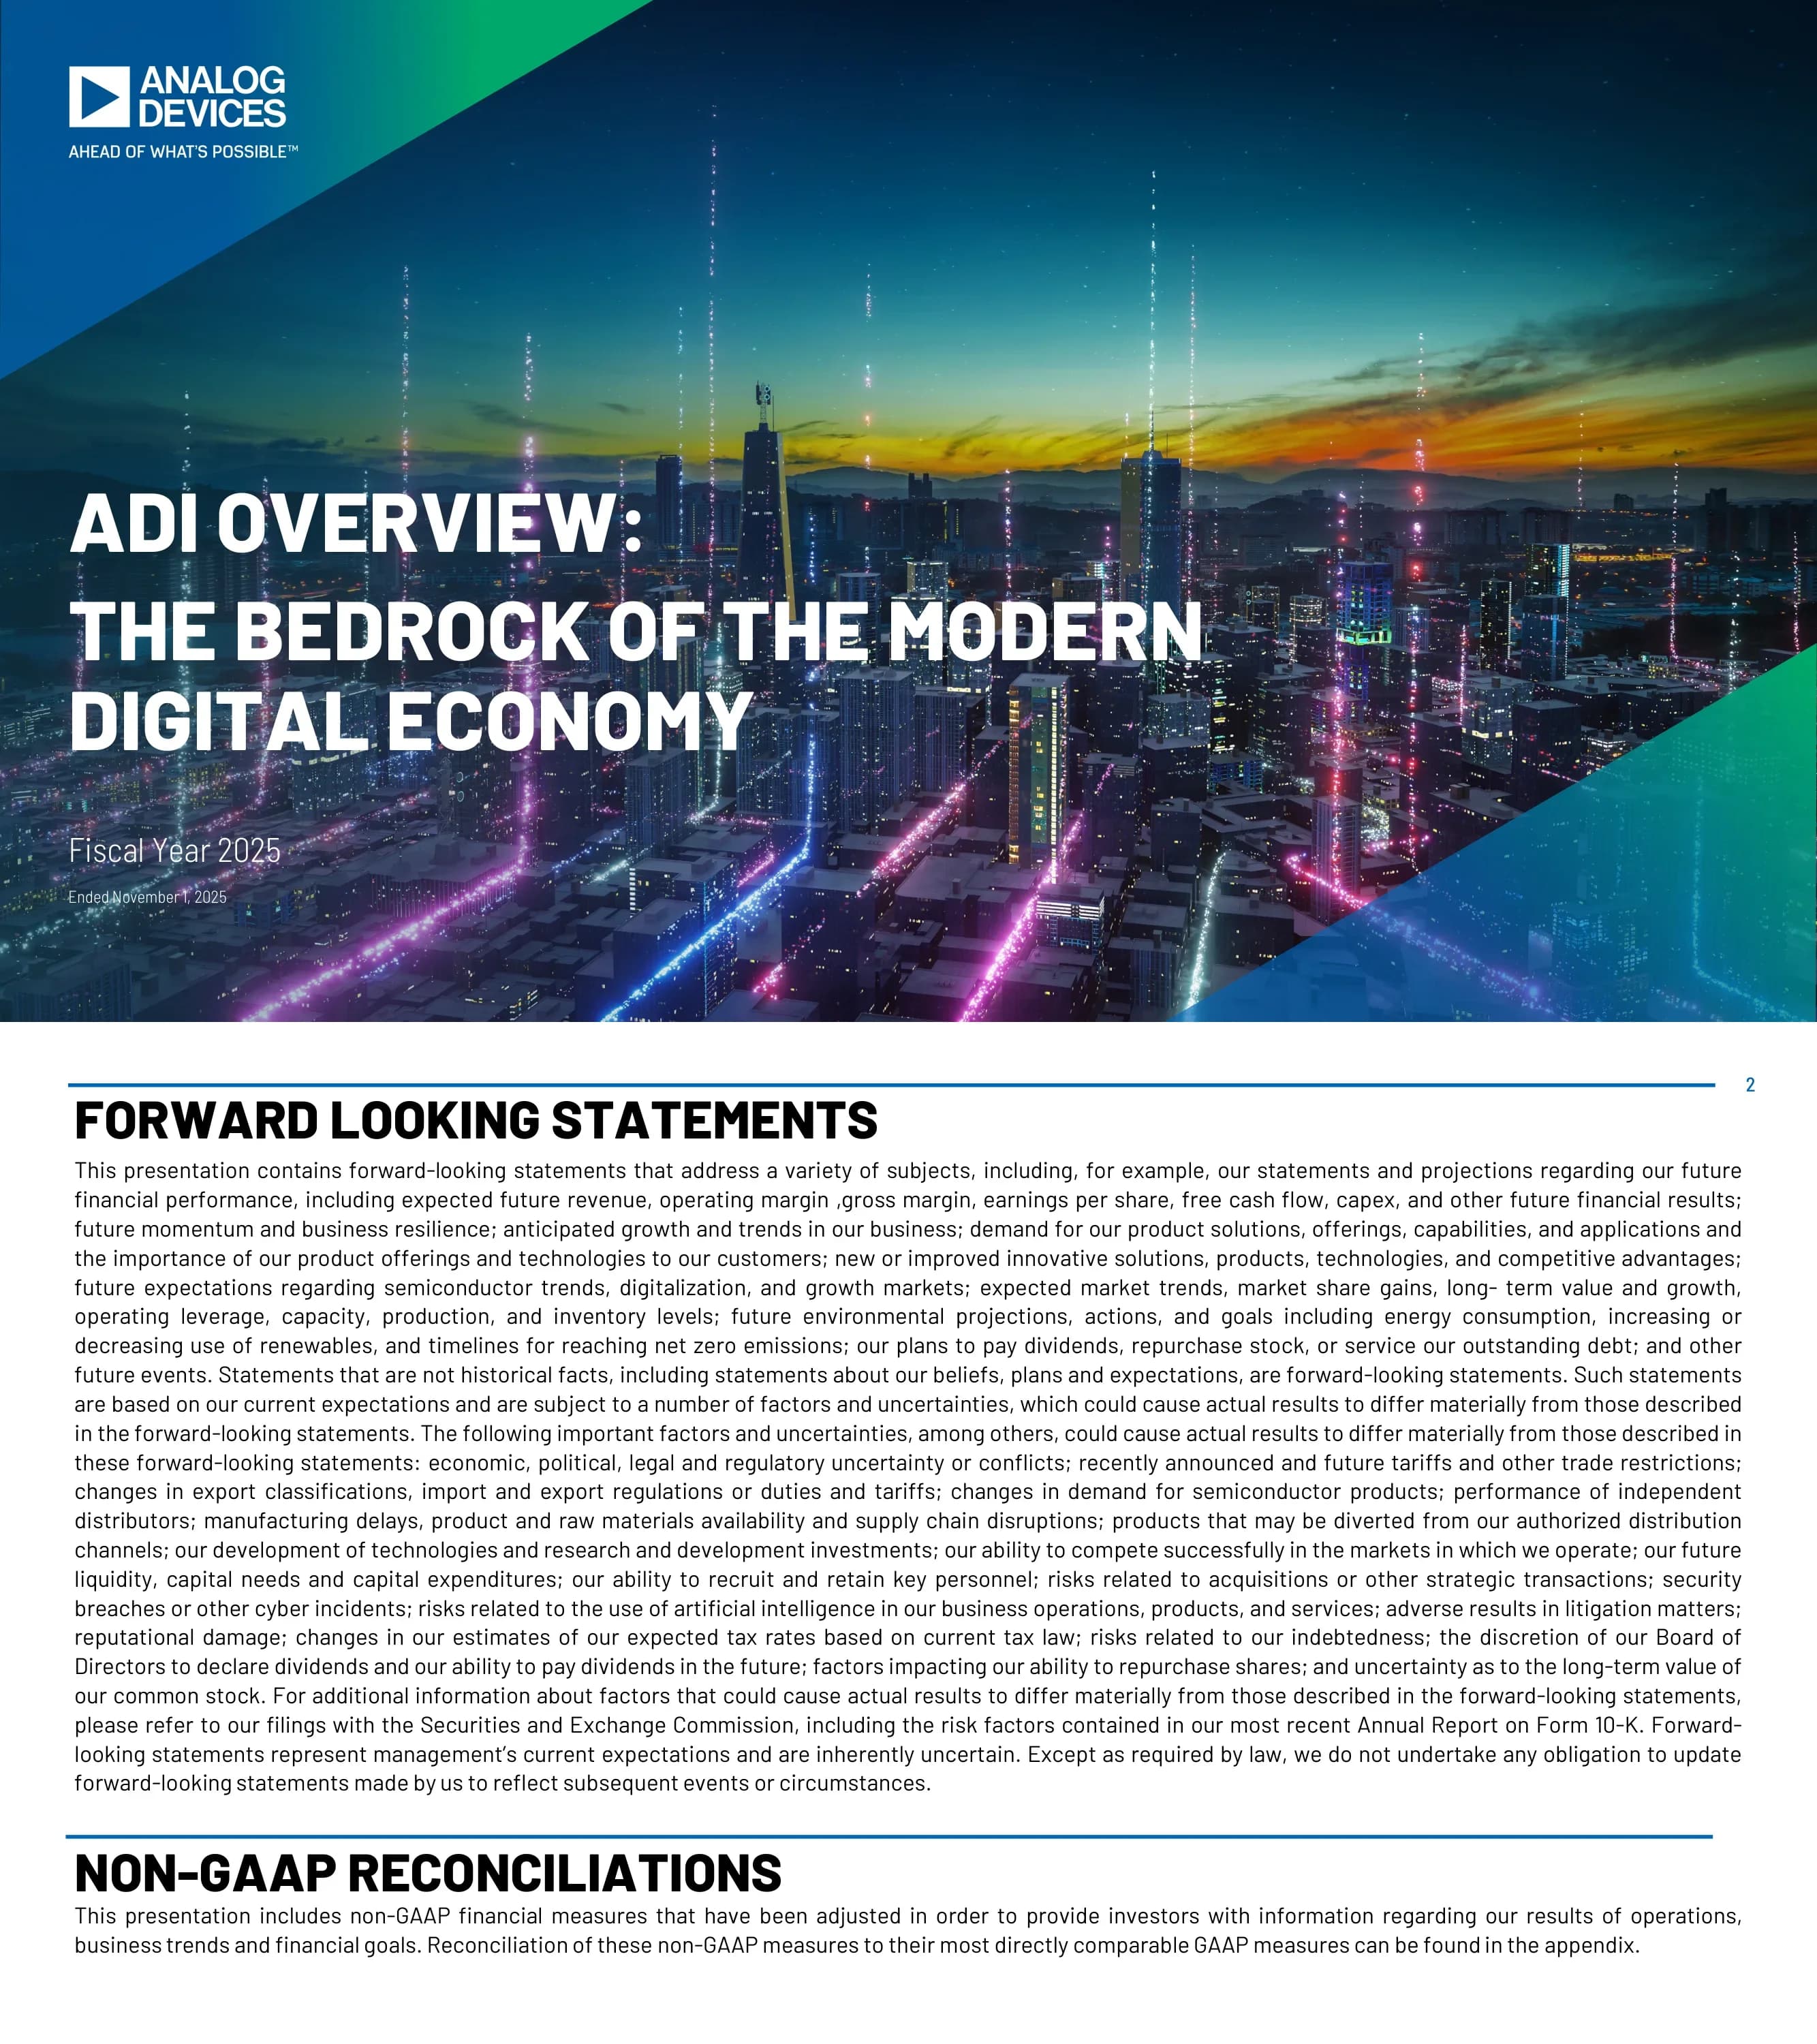
Cover slide for Analog Devices' Fiscal Year 2025 investor overview (fiscal year ended November 1, 2025), titled 'ADI Overview: The Bedrock of the Modern Digital Economy'.
Full-bleed night cityscape photo with glowing light trails, overlaid by a diagonal blue-to-green gradient band; large bold uppercase white title on the left, fiscal year subtitle below, Analog Devices logo top-left.
Safe-harbor disclaimer covering forward-looking statements on revenue, margins, EPS, free cash flow, capex, tariffs, supply chain, environmental goals, dividends and buybacks, referencing the Form 10-K. A second section notes that non-GAAP measures are used and reconciled to GAAP in the appendix.
White text-dense legal slide with two headed sections separated by thin blue rules; small justified body text filling the page width.
Agenda of five chapters with page ranges: ADI Snapshot (pp. 4-7), Industry Overview (pp. 8-15), Business Overview (pp. 16-28), Financial Overview (pp. 29-35) and Leadership (pp. 36-48).
Circuit-board macro photo background with five translucent blue and green angled panels, each holding a chapter name and page range, arranged in a staggered grid.
Section divider opening the ADI Snapshot chapter.
Deep navy background with an angled blue panel on the left carrying the white section title, and a flowing teal particle-wave graphic on the right; logo bottom-right.
Quote from CEO and Chair Vincent Roche: ADI's purpose is to accelerate human breakthroughs, combining analog, digital and software into solutions that transform signals into actions. ADI is described as a global semiconductor leader bridging the physical and digital worlds at the intelligent edge, with $11B FY25 revenue.
Dark blue background with circular logo badge and rounded quote bar containing the quote and a circular CEO headshot; lower half pairs an oversized green '$11B' figure with a bold uppercase positioning statement between dotted rules.
Innovation: ASPs ~4x the analog industry average and >69% adjusted gross margin, highest among analog peers. Growth: 87% B2B end-market mix (Industrial 45%, Automotive 30%, Communications 13%), secular megatrends and a $1B+ revenue synergy target by FY27. Resiliency: 100K+ customers, ~75K products, ~50% of revenue from products a decade or older and ~70% flexible manufacturing capacity; target model of 42-50% adjusted operating margin, 34-40% FCF margin and 100% FCF return.
White slide with three green circles (Innovation, Growth, Resiliency) on the left, each linked to a bordered bullet box; a bracket connects them to a right-side 'Best-in-Class Financial Model' target table with a green header.
Visual collage illustrating application areas enabled by ADI technology: data centers and AI, robotic surgery and healthcare, connected autonomous vehicle cabins, and humanoid robotics.
Four-panel photo collage split by diagonal white dividers, with a centered white banner carrying the blue uppercase headline.
Section divider opening the Industry Overview chapter.
Same divider template as the Snapshot section: angled blue panel with white title on the left and teal particle wave on the right.
Timeline from 1960 to 2050 across hardware-centric, software-enabled and AI-enabled eras: Mainframes (1960s-70s), PC and Internet (1980s-90s), Mobile and Cloud (2000s-2010s), Secure AI-assisted Edge Devices (2020s-2030s) and Intelligent Autonomous Systems (2030s onward), with representative company logos per epoch and a question mark for the future.
Dark navy slide with a rising stair-step of colored wave curves across a horizontal decade axis; each epoch has an icon, label, description and logo cluster, and a gradient band at the bottom labels the three eras.
Semiconductor industry sales are forecast to reach $1.6T+ by 2030 (McKinsey), up from ~$750B today (WSTS, TTM October 2025), of which analog ICs are ~$85B. Six concurrent growth accelerators: AI, smart energy and electrification, advanced robotics, autonomous driving, immersive sensory experience and proactive healthcare.
Left half holds a large donut chart segmenting the semiconductor market (analog, digital, memory, discretes, optoelectronics, sensors and actuators) with callout lines; right half is a rounded panel with a 3x2 grid of circular photos for the growth accelerators.
Compares analog and digital across engineering (more complex design, scarce tacit talent), manufacturing (unique processes, trailing-edge lithography with less obsolescence) and financial dimensions (lower capital intensity, resilient long-lifecycle profits). A 10-year sales growth chart (2015-2025) highlights a >6% 10-year analog CAGR; over 90% of ADI's sales come from analog ICs.
Three blue circles (Engineering, Manufacturing, Financial) stacked on the left with bullet boxes; right side shows a line chart of analog vs digital growth and a bordered CAGR callout.
Global data volume in zettabytes is shown growing exponentially from 2010 to 2028 (Statista), while edge computing spend is tracked against cloud over their first ten years (cloud year 1 = 2008, edge year 1 = 2019). Edge computing drives security, latency and power efficiency advantages across secular growth markets.
Two side-by-side blue bar charts under teal headings separated by a vertical divider, with a bordered takeaway banner across the bottom.
Signal-chain diagram bridging the physical world (audio, light, speed, pressure, motion) to the cyber world: sense/measure/control (sensors, MEMS), condition (amplifiers, filters, isolation), convert (ADC, DAC), edge compute (MCU, DSP, FPGA) and central compute, supported by secure connectivity (GMSL, Ethernet, RF, optical), clocks and power management (PMICs, micromodules). Raw data becomes structured and then interpretable data; ADI versus non-ADI capabilities are color coded.
Horizontal flow diagram inside a grey rounded panel, anchored by circular 'Physical World' and 'Cyber World' photo nodes at each end, with blue ADI boxes, grey non-ADI boxes and a green 'Intelligent Edge' header bar.
Global energy consumption is expected to triple by 2050 while the world races to net zero CO2 emissions from fossil fuels; a chart plots primary energy consumption (TWh) and CO2 emissions (billion tons) from 1950 to 2050. About 70% of global GDP has pledged net zero commitments (IEA).
Dual-axis line chart centered on a white slide, with solid lines for history and dashed lines for projections, a blue two-line headline above and a bordered callout banner below.
Six growth markets with data: AI (70% of data center capacity by 2030, $7T infrastructure capex), smart energy (renewables +50% to $2T+, data centers ~20% of electricity), advanced robotics (AMRs double-digit growth, surgical robotics ~15% CAGR), autonomous driving (L2+ ADAS >50% CAGR, L4 by mid-2030s), immersive sensory experience (smart glasses and AR double-digit growth, auto audio/displays 2x by 2030) and proactive healthcare (>17% of U.S. GDP, fitness trackers >20% CAGR to $250B+).
Grey rounded panel divided into a 3x2 grid; each cell has a blue market label, a circular photo and a column of small bulleted statistics with footnote markers.
Section divider opening the Business Overview chapter.
Standard divider template with angled blue panel, white uppercase title and teal particle wave.
Four pillars of advantage. Technology: high-performance portfolio, ~75K products, ~13K engineers, ~$1.8B FY25 R&D and ~4.8K U.S. patents. Manufacturing: ~70% flexible hybrid capacity, ability to scale foundry capacity, 7nm to 7 micron breadth and diversified supply. Customer: long-term partnerships, system advantages, time to market and world-class support. Financial: ~80% of revenue from products contributing 0.1% or less each, 10+ year average product life, 100K+ customers with none at 10% of sales, and ~$3.7B cash with investment-grade ratings.
Four equal columns, each topped by a blue line icon and uppercase header, containing four stacked rounded cards with green check marks, blue sub-headers and short descriptions.
A layered stack: core analog technologies (RF, converters, amplifiers, interface, power, sensors), embedded digital and software (processing, algorithms, connectivity, security, AI/ML) and solution stacks split into broad market (precision, high-speed, power) and application-specific solutions (vital signs monitoring, advanced connectivity, battery management, motion control), serving customer end applications. Includes a Vincent Roche quote on ADI's ability to solve difficult engineering challenges.
Layered block diagram with blue, teal and green horizontal bars and an upward arrow on the left; a row of line icons for end applications at top and a rounded quote box with CEO headshot at bottom.
Chart shows design complexity and ADI's opportunity rising from the 2000s to the 2020s+, as ADI's R&D focus expands from components (high-performance ICs) to sub-systems (embedded software, algorithms, security) and systems (application software and analytics), increasing content per system.
Left side has a blue curved growth arrow on labeled axes; right side shows three stacked colored blocks (green, teal, blue) with icons under an 'ADI R&D Focus' heading and a vertical 'content per system' arrow; takeaway banner at bottom.
Four product case studies: Apollo (high-speed signal processing platform, >20 GSPS, ~3 billion transistors, 1.5M+ lines of code), Photons-to-Bits (CT scan sub-system with 500 TSVs, 3,500 interconnects and 6 ADCs, reducing radiation dose), Wireless BMS (industry's first for EVs, up to 20% more miles per charge) and Kerberos (first complete O-RAN compliant 5G radio unit platform, 16nm software-defined transceiver).
2x2 grid of rounded cards, each with a product photo on the left and a blue title and bullet list on the right.
Hub diagram of hybrid advantages: technology breadth from 7 nanometers to 7 microns, ~70% flexible capacity supporting gross margin resilience, upside capture by quickly scaling foundry capacity, globally diverse supply resilience, and capital-light operations with 4-6% capex (per the April 2022 Investor Day model).
Central dark circle labeled 'Hybrid Advantages' surrounded by five small icon circles on a dotted ring, each paired with a bold blue or green headline figure and short caption.
Map showing cross-qualified production between ADI fabs in Beaverton and Limerick and foundries in Japan and Taiwan. Benefits: diversified supply sources to mitigate geographic risk, improved delivery times, surge capacity from processes qualified at multiple facilities, and internal utilization mitigation in downturns that supports gross margins.
Grey world map with location pins and factory icons connected by arcing arrows, above a 2x2 grid of bordered benefit boxes.
Customer logo wall organized by end market (industrial, automotive, communications, consumer), featuring companies such as Siemens, Medtronic, Tesla, Toyota, BMW, Samsung, Cisco, Nokia, Amazon, Bose and Sony. ADI's largest customer represents about 5% of revenue.
Centered circular badge ('Largest customer ~5% of revenue') with four blue quadrant labels radiating outward, surrounded by grayscale customer logos grouped by market.
Increasing design complexity (greater functionality, faster speeds, reduced power, smaller form factors) combined with analog talent scarcity (steep learning curve, tacit knowledge, software undergraduates outnumbering hardware undergraduates) creates more opportunity for ADI.
Two circular driver nodes on the left, each with four small icon-labeled factors, funneling through a blue gradient beam into a rounded 'More Opportunity for ADI' box on the right.
ADI invested $1.8B in R&D in FY25 versus a $1.2B peer average, and its design pipeline increased double digits in FY25. Key leadership positions include data conversion, high-performance RF and power, 5G software-defined transceivers, wired and wireless EV battery management, automotive GMSL and A2B connectivity, active noise cancellation, wearable vital signs monitoring, and CT and digital X-ray.
Left grey panel with a two-bar R&D comparison chart and a bordered pipeline callout; right side lists innovations in two columns with green check icons, plus a talent callout box at the bottom.
Revenue mix by product age for 2021-2025 (<5, 5-10, 10-20 and >20 years) shows ~50% of ADI revenue comes from products 10+ years old. A revenue-by-product chart of ~75K SKUs shows ~80% of revenue comes from products that each contribute 0.1% or less.
Two halves split by a vertical divider: left has a stacked bar chart with a large '~50%' callout; right has a finely segmented radial chart with '~75K SKUs' at center and a large '~80%' callout.
Climate goals and 2025 progress: 42% reduction toward at least 50% cut in Scope 1 and 2 emissions by 2030; 100% renewable energy at manufacturing facilities achieved; 55% reduction toward 75% cut in fab Scope 1 emissions by 2026; 18% reduction toward 30-35% lower upstream Scope 3 intensity by 2030; water withdrawal up 6% versus a 50% reduction goal; 90% waste diverted toward 100% by 2030. ADI participates in initiatives including UN Global Compact, CDP, ecovadis and RBA.
Left column pairs 'Net zero by 2050' and 'Water and waste reduction' labels with icons; center is a two-column goal and progress table with a blue header; right sidebar lists global initiative logos.
FY2025 global female workforce representation is 22% in engineering and 25% among managers. U.S. workforce race and ethnicity: 49% White, 35% Asian, 6% Hispanic/Latinx, 2% Black, 3% other and 5% unknown. Employee networks include Analog Veterans, Neurodiversity, People of Color and Allies, Green Team, Pride, Women's Leadership and Young Professionals.
Left grey panel with a horizontal bar chart and a two-column bulleted list of employee networks; right side shows a donut chart with callout labels.
Section divider opening the Financial Overview chapter.
Standard divider template: angled blue panel with white title and teal particle wave; logo bottom-right.
FY2025 revenue by end market: Industrial 45%, Automotive 30%, Communications 13% and Consumer 13%, with 87% from B2B. Revenue by geography: U.S. 29%, China 26%, Europe 21%, Rest of Asia 13%, Japan 9% and Americas ex-U.S. 1%.
Two donut charts side by side separated by a vertical divider, each with large colored percentage labels connected by dotted leader lines; a navy 'B2B 87%' tag and an outer arc on the end-market donut.
FY2025 comparison: ADI adjusted gross margin 69% vs 55% for the Philadelphia Semiconductor Index median and 44% for the S&P 500 median; adjusted operating margin 42% vs 26% and 19%; free cash flow margin 39% vs 22% and 12%. ADI has delivered positive free cash flow for 29 consecutive years; GAAP gross margin was 61% and GAAP operating margin 27%.
Three-column grouped horizontal bar chart with rows for ADI, SOX median and S&P 500 median, using blue and green gradient bars with value labels, and a bordered banner at the bottom.
Stacked bar chart of dividends and repurchases from FY21 to FY25. Dividends target 40-60% of FCF with 21 straight years of dividend growth; excess FCF goes to share count reduction, with $2.2B repurchased in fiscal 2025. Over the last five years ADI has returned more than $19B, about 17% of its market cap.
Left stacked blue and green bar chart; right side has two icon rows (Dividend, Share Repurchase) with arrow buttons and bullets, above a solid blue rounded callout summarizing the return commitment.
Target model: revenue growth 7-10% CAGR, adjusted gross margin 70% floor, adjusted operating margin 42-50%, free cash flow margin 34-40%, free cash flow return 100% and capex 4-6% of revenue. Callout: path to $15 adjusted EPS and 40% FCF margin by FY27.
Two-column table with grey metric labels and a blue-bordered 'Target Model' column, plus a right-side callout with a vertical blue bar and large blue '$15 EPS & 40% FCF' text.
Overall 7-10% long-term revenue CAGR by end market: Industrial (45% of FY25 revenue) high single digits across automation, instrumentation, healthcare, aerospace and defense and energy; Automotive (30%) low teens driven by software-defined and connected vehicles and powertrain; Communications (13%) ~10% from datacenter and wireless; Consumer (13%) high single digits from portables and prosumer.
Left column shows a large blue '7-10%' figure; right side is a 2x2 grid of bordered cards, each with a small donut chart, revenue share and bold CAGR descriptor.
Three value pillars: resilient growth (highly diverse and sticky revenue aligned to secular growth markets), highly profitable (industry-leading gross margins and a path to $15 EPS and 40% FCF margin) and 100% FCF return (consistent dividend increases and annual share count reduction).
Full blue-to-green gradient background with three columns separated by thin vertical lines, each with a white line icon, uppercase heading and two bullets.
Section divider opening the Leadership chapter.
Standard divider template: angled blue panel with white title and teal particle wave.
Vincent Roche is ADI's third CEO and second Board Chair since its 1965 founding; he joined ADI in 1988, became President in 2012, CEO in May 2013 and Chair in 2022. He serves on the Semiconductor Industry Association board and MIT Presidential CEO Advisory Board and holds degrees from the University of Limerick.
Executive bio template: grey left sidebar with a circular headshot in a dotted blue ring, bold name and title; right area has multi-paragraph bio text under a thin blue rule.
Janene Asgeirsson leads legal, governance, trade, regulatory, government affairs, risk, compliance, M&A and internal audit. Before joining ADI in August 2021 she was chief legal officer at Acacia Communications, leading its 2016 IPO and sale to Cisco; she holds a JD from Northeastern and a BA in accountancy from the University of San Diego.
Executive bio template with circular headshot and title in the left sidebar and bio text on the right.
Martin Cotter oversees Industrial and Multi-Markets, Automotive, Aerospace, Defense and Communications, Healthcare and Consumer business units and leads ADI EMEA. He joined ADI in 1986 as a design engineer and holds engineering and MBA degrees from the University of Limerick.
Executive bio template with circular headshot, name and title left, bio paragraphs right.
Jerry Fan oversees sales, marketing and operations across Asia Pacific and previously served as President of ADI China. Earlier he held senior sales roles at Cisco Systems, Digital Equipment Corporation and Sun Microsystems.
Executive bio template with circular headshot and title left, shorter bio text right.
Vivek Jain leads ADI's global manufacturing and supply chain, joining in 2021 through the Maxim Integrated acquisition where he led technology and manufacturing. He previously was a plant manager at Intel, has published 30+ papers, holds 10+ patents and studied at IIT Delhi, Penn State and Stanford.
Executive bio template with circular headshot and title left, bio paragraphs right.
Katsu Nakamura leads customer strategy, global sales, marketing and digital go-to-market. He joined ADI in 1994 as a CMOS data converter designer, is an ADI Fellow and IEEE Fellow with 20+ U.S. patents, and holds B.S., M.S. and Ph.D. degrees from Carnegie Mellon.
Executive bio template with circular headshot and title left, bio paragraphs right.
Rob Oshana leads ADI's embedded systems and application software strategy and digital roadmap, previously heading the Software and Security Group. He was VP of Software Engineering R&D at NXP and brings 30+ years of experience including Texas Instruments, Raytheon and Freescale, with a PhD in computer science from SMU.
Executive bio template with circular headshot and title left, bio paragraphs right.
Richard Puccio joined ADI as CFO in February 2024 after serving since 2021 as CFO of Amazon Web Services, an $88B revenue business. He spent 21 years as a Partner at PwC serving technology and semiconductor clients, and holds an AB in economics from Harvard and an MBA from Boston University.
Executive bio template with circular headshot and title left, bio paragraphs right.
Stephanie Sidelko guides ADI's strategy, M&A and ESG objectives. Since joining in 2019 she served as Treasurer, supporting the Maxim Integrated acquisition and leading the semiconductor industry's inaugural green bond, and as CFO of the Automotive, Communications and Aerospace units; she chairs the Analog Devices Foundation and holds an MIT mechanical engineering degree.
Executive bio template with circular headshot and title left, bio paragraphs right.
Mariya Trickett leads human resources and talent functions including engagement, acquisition, rewards and succession planning. She was previously CHRO at Aptiv, a $15B mobility company with 180,000+ employees, and at Dana, and began her career at SAP.
Executive bio template with circular headshot and title left, bio paragraphs right.
Ten directors described as highly qualified and diverse with ongoing refreshment: Vincent Roche (CEO and Chair), Stephen Jennings (Lead Independent Director), André Andonian, Edward H. Frank, Karen M. Golz, Peter B. Henry, Mercedes Johnson, an executive officer of Panasonic Holdings, co-founder Ray Stata and Andrea F. Wainer.
Grey rounded panel containing a 3-column grid of small circular headshots, each with a blue name and grey affiliation text.
Director skills matrix counts: strategy 10, innovation and emerging technologies 9, international 9, industry 8, corporate governance 8, large-scale operations 8, executive leadership 6, sustainability and human capital 6, M&A 5, financial 4, government affairs 3, risk management 2 and cybersecurity 2. 8 of 10 directors are independent (80%) with 3.75 years average independent tenure; 4 of 10 identify as female (40%) and 3 of 10 are non-white (30%).
Two columns of blue skill headings with counts and short descriptions on the left, and a right panel with large blue ratio figures and dot-row pictograms for independence and diversity.
Section divider opening the Appendix.
Full-bleed photo of a person walking through a blue-lit server aisle, with white 'Appendix' title top-left and logo bottom-right.
FY25 ($ millions): revenue $11,020; GAAP gross margin $6,773 (61%) plus $868 acquisition-related expenses gives adjusted gross margin $7,641 (69%). GAAP operating income $2,932 (27%) plus $1,620 acquisition expenses and $70 special charges gives adjusted operating income $4,622 (42%). Operating cash flow $4,812 (44%) less $534 capex yields free cash flow $4,279 (39% of revenue).
Three side-by-side reconciliation tables with blue 'FY 25' headers and alternating grey rows, below a title and rounding note.
Explains that forward-looking non-GAAP estimates (adjusted gross margin, adjusted operating margin, FCF margin, FCF return and adjusted EPS) cannot be reconciled to GAAP without unreasonable effort because items such as tax rate changes, acquisition costs, debt extinguishment and special charges are difficult to predict.
White slide with a bold title and a single justified paragraph of disclosure text.
Lists the 15 sources behind the megatrend statistics, including McKinsey, Statista, Forbes, Bloomberg, Grand View Research, Business Wire, S&P Global, RAND, the World Health Organization, Fortune Business Insights and ADI internal estimates.
White slide with a blue and black title and a numbered list of source citations with hyperlinked article names in small text.
इस स्लाइड और अंतर्निहित प्रस्तुति सामग्री के बारे में सामान्य प्रश्न।
It is a 52-slide evergreen overview organized into an ADI Snapshot, Industry Overview, Business Overview, Financial Overview, Leadership and an Appendix. It covers FY2025 results ($11B revenue, 69% adjusted gross margin, 39% free cash flow margin), semiconductor megatrends, competitive advantages, hybrid manufacturing, the long-term financial model, executive bios, the board skills matrix and non-GAAP reconciliations.
The target model calls for 7-10% revenue CAGR, a 70% adjusted gross margin floor, 42-50% adjusted operating margin, 34-40% free cash flow margin, 100% free cash flow return and capex of 4-6% of revenue, with a stated path to $15 adjusted EPS and 40% FCF margin by FY27.
By end market, Industrial is 45%, Automotive 30%, Communications 13% and Consumer 13%, making 87% of revenue B2B. By geography, the U.S. is 29%, China 26%, Europe 21%, Rest of Asia 13%, Japan 9% and the Americas outside the U.S. 1%.
Yes, the structure transfers well: a title and disclaimer, a paginated table of contents, a one-page snapshot with key metrics, market and megatrend slides, a competitive-advantage grid, product case studies, financial benchmark and target-model slides, leadership bios, a board matrix and an appendix. Replace ADI's data, logos and photography with your own, and keep the safe-harbor and non-GAAP disclosures that apply to your company.
It uses a corporate navy, royal blue and green palette with bold condensed uppercase headlines, repeated section dividers featuring an angled blue panel and a teal particle-wave graphic, white content slides with rounded bordered cards, line icons, donut and bar charts, and a consistent circular-headshot template for executive bios.
It cites ~75K products, 100K+ customers with the largest at about 5% of revenue, ~80% of revenue from products each contributing 0.1% or less, ~50% of revenue from products 10+ years old, ~70% flexible manufacturing capacity, 29 consecutive years of positive free cash flow and ~$3.7B of cash with investment-grade credit ratings.
Slide 31 shows ADI's FY2025 adjusted gross margin at 69% versus 55% for the Philadelphia Semiconductor Index median and 44% for the S&P 500 median, adjusted operating margin at 42% versus 26% and 19%, and free cash flow margin at 39% versus 22% and 12%.
Official presentations, earnings releases, SEC filings and the non-GAAP reconciliations referenced in this deck are published on the Analog Devices Investor Relations website at investor.analog.com.
Official source for ADI investor presentations, including the FY2025 'ADI Overview: The Bedrock of the Modern Digital Economy' deck, earnings materials and SEC filings.

Create Your Own Slides
Turn your ideas into professional presentations in seconds with 2slides AI.
पेशेवर डिज़ाइन का संदर्भ लें, अपनी शैली चुनें, और सही टेक्स्ट रेंडरिंग के साथ स्लाइड्स जेनरेट करें। Nano Banana द्वारा संचालित—अभी अपना प्रेजेंटेशन बनाना शुरू करें।
Your AI Agent for slides. Save time, shine faster with intelligent presentation creation.




© 2026 2slides. All rights reserved.