
Alphabet's Q2 2026 earnings presentation (July 22, 2026) — a 12-slide quarterly deck covering revenue of $119.8 billion (up 24% year over year), the income statement, segment results for Google Services and Google Cloud, capital expenditures that doubled year over year, and a free cash flow that turned negative in the quarter.
त्वरित नेविगेशन
टैग
स्लाइड साझा करें
Alphabet's Q2 2026 earnings presentation (July 22, 2026) — a 12-slide quarterly deck covering revenue of $119.8 billion (up 24% year over year), the income statement, segment results for Google Services and Google Cloud, capital expenditures that doubled year over year, and a free cash flow that turned negative in the quarter.
प्रत्येक स्लाइड पृष्ठ का विस्तृत दृश्य, लेआउट, मुख्य सामग्री और दृश्य तत्वों सहित।
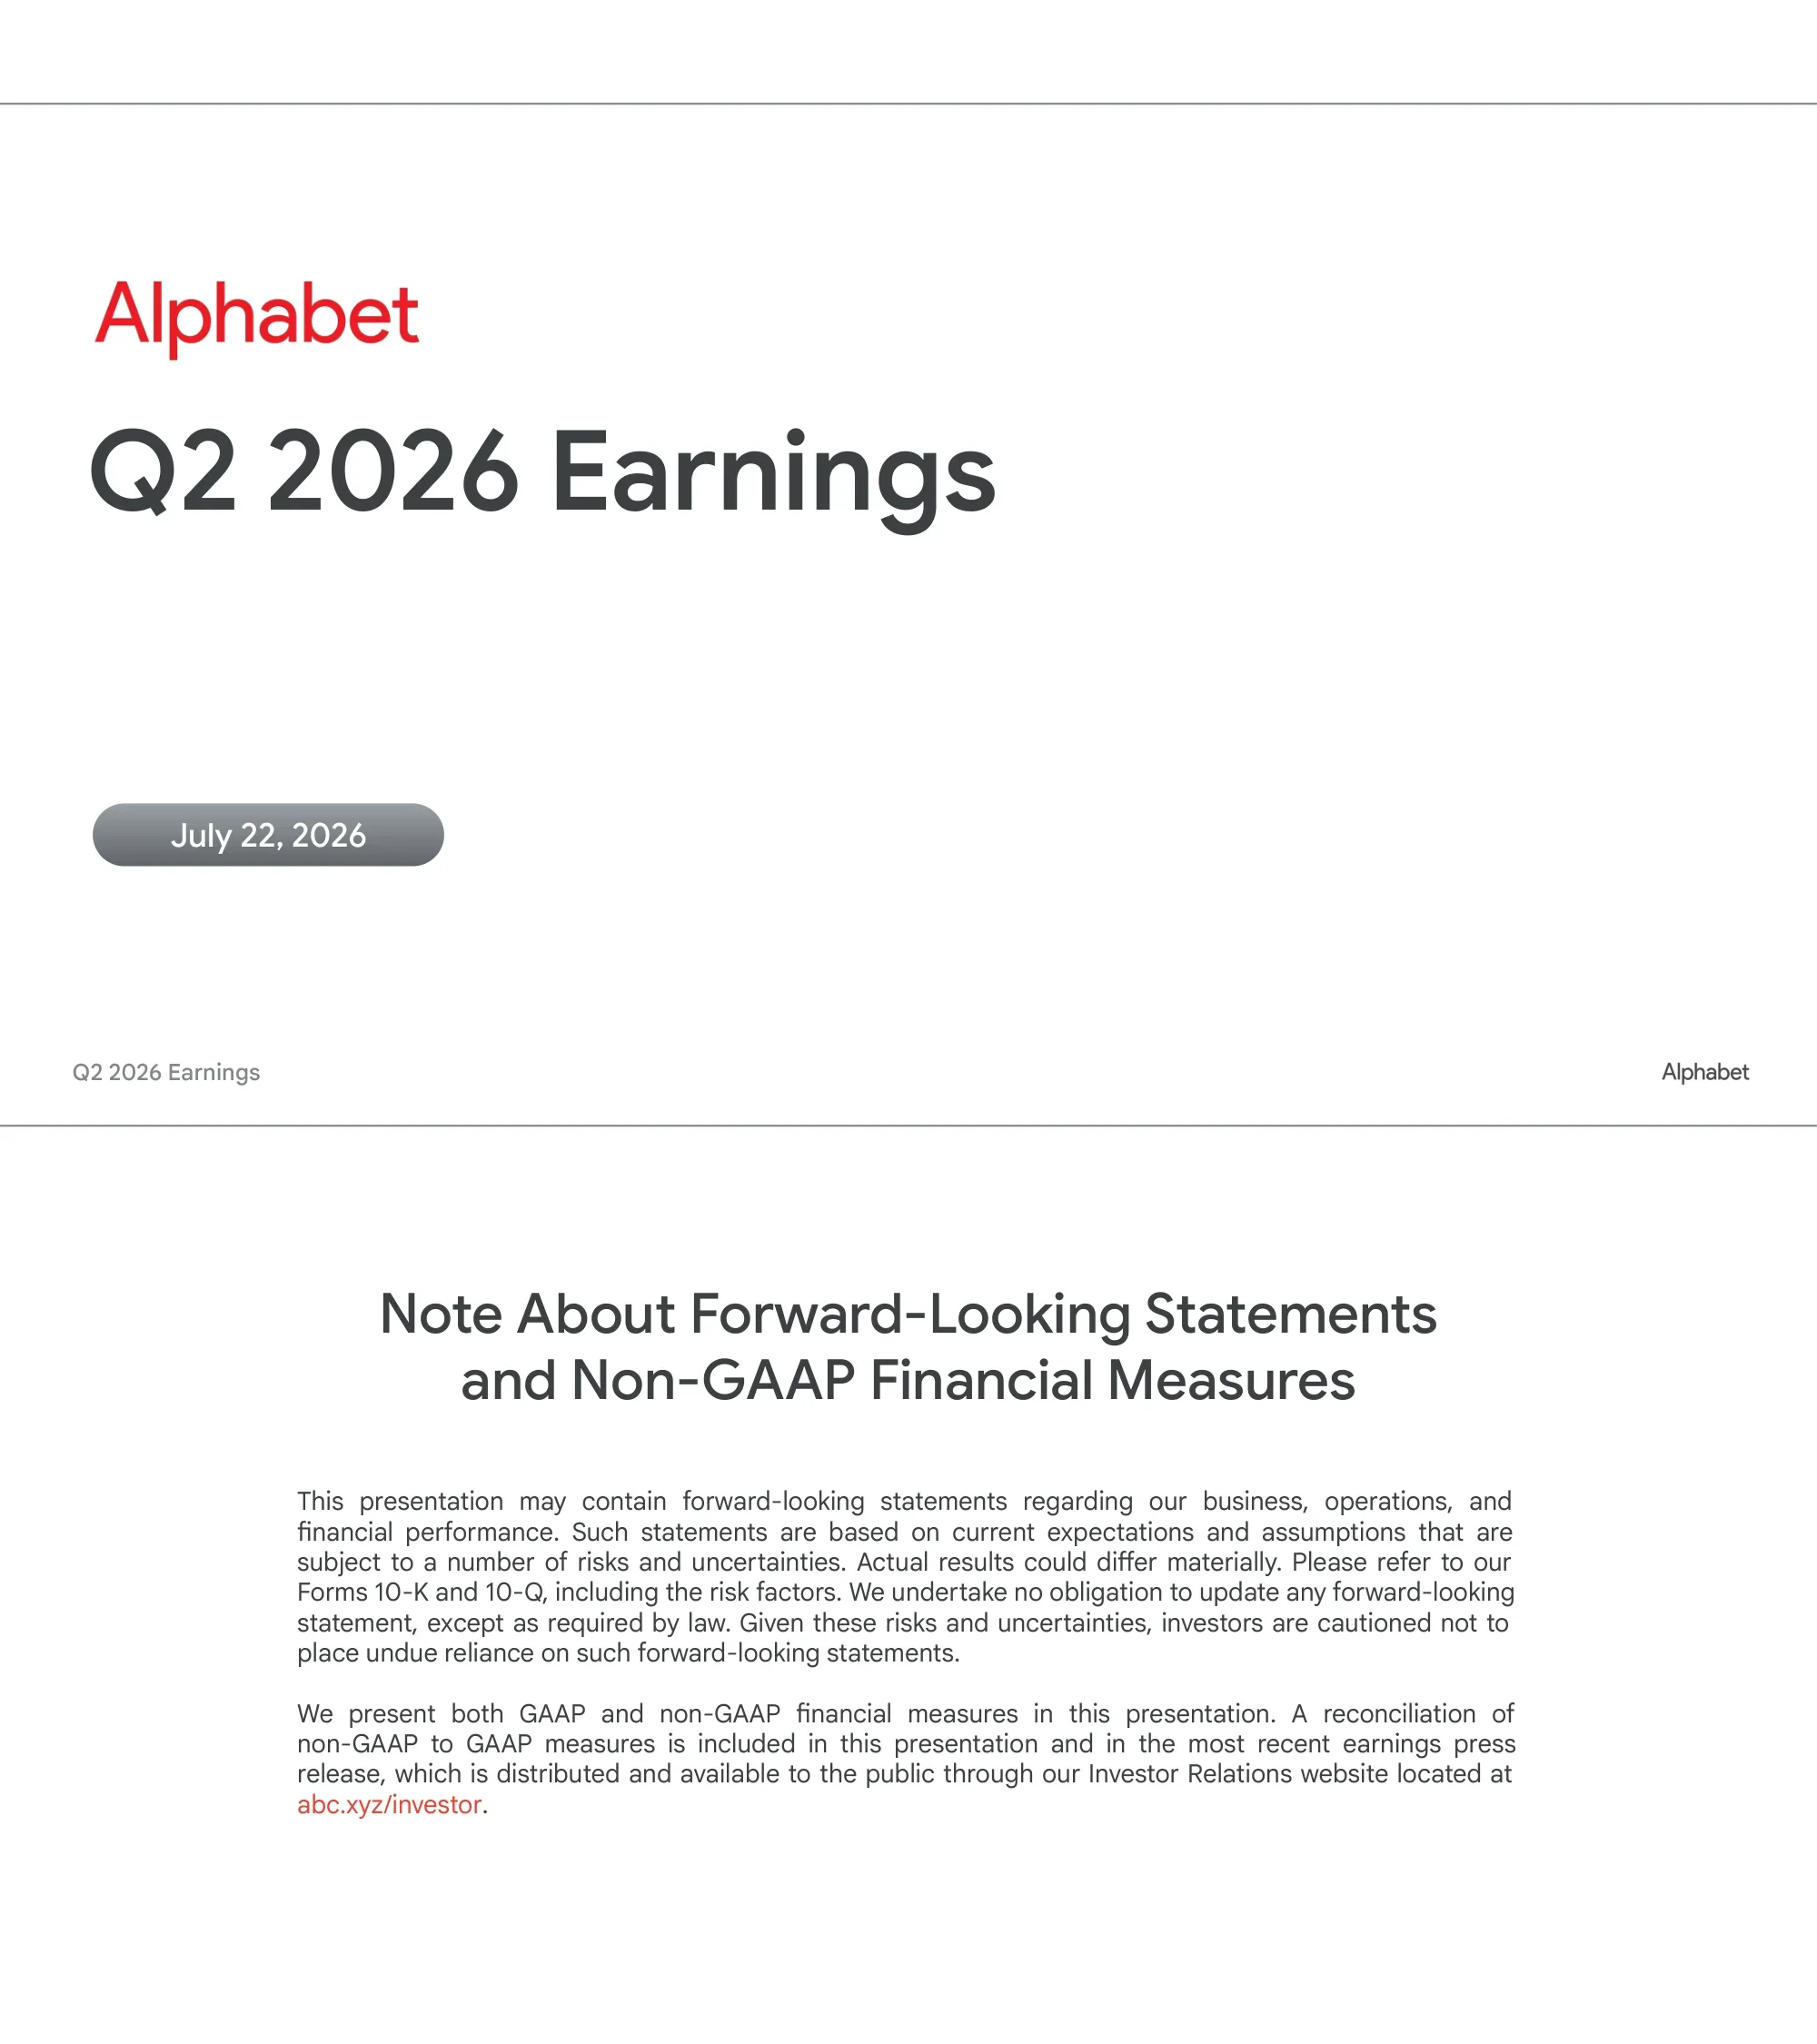
Cover slide for Alphabet's second quarter 2026 earnings presentation, dated July 22, 2026.
White field with a thin rule across the top; the Alphabet wordmark in red above a large dark headline at left; the date sits in a grey rounded pill lower left.
Forward-looking statements caution directing readers to the 10-K and 10-Q risk factors, plus a note that both GAAP and non-GAAP measures are presented and that the reconciliation appears in this presentation and the earnings press release at abc.xyz/investor.
White slide with a centred two-line heading and two justified paragraphs beneath; running header carries the quarter at left and Alphabet at right.
A product-launch timeline from November 2025 to May 2026 showing nine releases: Gemini 3, Nano Banana Pro, Gemini in Chrome updates, Gemini 3.5 Flash, Gemini Spark, Google Antigravity, Genie 3 for AI Ultra subscribers, Gemini 3.1 Pro and Gemini Omni.
A horizontal timeline rail with dated endpoints runs across the middle; product cards alternate above and below the rail, each a rounded white card with a title and a product screenshot.
Six headline metrics: Alphabet revenue up 24% year over year; Search revenue up 17%; Google Cloud revenue up 82% with a $514 billion backlog; approximately 22 billion tokens per minute on first-party model APIs against 16 billion-plus last quarter; YouTube Ads revenue up 13%; and 950 million Gemini App monthly active users.
Six equal rounded cards in a row, each with a product logo at the top, an oversized figure in the middle, a two-line description, and the product name in grey at the foot.
Full income statement comparing Q2'25 to Q2'26: revenues $96,428M to $119,796M (up 24%); total costs and expenses $65,157M to $79,026M; income from operations $31,271M to $40,770M (up 30%); other income $2,662M to $97,983M (up 3,581%); net income available to common stockholders $28,196M to $112,107M (up 298%); diluted EPS $2.31 to $9.11 (up 294%).
Single rounded table card with a grey gradient header row; bold rows for totals, indented rows for components; three columns for the two periods and the Y/Y change.
Revenues rose from $96,428M to $119,796M, with Y/Y growth accelerating from +14% to +24%. Operating income rose from $31,271M to $40,770M, with operating margin improving from 32.4% to 34.0%.
Two rounded chart cards side by side, each with a two-bar chart, a labelled y-axis and a metric row printed beneath the axis (Y/Y growth at left, operating margin at right).
Cost of revenues rose from $39,039M to $45,943M, split into total TAC ($14,705M to $16,179M) and other cost of revenues ($24,334M to $29,764M). Operating expenses rose from $26,118M to $33,083M, split into R&D ($13,808M to $18,219M), sales and marketing ($7,101M to $8,403M) and general and administrative ($5,209M to $6,461M).
Two chart cards with internally stacked bars and a legend above each; component values printed inside the segments; Y/Y growth row beneath each axis.
Google Services revenues rose from $82,543M to $94,540M (+15%), decomposed into Google Search & Other $54,190M to $63,271M (+17% Y/Y), YouTube Ads $9,796M to $11,055M (+13%), Google Network $7,354M to $7,303M (-1%) and Subscriptions, Platforms & Devices $11,203M to $12,911M (+15%). Operating income rose from $33,063M to $39,544M with margin improving from 40.1% to 41.8%.
Left card carries a four-way stacked bar with per-component Y/Y percentages annotated to the right of the stack; right card carries a two-bar operating income chart with a margin row beneath.
Google Cloud revenues rose from $13,624M to $24,768M, with Y/Y growth accelerating from +32% to +82%. Operating income rose from $2,826M to $8,814M, with operating margin improving from 20.7% to 35.6%.
Same two-card layout as the other segment slides; the operating income bars are rendered in yellow rather than blue.
Five quarters of capital expenditure: $22,446M, $23,953M, $27,851M, $35,674M and $44,924M, with Y/Y growth of +70%, +83%, +95%, +107% and +100% respectively — roughly a doubling over the year.
Single wide chart card with five bars, value labels above each, and a Y/Y growth row printed beneath the axis.
Five quarters of cash flow: net cash from operating activities $27,747M to $39,069M (up 41%); purchases of property and equipment $(22,446)M to $(44,924)M (up 100%); quarterly free cash flow $5,301M falling to negative $(5,855)M, marked NM for the year-over-year comparison; trailing twelve months free cash flow $66,728M falling to $53,273M, down 20%.
Single table card with a blue gradient header row and five quarter columns; a separate detached card at the right carries the Y/Y column; two footnotes define the non-GAAP measure and the NM abbreviation.
Defines free cash flow as net cash from operating activities less capital expenditures, and TTM free cash flow as the same over the most recent twelve consecutive months; then reconciles both across eight quarters from Q3'24 to Q2'26, showing quarterly free cash flow falling from $17,637M to negative $(5,855)M and TTM free cash flow from $66,728M to $53,273M.
Explanatory paragraph and two definition bullets at the top; a wide table card beneath with a blue gradient header and eight quarter columns, split into a quarterly block and a TTM block separated by a blank row.
इस स्लाइड और अंतर्निहित प्रस्तुति सामग्री के बारे में सामान्य प्रश्न।
The full 12-slide Alphabet Q2 2026 earnings presentation as both PDF and editable PowerPoint, plus a page-by-page preview. The PPTX keeps layouts, charts and tables editable so you can substitute your own figures.
Yes. It is the Q2 2026 Earnings Slides that Alphabet published on its investor relations site alongside the July 22, 2026 results, including the forward-looking-statements slide and the free cash flow reconciliation.
No, and that is the point of studying it. Twelve slides carry a full income statement, two segment breakdowns, cost and expense decomposition, five quarters of capex, five quarters of cash flow and an eight-quarter reconciliation. If your deck runs to forty slides, this is a useful benchmark for what can be cut.
The Earnings Highlights slide: six rounded cards, each with the product logo it refers to, one oversized number, and a two-line explanation. It compresses a whole quarter into one readable row, and badging each number with a product makes it scannable in a way a plain metric row is not.
It prints it. Quarterly free cash flow is negative $5.9 billion because capital expenditures doubled to $44.9 billion. Rather than switching to a friendlier metric, the deck shows five quarters plus a trailing-twelve-month row so the single negative quarter sits in context, marks the year-over-year comparison as Not Meaningful, and reconciles the whole thing across eight quarters on the next slide.
Open the PPTX and check before committing — exported investor decks often mix native PowerPoint objects with pasted images. Layouts, text, colours and shapes stay editable either way.
Light, not dark. White backgrounds, soft rounded chart cards with a faint blue glow at the edges, and Google's four brand colours used as data colours in the stacked bars. Every chart prints a Y/Y growth or operating margin row directly beneath the axis. A thin running header carries the quarter at left and Alphabet at right on every slide.
It gives the quarter's shipping activity a visual shape without a single number — nine launches from November to May laid along a rail with screenshots. If your business story is 'we shipped a lot', it is a cleaner answer than a bulleted list, and it takes only one slide.
Alphabet publishes each quarter's earnings slides and press release on this page; this deck is the Q2 2026 entry.

Create Your Own Slides
Turn your ideas into professional presentations in seconds with 2slides AI.
पेशेवर डिज़ाइन का संदर्भ लें, अपनी शैली चुनें, और सही टेक्स्ट रेंडरिंग के साथ स्लाइड्स जेनरेट करें। Nano Banana द्वारा संचालित—अभी अपना प्रेजेंटेशन बनाना शुरू करें।
Your AI Agent for slides. Save time, shine faster with intelligent presentation creation.




© 2026 2slides. All rights reserved.