
Fait partie de Exemples de présentations investisseurs · Exemples de présentations investisseurs indiennes
Vedanta Aluminium Metal Q2 FY27 Earnings Presentation (2QFY27, quarter ended September 30, 2026) — the 29-page results deck of Vedanta Aluminium Metal Ltd (VAML), the demerged aluminium business of Vedanta, filed with BSE on October 28, 2026. It covers record aluminium and alumina production, hot metal cost of production, ESG and safety, CSR, EBITDA bridges, net debt walk, balance sheet, income statement, digital/AI initiatives, project capex and FY27 guidance. Figures are in ₹ crore (Cr) and US$ per tonne as presented in the deck.
Utilise la couverture de cette présentation comme référence de style pour des diapositives créées à partir de votre propre contenu. Ou choisissez une page ci-dessous pour utiliser sa mise en page comme référence.
Navigation rapide
Étiquettes
Partager les diapositives
Vedanta Aluminium Metal Q2 FY27 Earnings Presentation (2QFY27, quarter ended September 30, 2026) — the 29-page results deck of Vedanta Aluminium Metal Ltd (VAML), the demerged aluminium business of Vedanta, filed with BSE on October 28, 2026. It covers record aluminium and alumina production, hot metal cost of production, ESG and safety, CSR, EBITDA bridges, net debt walk, balance sheet, income statement, digital/AI initiatives, project capex and FY27 guidance. Figures are in ₹ crore (Cr) and US$ per tonne as presented in the deck.
Vue détaillée de chaque page de diapositive, incluant la mise en page, le contenu clé et les éléments visuels.
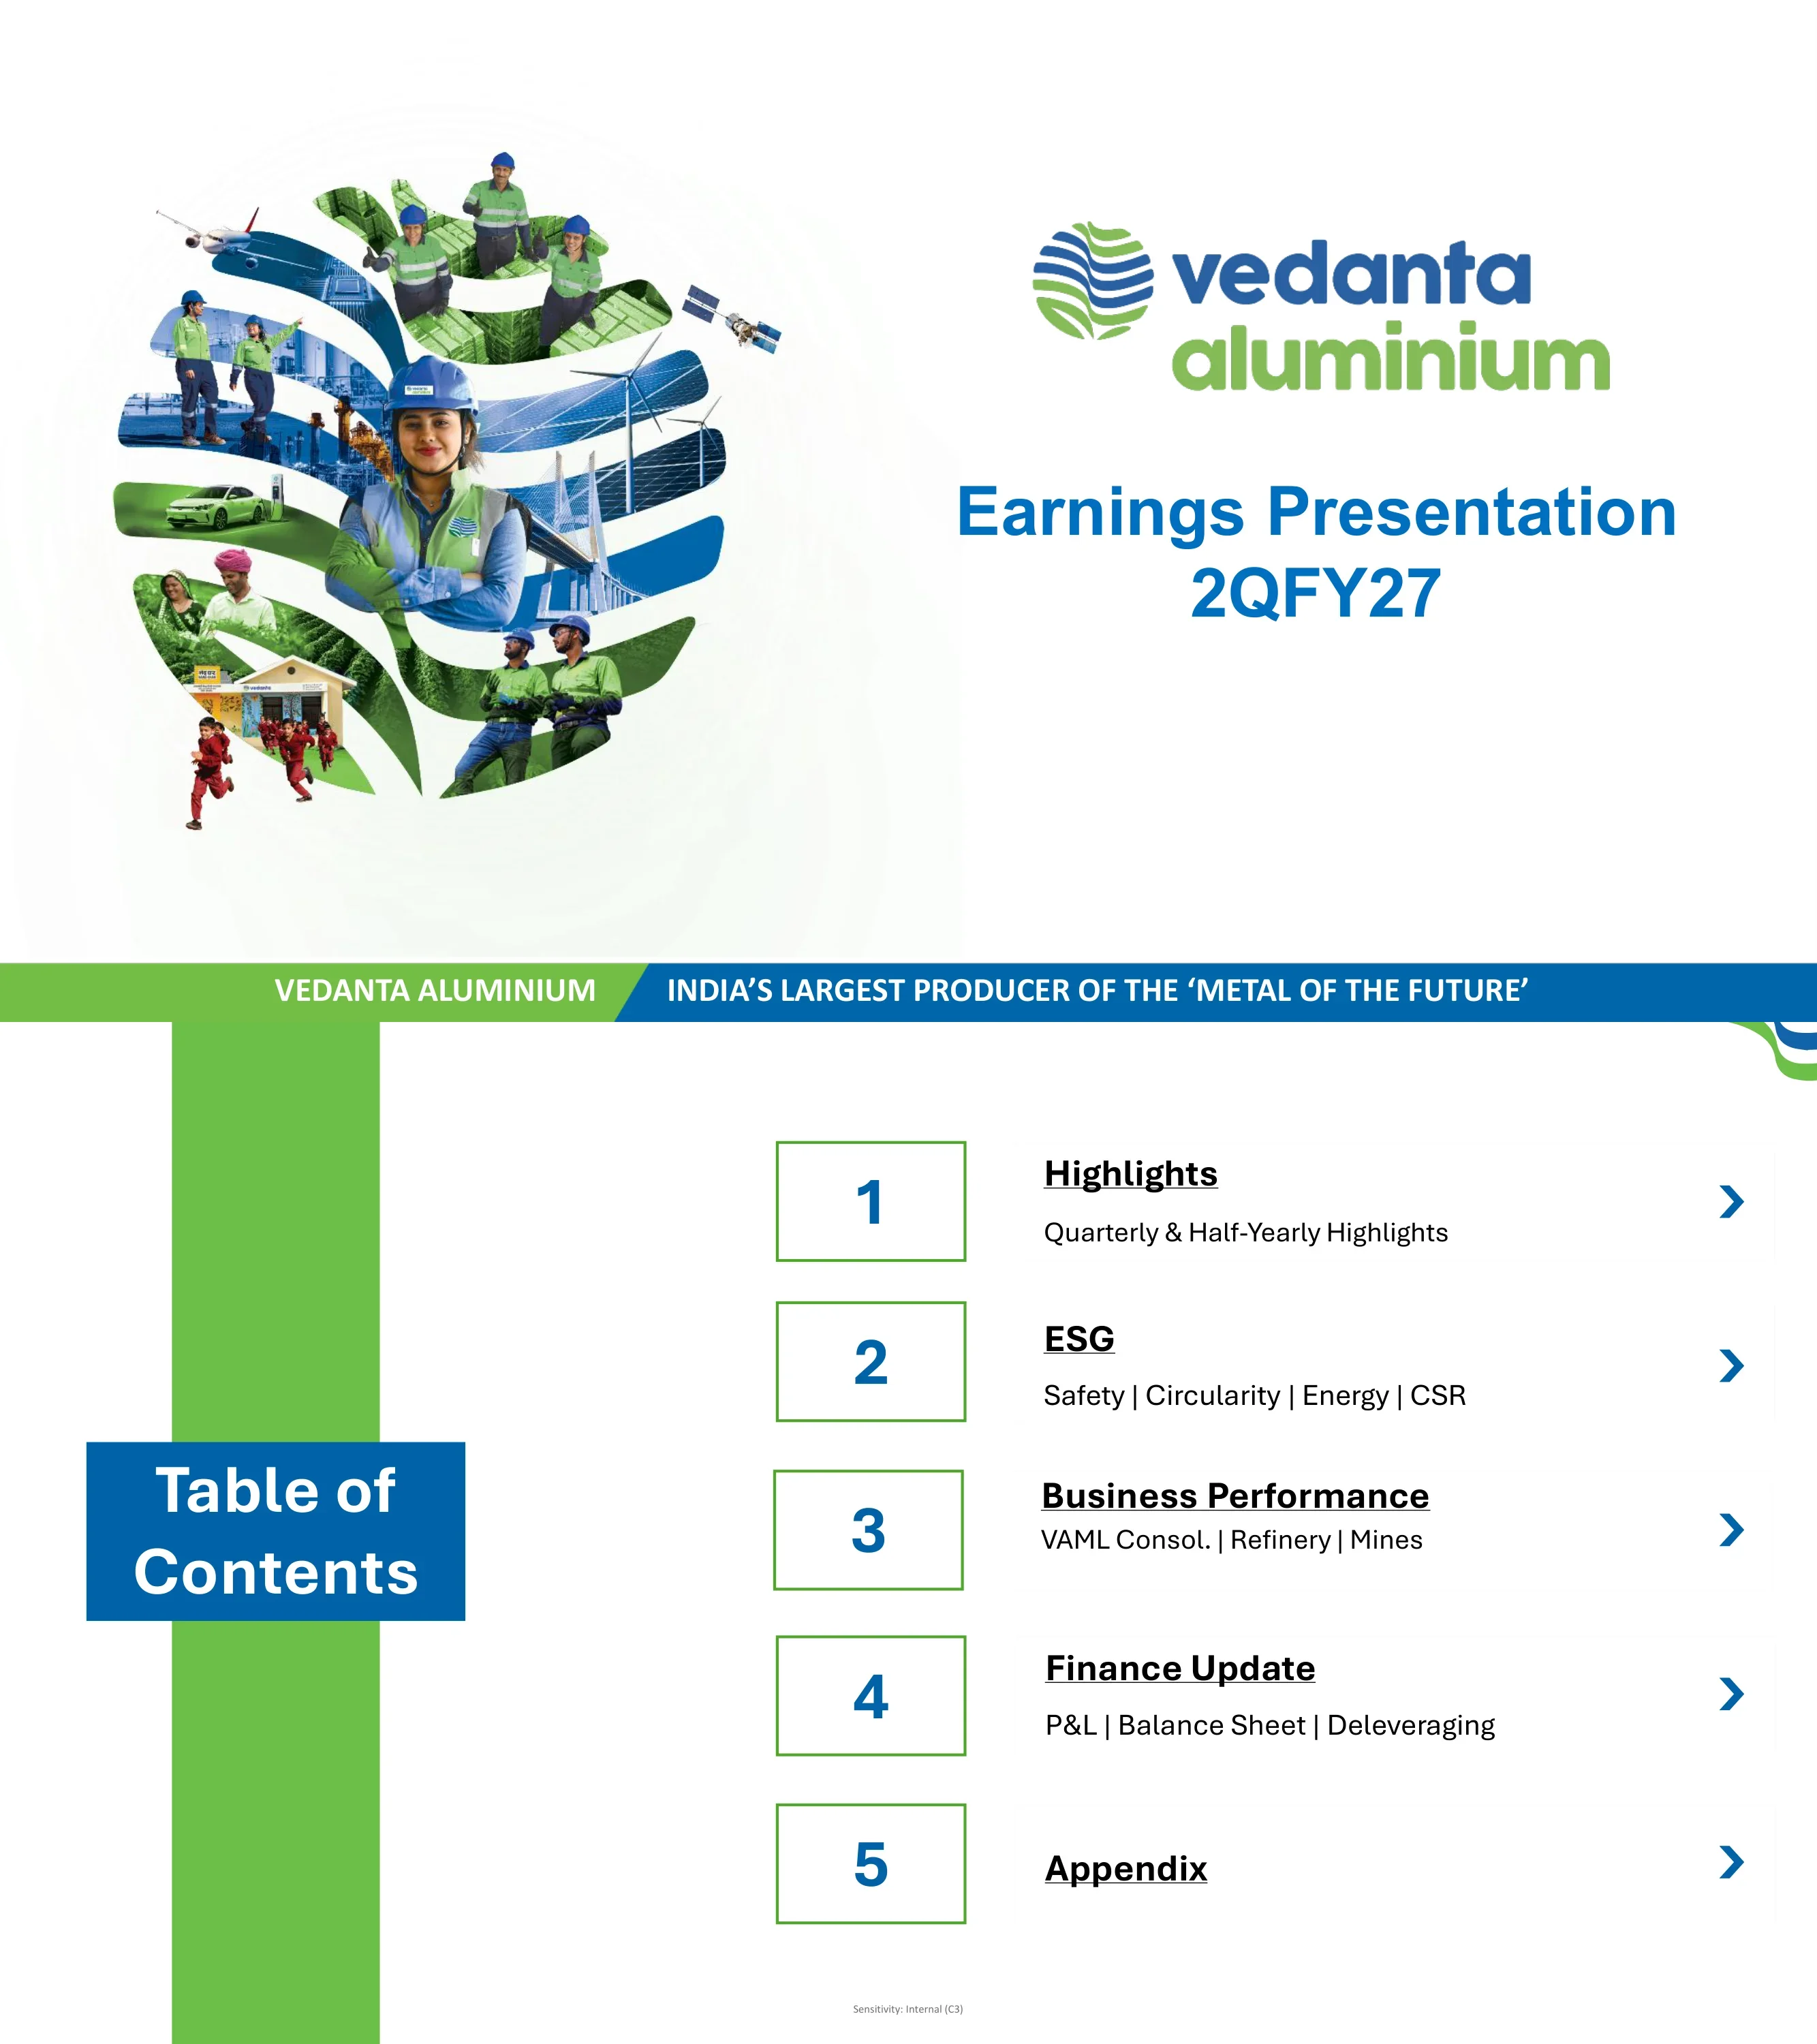
Cover slide with the vedanta aluminium logo and the title 'Earnings Presentation 2QFY27'. A footer band reads 'Vedanta Aluminium — India's largest producer of the metal of the future'.
Split layout: large circular photo collage on the left (workers in hard hats, solar panels, wind turbines, EV, aircraft, bridge, satellite, community scenes), logo and title right-aligned, two-tone green/blue footer band.
Five sections: 1 Highlights (quarterly & half-yearly highlights); 2 ESG (safety, circularity, energy, CSR); 3 Business Performance (VAML consolidated, refinery, mines); 4 Finance Update (P&L, balance sheet, deleveraging); 5 Appendix.
Vertical green bar on the left with a blue 'Table of Contents' label box; five numbered, green-outlined boxes on the right with underlined section titles, subtitles and chevron arrows.
Section opener for the Highlights section, labelled 'Highlights 2QFY27'.
Left-aligned title on white with wave-shaped navy and lime-green background bands; three circular photo crops on the right (a smiling worker with a respirator, control-room staff, aluminium logs/billets).
Nine KPI tiles for 2QFY27: metal production 649 KT (+3% QoQ, +5% YoY); hot metal CoP 1,722 $/T (+1% QoQ, -6% YoY); EBITDA margin ~46% (-356 bps QoQ, +1056 bps YoY); revenue ₹22,066 Cr (+5% QoQ, +41% YoY); EBITDA ₹10,192 Cr (-3% QoQ, +83% YoY); PAT ₹6,187 Cr (-6% QoQ, +105% YoY); cash & cash equivalents ₹6,318 Cr (robust liquidity); net debt/EBITDA 0.7x (TTM) vs 0.9x in 1QFY27, with net debt reduced by ₹3,090 Cr from 1QFY27; VAML credit rating upgraded to AA+ (Stable) by India Ratings & Research. Side bullets: highest-ever quarterly aluminium production at 649 KT; second zone of the 435 KTPA project operationalised; record quarterly alumina production at 895 KT; BALCO declared preferred bidder for the Karlapat bauxite block; CTO obtained for the Sijimali bauxite block.
Blue left panel with the slide title and italic white bullets; 3×3 grid of KPI tiles on the right, each with a green header pill, a large blue figure and QoQ/YoY change lines separated by thin rules.
Half-year (1HFY27) KPI tiles: metal production 1281 KT (+5% YoY); hot metal CoP 1711 $/T (-5% YoY); EBITDA margin ~48% (+1464 bps YoY); revenue ₹43,171 Cr (+43% YoY); EBITDA ₹20,691 Cr (+106% YoY); PAT ₹12,784 Cr (+147% YoY); rewarding shareholders ₹8/- per share, YTD dividend yield of ~2%; ROCE 60% (TTM), in line with strong profitability; VAML credit rating reaffirmed at AA+ (Stable) by ICRA & CRISIL. Side bullets: highest-ever half-yearly aluminium production at 1281 KT; record half-yearly alumina production at 1721 KT; mining lease and mine opening permission for the Kuraloi (A) North coal block.
Same template as page 4: blue sidebar with italic bullets and a 3×3 KPI tile grid with green header pills and YoY-only change lines.
Section opener for ESG.
Two-tone title text (green 'Environment', blue 'Social, & Governance') on a pale gradient background; diagonal photo panels on the right showing schoolchildren, a mother and child beside a Vedanta vehicle and a woman holding harvested vegetables.
Safety metrics Q1 FY27 vs Q2 FY27: LTIs 1 → 10 (+9, deteriorated); LTIFR 0.04 → 0.48 (+0.44, increased); HIPOs 6 → 7 (+1, increased). LTIFR trend line Q1'26 0.22, Q2'26 0.18, Q3'26 0.23, Q4'26 0.2, Q1'27 0.04, Q2'27 0.48. Fatality status table: zero employee fatalities in every quarter from Q2 FY26 to Q2 FY27; one business-partner fatality in Q2 FY26 and one in Q2 FY27. Management message: safety remains the foremost priority with strengthened leadership accountability; target outcome is to sustain zero harm while reducing high-risk exposure. Zero Harm priorities (vehicle-pedestrian safety, chemical exposure control, molten material safety, isolation & LOTO excellence, fire prevention, structural stability, power plant & structural integrity) and four fatality-prevention priorities (Critical Risk Management, Process Safety Management, Business Partner Engagement, Leadership Safety Walks).
Three metric cards across the top, a line chart in the middle, a fatality table bottom-left, a pale-green management-message box bottom-centre, and a right-hand column listing priorities with icons and numbered green circles.
Five KPI cards: fly ash utilisation 78% (monsoon impact; 68% in Q2 last year); RE-RTC consumed 415 MW renewable power in Q2; trees planted 63K+ in Q2; water recycling 17.81% circular water use; specific GHG emissions 16.42 tCO2e/t in Q2 FY27 with RE share at 9%. Dyke space (Q2): VAML-J 30 days, BALCO 105 days, VAML-L 519 days. Trend charts Q2 FY26–Q2 FY27: % utilisation of ash 68, 118, 135, 120, 78; specific freshwater consumption (m3/T) 33.26, 33.71, 34.49, 31.83, 28.64; specific GHG emissions 16.47, 16.6, 16.27, 16.54, 16.42 tCO2e/t with RE share 7.3%, 6.4%, 8.4%, 7.7%, 9%.
Row of five cards with coloured left accent bars (orange, green, blue), a one-line dyke-space note, then three rounded chart panels: column chart, line chart and combo bar-plus-line chart; latest-quarter data points highlighted in orange.
Renewable power progression: Q1 FY27 321 MW → H1 FY27 367 MW → FY27 400+ MW. Environment: 78% fly ash utilisation in Q2, 415 MW RE-RTC consumed in Q2, 63K+ trees planted in Q2, 17.81% water recycling. Social: 1.3 L+ (lakh) beneficiaries, 300+ community assets, 893 Nand Ghars, 50+ LGBTQ+/TGs. Governance: zero liquid discharge, tailing facilities GISTM-compliant, cybersecurity ISMS (ISO/IEC 27001) & BCMS (ISO 22301) compliant.
Top: three-step horizontal progression with renewable-energy icons and blue arrows. Bottom: three rounded cards (Environment blue, Social green, Governance orange) each with a vertical colour bar and shaded metric rows.
Banner: 'We, at Vedanta are committed to nurturing & empowering the community in transforming their lives through sustainable & inclusive growth'. Eight CSR areas: Community Assets (community centre, hospital, halls, parks, roads, drains); Women Empowerment (self-help groups, micro-enterprises, market linkages); Health Initiatives (MHUs, ambulances & mortuary van, hospitals in Western Odisha, Balco Medical Centre); Skill Development (skill centres, vocational upskilling, banking & finance); Education (Nand Ghar, digital education, first English school in Lanjigada); Agriculture (water structures, irrigation, multi-cropping, fruit orchards); Sports Initiatives (archery training, sport kits, youth tournaments); Art & Culture (Kosa silk weavers, handloom training centres, sales via Amazon, Flipkart, social media, local markets and Udyog mela).
Navy banner across the top; four photo-plus-text rows on each side, mirrored left/right; central circular collage titled 'Transforming Communities for Good'.
Six flagship initiatives: Community Assets — 7 model villages across Jharsuguda, community centre, hospital in Western Odisha, roads, parks; Develop Local Handloom — national-level Kosa silk capability at BALCO and scaling Sambalpuri handloom in Jharsuguda; State of Art Archery — world-class archery training infrastructure at Lanjigada and BALCO; Water Shed Management — irrigation and water conservation at Lanjigada with recharge potential of 20 lakh cu.m.; Nand Ghar — target of 200 Nand Ghars across the aluminium sector's assets, anchoring early childhood care and women's empowerment; Largest Honey FPO in India — building India's largest farmer producer organisation in honey, anchored by 1,500 farmers.
2×3 grid of rounded tinted cards (green, blue, orange tints) with coloured left bars, a line icon on the left and an uppercase heading with body text.
Section opener for Business Performance.
Large two-tone title on the left (blue 'Business', green 'Performance') fading into a full-bleed aerial photo of a power plant with cooling towers and chimneys; blue wave in the bottom-right corner; white logo top-right.
Aluminium production (kt), stacked Jharsuguda + BALCO: Q2FY'26 617 (467 + 150), Q1FY'27 632 (464 + 168), Q2FY'27 649 (470 + 178), +5% y-o-y; H1FY'26 1222 (927 + 295), H1FY'27 1281 (934 + 347). Aluminium CoP and margin ($/t): 2Q FY26 CoP 1,826 / margin 955 (excluding a one-off); 1Q FY27 CoP 1,698 / margin 1,804; 2Q FY27 CoP 1,722 / margin 1,646; 1H FY26 CoP 1,796 / margin 922 (excluding a one-off); 1H FY27 CoP 1,711 / margin 1,722. Key highlights: highest-ever quarterly and half-yearly aluminium production at 649 KT and 1,281 KT (+5% YoY each); record value-added production at 432 KT (+31% YoY) and 821 KT (+22% YoY); quarterly hot metal CoP at 1,722 $/t, up 1% QoQ; best-ever half-yearly EBITDA margin at 1,722 $/t. Other highlight: CTO obtained for the Sijimali bauxite block.
Left half: stacked column chart on top and dual-line chart below, with half-year periods shaded in a separate panel. Right half: gradient divider bars and pale hatched text panels for key and other highlights.
Alumina production (kt): 2Q FY26 653, 1Q FY27 826, 2Q FY27 895 (+37% y-o-y), 3Q FY27 target 1000+ (dashed box); 1H FY26 1240, 1H FY27 1721. Alumina CoP ($/t) and domestic bauxite mix: 2Q FY26 379 / 52%, 1Q FY27 373 / 46%, 2Q FY27 378 / 37%; 1H FY26 379 / 58%, 1H FY27 376 / 41%. Highlights: highest-ever quarterly and half-yearly alumina production at 895 KT (+37% YoY) and 1,721 KT (+39% YoY); targeting 1000+ KT in Q3FY27 and a Mar'27 exit rate of 4.7 MTPA; alumina purity at 98.80% in H1FY27; domestic bauxite mix at 37% in Q2FY27 due to increased production volumes and consumption lag, targeting 90%+ domestic mix as the company exits the year.
Same two-chart-plus-highlights layout as page 13: column chart with a dashed target bar, dual-line chart (grey CoP, orange bauxite mix), shaded half-year panels, right-hand text panel with nested bullets.
Mine milestones table: Sijimali Bauxite Mine — mining lease executed, Consent To Operate obtained, target commissioning H2FY27; Kuraloi Coal Mine — mining lease executed, mine opening permission obtained, target Q3FY27; Ghogharpalli Coal Mine — environmental clearance recommended, forest clearance targeted within Q3FY27, target H2FY27.
Mine-cart icon with 'Bauxite & Coal Mines' label on the left; three-column table (Mine, Key Milestones, Target Commissioning) with a blue header and green outline; milestone keywords coloured green (done) or yellow (pending).
Section opener for the Finance Update.
Same template as page 3: left-aligned title on white with navy/green wave bands; circular photos of a team in hard hats in front of a cooling tower, three workers beside aluminium billets, and control-room staff.
2QFY27 waterfall in $/t: LME 3,226 + strategic hedging 168 + premium 452 = realisation 3,510; less hot metal cost 1722 $/t (alumina 739, power 493, other hot metal 490) and conversion & other 143, giving EBITDA 1,646. Comparison row for 2QFY26: LME 2,618, hedging 3, premium 248, realisation 2,868, alumina (824), power (565), other hot metal (437), conversion & other (87), EBITDA 955 (excluding a one-off), with hot metal cost 1826 $/t. Callout: margin improved 72% YoY.
Full-width waterfall chart with blue totals, green additions and grey deductions; hot metal cost components grouped in a hatched green band with a brace; prior-year values in a grey table row beneath; rounded callout on the right linking the two EBITDA figures.
EBITDA bridge in ₹ Cr: Q2 FY26 5,582 + LME 2,475 (44%) + exchange rate 1,405 (25%) − commodity 141 (-3%) = rebased EBITDA 9,321; + volume 214 (4%) + cost & marketing 1,210 (22%) − one-off & others 553 (-10%) = Q2 FY27 10,192. Market factors 67%, operational factors 26%; total +83%.
Waterfall chart with blue start/rebased/end bars, green increases and grey decreases; braces labelling market vs operational factor groups; dotted-box percentage contributions beneath each bar; overall +83% in an ellipse connected by arrows from start to end.
Sequential EBITDA bridge in ₹ Cr: Q1 FY27 10,499 − LME 986 (-9%) + exchange rate 137 (1%) + commodity 312 (3%) = rebased EBITDA 9,962; + volume 553 (5%) − cost & marketing 319 (-3%) − one-off & others 5 = Q2 FY27 10,192. Market factors -5%, operational factors 2%; total -3%.
Identical waterfall template to page 18, with the overall -3% change shown in the top ellipse.
Net debt in ₹ Cr: Q1 FY27 29,532 (standalone ₹30,699; BALCO (₹1,167)) − cash flow from operations 7,620 + working capital 31 + capex 1,546 (including sustaining capex) + dividend 3,124 − others 171 = Q2 FY27 26,442 (standalone ₹28,920; BALCO (₹2,478)). Net debt reduction of 3,090; free cash flow ₹6,043 Cr.
Waterfall chart with tall blue opening and closing bars carrying standalone/BALCO split labels, a green bar for operating cash flow, grey bars for uses; brace beneath labelling FCF; reduction amount in a top ellipse.
Strong liquidity with cash and cash equivalents at ₹6,318 crore; interest expense ~8.8% (YTD average); average term-debt maturity ~4.1 years; credit ratings ICRA AA+ (Stable), CRISIL AA+ (Stable), India Ratings AA+ (Stable). Gross debt table: Q2 FY27 term debt $3.4bn / ₹32.8 thousand cr, total consolidated debt $3.4bn / ₹32.8 thousand cr, cash $0.7bn / ₹6.3 thousand cr, net debt $2.8bn / ₹26.4 thousand cr; Q1 FY27 term debt $3.5bn / ₹33.3, WC/short-term borrowing $0.2bn / ₹2.3, total debt $3.8bn / ₹35.6, cash $0.6bn / ₹6.1, net debt $3.1bn / ₹29.5. Debt breakup ($3.4bn): 89% INR, 11% USD/foreign currency in both quarters. Long-term debt maturities: ₹32.8K crore ($3.4 bn) as of Sep 30, 2026; ₹7,000+ Cr debt refinanced in Q2FY27. Maturity chart ('000 ₹ Cr): FY27 3.5, FY28 3.9, FY29 3.3, FY30 4.5, FY31 & beyond 17.5.
Top half: bulleted key points on the left and a gross-debt table on the right with blue/grey column headers and green-shaded total rows. Bottom half: maturity text on the left and a five-bar column chart on the right.
₹ crore, Q2'FY27 / Q1'FY27 / Q2'FY26: revenue from operations 22,066 / 21,105 / 15,670; EBITDA 10,192 / 10,499 / 5,582; D&A (802) / (775) / (699); finance cost (911) / (1,001) / (949); investment income 246 / 158 / 113; exchange gain/loss & others 21 / (49) / (14); PBT before exceptional items 8,747 / 8,832 / 4,033; tax charge (2197) / (2235) / (1021); PAT before exceptional items 6,550 / 6,597 / 3,012; exceptional items net of tax (363) / - / -; PAT 6,187 / 6,597 / 3,012. Commentary: D&A ₹802 crore, up 4% QoQ and 15% YoY on project capitalisation and routine capex; finance cost ₹911 crore, down 9% QoQ and 4% YoY on lower average borrowings, partly offset by lower capitalisation; ETR ~25%; PAT up 105% YoY driven by EBITDA delivery.
Left column of blue sub-headed bullet commentary; right column a light-blue banded P&L table with alternating blue/grey column headers for the three quarters.
Enterprise value and selected technologies across VAML operations. AI in refinery & power plant: IoT predictive maintenance, robotic boiler inspection, AI conveyor-belt monitoring, turbine predictive health monitoring, AI asset analytics, energy performance monitoring. Technology-enabled smelter: integrated OT with sensors, SCADA, MES & historian; AI-recommended AlF3 dosage; digital twin for pot health; AI-enabled clad failure detection; SST monitoring using IoT; ladle thermography. Digital in enabling functions: humanoid-based safety learning and SOP guidance, AI zero-based costing & procurement intel, 100% domestic sales through eCommerce store VMB, agentic AI for finance, digital logistics control towers. Stats: 100+ digital & AI go-lives in H1FY27; $4Bn eStore GMV (VMB); 200+ AI projects in the WIP pipeline; $87 Mn annualised benefit from identified projects.
Three photo-topped cards with bulleted capabilities and green accent edges, plus a right-hand stack of four stat cards with coloured top bars (yellow, red, purple, teal).
Headline stats: 3 MTPA (post projects/debottlenecking) | 6 MTPA (project plan under WIP) aluminium capacity; $1,550–1,600/t hot metal cost; 90%+ value-added product; #2 globally in S&P Global CSA rank among aluminium companies. Global positioning chart, primary aluminium MTPA ex-China: RUSAL 4.1, Rio Tinto 3.4, Alcoa 3.2 (post acquisition of South32 assets), VAML 3.0, EGA 2.7; industry cost-curve sketch with quartiles I–IV showing VAML moving from the top quartile to the 1st decile. Integration chain: bauxite 9-12 MTPA, coal 40+ MTPA, alumina 5 MTPA refinery capacity, value-added products 90%+ mix. Value-creation levers: ROCE & capital efficiency; earnings-led higher cash flow; India growth exposure (leading domestic primary aluminium market share, positioned for ~40% demand growth from CY2025 to CY2030); low-carbon differentiation (India's 1st low-carbon portfolio, Restora; renewable PDAs of ~1.3 GW).
Four headline stats under coloured top rules; three large rounded panels below: bar chart + cost curve, numbered vertical value-chain steps, and four lever cards with coloured left bars.
Section opener for the Appendix.
Large blue 'Appendix' title on white with green/navy corner shapes; aerial photo of the refinery complex with green fields and hills fading in from the right; logo top-right.
Operating and financial summary ('000 tonnes or as stated), 2QFY27 / 2QFY26 / %YoY / 1QFY27 | 1HFY27 / 1HFY26 / %YoY: alumina (Lanjigarh) 895 / 653 / 37% / 826 | 1,721 / 1,240 / 39%; total aluminium production 649 / 617 / 5% / 632 | 1,281 / 1,222 / 5% (Jharsuguda 470 / 467, BALCO 178 / 150). Financials (₹ crore): revenue 22,066 / 15,670 / 41% / 21,105 | 43,171 / 30,227 / 43%; EBITDA BALCO 2,970 / 1,895 / 57%; EBITDA Vedanta Aluminium 7,229 / 3,682 / 96%; EBITDA consolidated 10,192 / 5,582 / 83% / 10,499 | 20,691 / 10,062 / 106%. Alumina CoP 378 $/MT (₹36,090/MT); aluminium CoP 1,722 $/MT (₹164,560/MT); Jharsuguda CoP 1,699 $/MT; BALCO CoP 1,783 $/MT; LME 3,226 $/MT vs 2,618 (+23%) and 1H 3,393 vs 2,535 (+34%). Sales: value-added products 433 kt (+30% YoY), ingots 216 kt (-25%), total aluminium sales 649 kt (+4%); 1H totals 815 / 459 / 1274 kt. Footnotes: figures include trial volume; VAP figures restated for prior periods.
Dense two-block data table: quarter columns with blue header, half-year columns with grey header; CoP rows tinted yellow, key rows tinted light blue; bold consolidated rows.
Capex in progress (Rs Cr) — approved / spent up to FY26 / spent in 1H FY27 / spent till date / unspent as on 30 Sep'26: coal & bauxite mines (Kuraloi, Ghogharpalli, Radhikapur, Sijimali; excludes upfront payment as per PDA) 7,146 / 1,584 / 404 / 1,988 / 5,158; Lanjigarh refinery 2 to 5 MTPA 6,585 / 5,935 / 169 / 6,104 / 481; BALCO smelter and VAP capacity expansion 11,816 / 10,506 / 519 / 11,025 / 791; total 25,547 / 18,025 / 1,092 / 19,117 / 6,430. FY26 milestones: BALCO smelter expansion (commissioning initiated for 435 KTPA); Lanjigarh expansion 3.5 to 5 MTPA (Train-2). FY27 milestones: completion of VAP projects; Sijimali bauxite mine 2HFY27; Kuraloi coal mine 3QFY27; Ghogharpalli coal mine 2HFY27.
Green-bordered capex table with a dark-teal highlighted 'Approved Capex' column; below, a two-column FY26 vs FY27 milestone table with blue headers.
FY27 guidance: alumina 4.0 - 4.1 MnT; aluminium 2.6 - 2.7 MnT (including trial run production); CoP $1,650-$1,700/t (hot metal CoP; anticipated additional impact due to war in H1FY27 of 50-100 $/t). Sensitivity: ₹1 depreciation in USD/INR increases EBITDA by ~₹675-725 crore/year; a 100 $/t movement in LME aluminium (Q2FY27 at 3226 $/t) impacts EBITDA by ~₹2175-2225 crore/year.
Traffic-light icon labelled Guidance beside a rounded two-column guidance box; bar-chart icon labelled Sensitivity beside two bordered tables with blue header rows.
Earnings conference call on October 28, 2026 from 5:00 PM to 6:00 PM (IST). Universal dial-in numbers in Mumbai, an India national toll-free number and international toll-free numbers for Canada, Hong Kong, Japan, Netherlands, Singapore, South Korea, UK and USA; an online registration link; call recording to be available on the company website on October 28, 2026.
Plain bordered table with a light-blue header row (Event, Telephone Number) and merged cells listing dial-in numbers by country.
Questions courantes sur cette diapositive et le contenu de présentation sous-jacent.
It is the 29-page results deck of Vedanta Aluminium Metal Ltd (VAML) for 2QFY27, the quarter ended September 30, 2026, filed with BSE on October 28, 2026. It covers Q2 and 1H highlights, safety and ESG, CSR, business performance of the smelters, Lanjigarh refinery and mines, EBITDA bridges, net debt, the income statement, digital/AI, capex and FY27 guidance.
The deck reports highest-ever quarterly aluminium production of 649 KT, record alumina production of 895 KT, revenue of ₹22,066 Cr (+41% YoY), EBITDA of ₹10,192 Cr (+83% YoY) at a ~46% margin, PAT of ₹6,187 Cr (+105% YoY), hot metal cost of production of 1,722 $/t and net debt/EBITDA of 0.7x (TTM).
Indian companies use an April–March fiscal year, so FY27 runs from April 2026 to March 2027; 2QFY27 is July–September 2026 and 1HFY27 is April–September 2026. Financial figures are in ₹ crore (Cr), unit costs and margins in US$ per tonne, and production in thousand tonnes (KT).
VAML is the aluminium business demerged from Vedanta Limited and separately listed (BSE 544780). It holds the Jharsuguda smelter, the Lanjigarh alumina refinery and the stake in BALCO. Vedanta Limited's own Q2 FY27 earnings presentation is published separately in the gallery at /gallery/vedanta-q2-fy27-earnings-presentation.
Yes. The deck was filed with BSE (and NSE) as part of the company's corporate disclosures on October 28, 2026; the original PDF is available from the BSE corporate filings site. Cover letter pages from the filing have been removed here so the gallery shows only the presentation slides.
Slide 28 guides FY27 alumina at 4.0 - 4.1 MnT, aluminium at 2.6 - 2.7 MnT including trial-run production, and hot metal CoP of $1,650-$1,700/t, with an anticipated additional war-related impact of 50-100 $/t in H1FY27. It also gives sensitivities: ~₹675-725 crore/year EBITDA per ₹1 move in USD/INR and ~₹2175-2225 crore/year per 100 $/t move in LME aluminium.
Yes. Both the original PDF and an editable PPTX converted from it are available on this page. The PPTX keeps the slide layouts — KPI tile grids, waterfall EBITDA bridges, net-debt walk, data tables — so you can reuse the structure for your own earnings or board presentation; some charts may convert as images.
The 3×3 KPI dashboards on pages 4–5, the EBITDA bridge waterfalls on pages 18–19, the $/t profitability waterfall on page 17, the net debt walk on page 20 and the strategy summary on page 24 are strong reusable patterns for any results or investor presentation.
Original filing of the presentation with BSE on October 28, 2026, including the cover letter pages removed from this gallery version.

Create Your Own Slides
Turn your ideas into professional presentations in seconds with 2slides AI.
Référencez des conceptions professionnelles, choisissez votre style et générez des diapositives avec un rendu de texte parfait. Alimenté par Nano Banana—commencez à créer votre présentation maintenant.
Votre Agent IA pour les diapositives. Gagnez du temps, brillez plus vite avec la création intelligente de présentations.


© 2026 2slides. Tous droits réservés.