
Meta's Q2 2026 earnings presentation — an 18-slide quarterly deck covering total revenue of $60.8 billion (up 28% year over year), advertising revenue of $59.4 billion split by user geography, Family of Apps and Reality Labs segment results, an operating margin that fell to 31% as research and development rose to 36% of revenue, net income of $15.8 billion and diluted EPS of $6.18, capital expenditures that nearly doubled to $31.1 billion in the quarter, Family daily active people of 3.60 billion, average revenue per person of $16.86, and a free cash flow reconciliation that lands at $784 million.
Navigation rapide
Étiquettes
Partager les diapositives
Meta's Q2 2026 earnings presentation — an 18-slide quarterly deck covering total revenue of $60.8 billion (up 28% year over year), advertising revenue of $59.4 billion split by user geography, Family of Apps and Reality Labs segment results, an operating margin that fell to 31% as research and development rose to 36% of revenue, net income of $15.8 billion and diluted EPS of $6.18, capital expenditures that nearly doubled to $31.1 billion in the quarter, Family daily active people of 3.60 billion, average revenue per person of $16.86, and a free cash flow reconciliation that lands at $784 million.
Vue détaillée de chaque page de diapositive, incluant la mise en page, le contenu clé et les éléments visuels.
Cover slide for Meta's second quarter 2026 earnings presentation, with the investor relations site address in the lower left.
White field with a two-line title set left of centre in a light dark-slate weight; 'investor.atmeta.com' in small type at the bottom left; the Meta infinity mark and wordmark at the bottom right. No rules, no colour blocks.
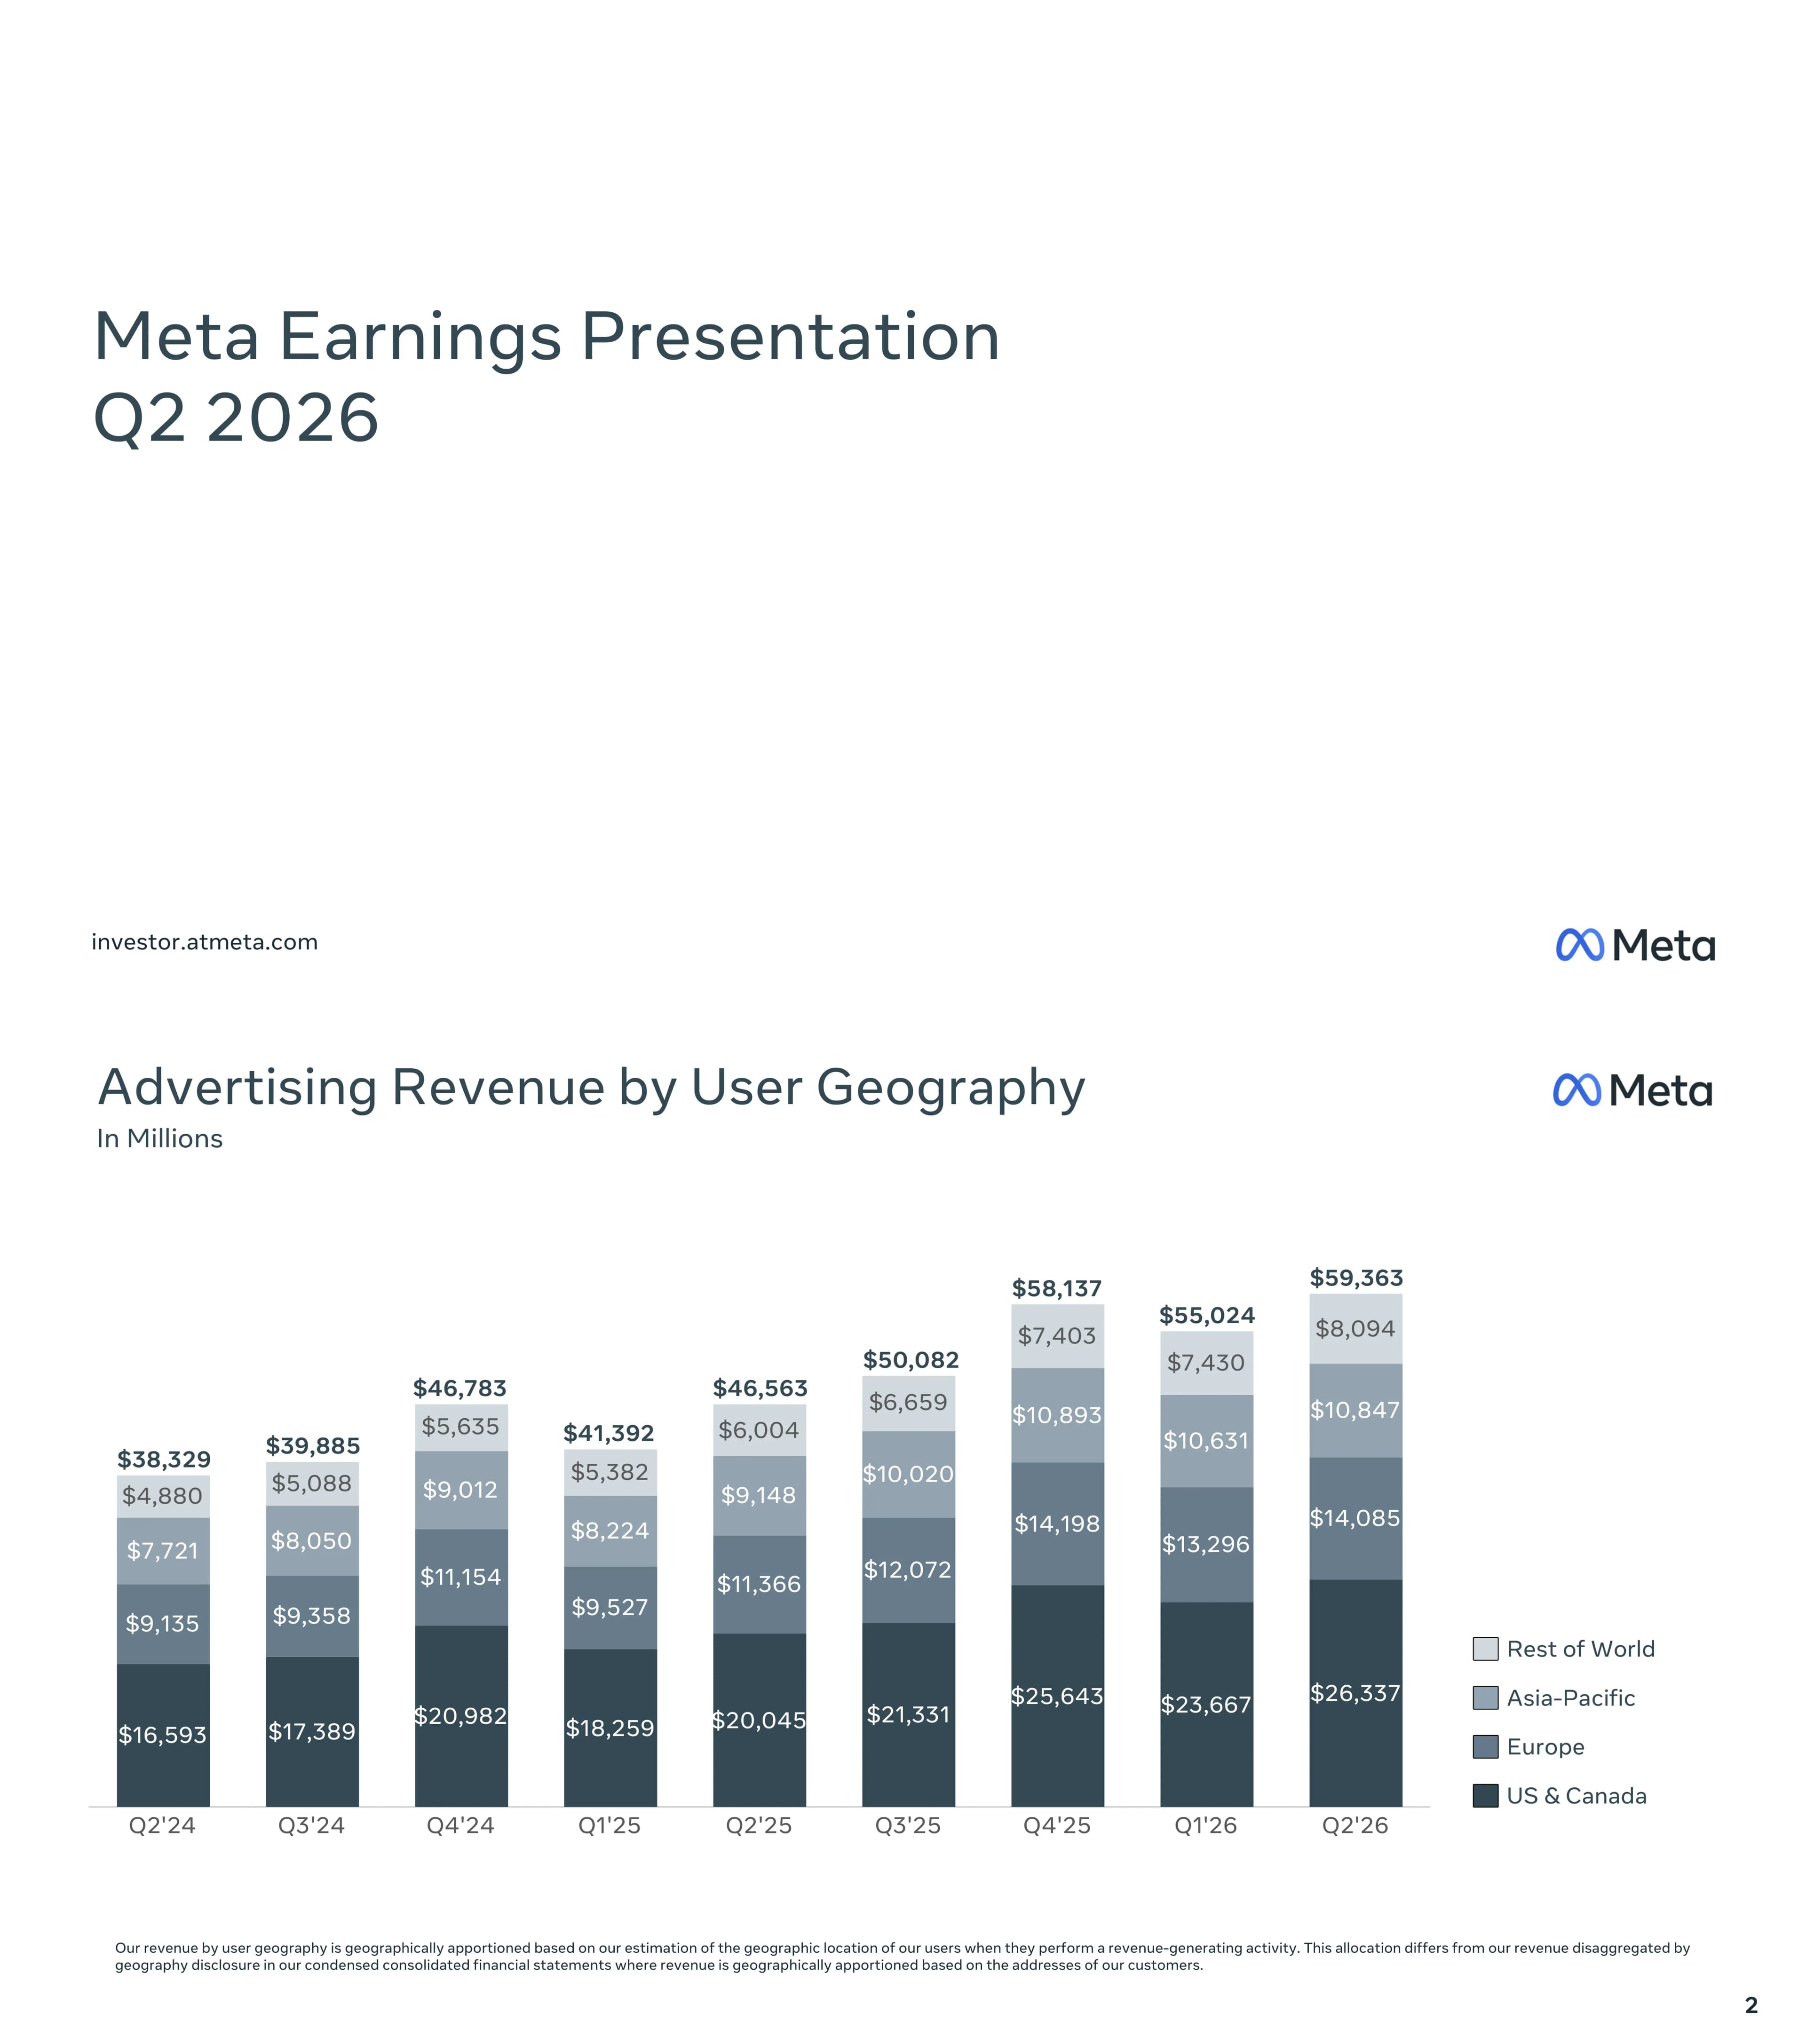
Advertising revenue of $59,363 million in Q2 2026, up from $46,563 million a year earlier, broken into US & Canada $26,337M, Europe $14,085M, Asia-Pacific $10,847M and Rest of World $8,094M. A footnote explains that revenue by user geography is apportioned by the estimated location of the user, which differs from the geographic disaggregation in the financial statements.
Nine stacked columns, one per quarter from Q2'24 to Q2'26, in four tints of slate from dark (US & Canada) at the base to near-white (Rest of World) at the top. Every segment value is printed inside its band and the column total in bold above. Legend at the right, methodology footnote across the bottom.
Total revenue of $60,801 million in Q2 2026 against $47,516 million in Q2 2025, split US & Canada $26,816M, Europe $14,296M, Asia-Pacific $11,164M and Rest of World $8,525M — the same geography view as the previous slide, but including Other revenue as well as advertising.
Identical stacked-column construction to slide 2, deliberately so: the reader compares the two slides band by band without re-learning the chart.
Nine-quarter segment table. Q2 2026: Advertising $59,363M, Other $1,007M, Family of Apps revenue $60,370M, Reality Labs revenue $431M, total revenue $60,801M. Below it, Family of Apps operating income $23,394M, Reality Labs operating loss $(4,619)M, total income from operations $18,775M and an operating margin of 31% — down from 43% in Q2 2025 and from 41% in Q1 2026. A footnote defines the two reportable segments.
Two stacked tables sharing one set of nine quarter headers. Alternating grey and white rows for the components; subtotal and total rows reversed out in dark slate with white type; the operating margin row set as the final dark band.
Expense structure across nine quarters. In Q2 2026: cost of revenue 19%, research and development 36%, marketing and sales 6%, general and administrative 9% — research and development up from 27% in Q2 2025 and 31% in Q1 2026, which is the single largest driver of the margin change on the previous slide.
Nine stacked columns in the same four-tint slate palette, each band labelled with its percentage. Columns are not normalised to the same height, so the total expense burden is visible as column height — the Q2'26 column is visibly the tallest in the series.
Nine-quarter tax table. Q2 2026: income before income taxes $18,756M, provision for income taxes $2,908M, effective tax rate 16%. Two footnotes explain the outliers in the series — a one-time non-cash charge of $15.93 billion in Q3 2025 related to the One Big Beautiful Bill Act, which pushed the reported rate to 87% against 14% excluding it, and an $8.03 billion benefit in Q1 2026 from U.S. Corporate Alternative Minimum Tax transitional relief under Treasury Notice 2026-7, which produced a reported rate of (23%) against 14% excluding it.
Three-row table with nine quarter headers, two grey data rows and the effective tax rate row reversed out in dark slate. Superscript markers on the two affected headers tie to the footnotes at the bottom.
Net income of $15,848 million in Q2 2026, against $18,337 million in Q2 2025 and $26,773 million in Q1 2026. The series includes the $2,709 million trough in Q3 2025, footnoted as reflecting the $15.93 billion one-time tax charge — without which net income would have been $18.64 billion — and the Q1 2026 peak, footnoted as including the $8.03 billion tax benefit, without which it would have been $18.74 billion.
Nine plain dark-slate columns with a value label above each, no axis lines and no gridlines. Two footnotes at the bottom carry the adjusted figures.
Diluted EPS of $6.18 in Q2 2026, against $7.14 in Q2 2025 and $10.44 in Q1 2026. Footnotes mirror the net income slide: the Q3 2025 figure of $1.05 would have been $7.25 without the one-time tax charge, and the Q1 2026 figure of $10.44 would have been $7.31 without the tax benefit.
The net income chart repeated in per-share terms — nine dark columns, labels above, two footnotes below, identical spacing.
Capital expenditures of $31,078 million in Q2 2026 against $17,012 million in Q2 2025, and $50,918 million year to date in 2026 against $30,704 million in 2025 — roughly a doubling on both bases. A footnote states that capital expenditures comprise purchases of property and equipment and principal payments on finance leases.
Four columns in two pairs, each pair labelled by a pale grey band beneath the axis reading 'Quarterly' and 'YTD'. Values above each column; no legend needed.
Family daily active people of 3.60 billion in Q2 2026, up from 3.48 billion a year earlier, with a dip to 3.56 billion in Q1 2026 footnoted as driven by internet disruptions in Iran — largely restored in the second quarter — and a restriction on access to WhatsApp in Russia. Two further paragraphs define DAP and describe the estimation methodology.
Nine dark columns on a truncated axis so the small quarter-to-quarter movements are readable, values above each bar, and three blocks of explanatory text filling the lower third of the slide.
Family average revenue per person of $16.86 in Q2 2026, up from $13.65 in Q2 2025, with the usual Q1 seasonal dip visible at $15.66. A footnote defines ARPP as Family of Apps revenue for the quarter divided by the average of DAP at the beginning and end of the quarter.
Nine dark columns with dollar labels above, a single-line definition footnote, and no legend — the simplest chart in the deck.
Year-over-year ad impression growth for five quarters, shown for five geographies: worldwide 11%, 14%, 18%, 19%, 14%; US & Canada 9%, 8%, 13%, 13%, 9%; Europe 6%, 9%, 13%, 17%, 13%; Asia-Pacific 16%, 23%, 24%, 23%, 17%; Rest of World 7%, 9%, 14%, 17%, 12% — Q2 2026 being the last value in each series.
Five small-multiple charts on one slide, arranged three across the top and two below, each with five columns, its own baseline and a grey caption band naming the geography. Identical axis treatment lets the reader scan across regions.
Year-over-year change in average price per ad over five quarters: worldwide 9%, 10%, 6%, 12%, 12%; US & Canada 11%, 13%, 9%, 14%, 20%; Europe 17%, 19%, 12%, 19%, 10%; Asia-Pacific 2%, 1%, (2)%, 5%, 1%; Rest of World 15%, 20%, 15%, 18%, 21%. Asia-Pacific is the one panel that crosses below zero.
The same five-panel small-multiple grid as the previous slide, so impressions and pricing can be read against each other panel by panel. The Asia-Pacific panel carries a negative bar below its baseline.
Section divider marking the start of the appendix.
White slide with the single word 'Appendix' set left of centre in the same weight as the cover title, and the Meta wordmark at the bottom right.
Nine-quarter reconciliation. Q2 2026: net cash provided by operating activities $31,862M, less purchases of property and equipment $30,116M, less principal payments on finance leases $962M, giving free cash flow of $784M — down from $8,549M in Q2 2025 and $12,386M in Q1 2026. A footnote sets out the limitations of free cash flow as a non-GAAP measure.
Four-row table across nine quarters: three grey data rows with two-line row labels, and the free cash flow row reversed out in dark slate. The non-GAAP caveat runs across the bottom in small type.
Text-only appendix page explaining how DAP and ARPP are calculated, the judgment involved, why estimates differ from third-party figures, and the roughly 3% error margin Meta estimates on worldwide DAP.
Four paragraphs of justified body text under a bold subheading, filling the upper two-thirds of an otherwise empty white slide.
Continuation of the disclosure: the machine learning models behind DAP estimates, reduced data signals for encrypted products such as WhatsApp, the estimate that less than 5% of worldwide DAP consisted solely of violating accounts in Q4 2025 after a methodology update, and the limits of inferring user geography from IP address and self-disclosed location.
Three justified text blocks with a bold 'User Geography' subheading introducing the last one. Same typographic treatment as the previous page.
Closing slide, identical to the cover.
The cover repeated exactly — two-line title left of centre, investor.atmeta.com at the bottom left, Meta wordmark at the bottom right.
Questions courantes sur cette diapositive et le contenu de présentation sous-jacent.
The full 18-slide Meta Q2 2026 earnings presentation as both PDF and editable PowerPoint, plus a page-by-page preview. The PPTX keeps charts and tables as editable objects so you can substitute your own figures.
Yes. The PDF is the file Meta published on investor.atmeta.com alongside its Q2 2026 results. The PowerPoint was converted from that PDF for editing convenience — check any layout you plan to reuse, since conversion is not always pixel-perfect.
Slide 5 answers it directly. Research and development rose to 36% of revenue in Q2 2026 from 27% a year earlier, while the other three expense lines barely moved. Total income from operations was $18,775 million against $20,441 million a year earlier, despite $13.3 billion more revenue.
Two one-off tax items, both footnoted in the deck. Q3 2025 carried a one-time non-cash charge of $15.93 billion tied to the One Big Beautiful Bill Act, dropping net income to $2.7 billion. Q1 2026 carried an $8.03 billion benefit from Corporate Alternative Minimum Tax transitional relief, lifting it to $26.8 billion. Excluding both, the underlying figures were $18.64 billion and $18.74 billion.
They nearly doubled: $31.1 billion in the quarter against $17.0 billion a year earlier, and $50.9 billion year to date against $30.7 billion. That is what drives free cash flow down to $784 million on slide 15, even though operating cash flow rose to $31.9 billion.
It is one of the better templates for a data-heavy quarter. The pattern is worth copying: nine quarters on every chart, one metric per slide, small multiples when you need to show the same metric across five regions, and a footnote quantifying every one-off item rather than a non-GAAP headline.
A single dark slate against white, with three lighter tints reserved for stacked bands. No gridlines, no axis clutter, value labels printed directly on the bars, and total rows reversed out in the tables so the eye finds them without bold type. It reads at a glance and photographs well in a research note.
Most charts run nine quarters, Q2 2024 through Q2 2026. The two ad-metric small-multiple slides show five quarters, Q2 2025 through Q2 2026. Meta's fiscal year matches the calendar year, so Q2 2026 is the quarter ended June 30, 2026.
Original PDF published by Meta alongside the Q2 2026 results.

Create Your Own Slides
Turn your ideas into professional presentations in seconds with 2slides AI.
Référencez des conceptions professionnelles, choisissez votre style et générez des diapositives avec un rendu de texte parfait. Alimenté par Nano Banana—commencez à créer votre présentation maintenant.
Your AI Agent for slides. Save time, shine faster with intelligent presentation creation.




© 2026 2slides. All rights reserved.