
Fait partie de Exemples de présentations de cabinets de conseil
KPMG Global Tech Report 2026 ("Leading in the Intelligence Age: Excelling today, shaping tomorrow") by KPMG International, published January 2026: a 29-page consulting research report deck built on a 2025 survey of 2,500 tech executives in 27 countries, covering tech maturity, AI adoption and ROI, adaptive tech strategy, agentic AI and the habits of the top 5% 'high performers'.
Utilise la couverture de cette présentation comme référence de style pour des diapositives créées à partir de votre propre contenu. Ou choisissez une page ci-dessous pour utiliser sa mise en page comme référence.
Navigation rapide
Étiquettes
Partager les diapositives
KPMG Global Tech Report 2026 ("Leading in the Intelligence Age: Excelling today, shaping tomorrow") by KPMG International, published January 2026: a 29-page consulting research report deck built on a 2025 survey of 2,500 tech executives in 27 countries, covering tech maturity, AI adoption and ROI, adaptive tech strategy, agentic AI and the habits of the top 5% 'high performers'.
Vue détaillée de chaque page de diapositive, incluant la mise en page, le contenu clé et les éléments visuels.
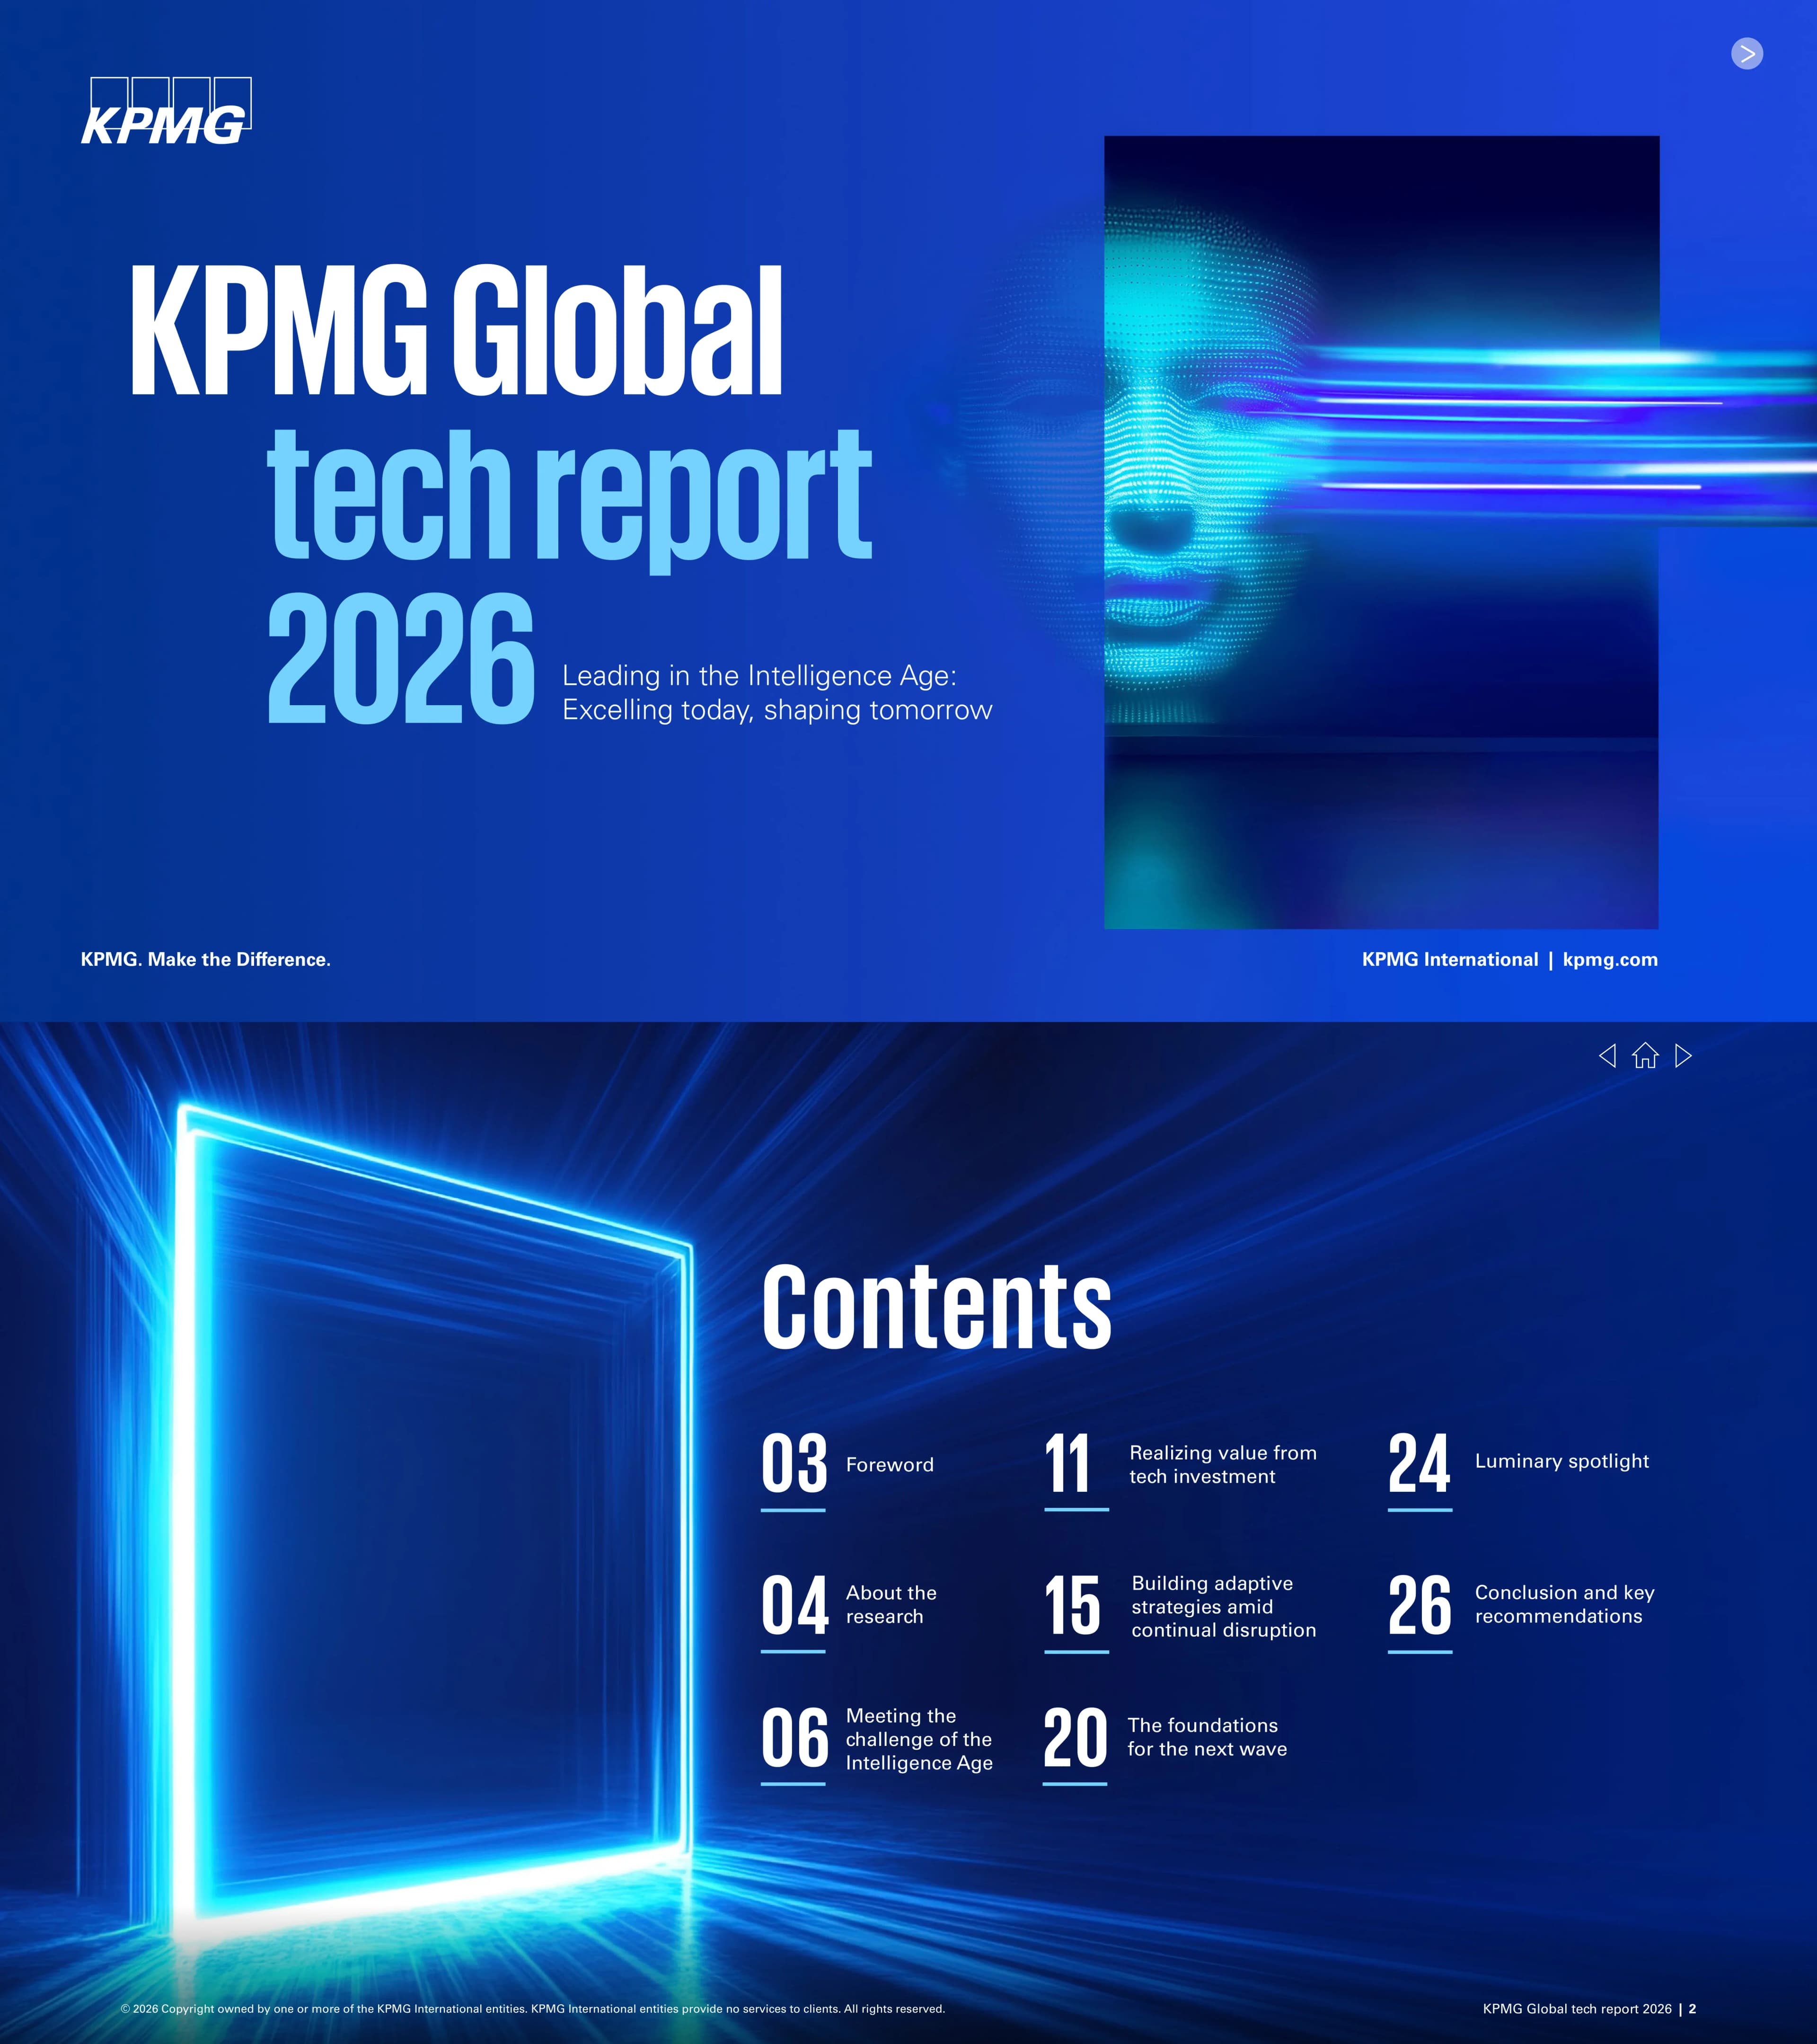
Cover slide with the report title 'KPMG Global tech report 2026' and subtitle 'Leading in the Intelligence Age: Excelling today, shaping tomorrow', branded KPMG International | kpmg.com and 'KPMG. Make the Difference.'
Full-bleed cobalt blue background; oversized stacked title on the left in white and cyan; portrait image panel on the right; logo top left and footer tagline bottom
Table of contents with eight sections and page numbers: Foreword (03), About the research (04), Meeting the challenge of the Intelligence Age (06), Realizing value from tech investment (11), Building adaptive strategies amid continual disruption (15), The foundations for the next wave (20), Luminary spotlight (24), Conclusion and key recommendations (26).
Glowing neon doorway image on the left; three-column grid of large page numbers with section names on the right
Foreword by Guy Holland, Global Leader of KPMG International's CIO Center of Excellence. Organizations are moving beyond 'AI roulette' to embedding and scaling AI; tech debt, silos and talent shortages remain barriers; half of tech executives expect to reach top maturity by 2026 but only 11% are there today; ROI varies widely and static planning is becoming obsolete.
White page with large blue heading, a full-width lead paragraph, three narrow text columns and a grey author bio box with headshot
Survey of 2,500 tech executives from 27 countries: 43% EMEA, 29% ASPAC, 28% Americas. Eight industries: financial services 31%, technology and telecom 11%, healthcare and life sciences 10%, energy 10%, consumer and retail 10%, automotive 10%, industrial manufacturing 10%, government 8%. Research conducted in 2025 with predictions for 2026 and beyond.
Blue page with a hero statistic ('2,500 tech executives from 27 countries') on the left, a regional percentage column in the middle and an industry percentage grid on the right
Respondents by role: 50% C-suite, 31% director, 10% vice president, 9% senior manager; all organizations have revenues above US$100 million. Eight interviewees listed (Dean Bortz, Google; Rohit Gupta, Auditoria.AI; Zack Kass, former OpenAI; Phil Mottram, HPE; Seth Patton, Microsoft 365 Copilot; Noelle Russell, AI Leadership Institute; Umesh Sachdev, Uniphore; Jenny Wood, Skipton Group). High performers are 5% of respondents, defined by tech maturity (top two stages in at least 5 of 10 technology categories), process maturity (highest level in at least 5 of 10 functions) and value (200%+ ROI on digital tech).
Split page: blue left half with role percentages and interviewee list; white right half with 'Meet the high performers' heading and three definition blocks separated by rules
Section opener for chapter one, 'Meeting the challenge of the Intelligence Age'.
Full-bleed photographic divider with large white and cyan headline on the left
Figure 1 shows maturity across 10 technology areas. Overall average: 11% fully scaled, 36% funded and on track, 32% funded but hitting blocks, 8% vision limited by buy-in or funding, 7% piloting, 6% no action. 79% are in the top three stages. Most likely to be fully scaled: cybersecurity 18% and modern delivery 14%. Data and analytics has 46% on track; AI and automation 10% fully scaled and 42% on track. Includes quotes from Seth Patton (Microsoft) and Zack Kass.
Narrow text column on the left; large horizontal 100% stacked bar chart with six-stage legend on the right; grey summary box with bullet findings underneath
Figure 2 compares 2025 with predicted 2026 maturity: the fully scaled share jumps from 11% to 50%, the top two stages from 47% to 83%, and the top three from 79% to 93%. Figure 3: 62% expect to improve by one maturity level, 21% expect no change, 12% expect two levels, 4% three levels and 1% four levels.
Two text columns at top; area/line chart comparing 2025 and 2026 across seven maturity stages on the left; vertical bar chart of expected maturity change on the right
53% lack the talent needed for digital transformation; 69% say speed and cost trade-offs compromise security, scalability and data standardization; 63% say the cost of fixing tech debt holds back new initiatives. Figure 4: the share deploying AI at scale with ROI across multiple use cases fell from 31% (2024) to 24% (2025) but is predicted to reach 68% in 2026. Call-out: 69% of early adopters and 65% of slow followers expect to scale AI with ROI by 2026.
Three zones: text column, 100% stacked column chart for 2024, 2025 and 2026 with legend, and a grey call-out panel with two giant percentages
Three cards: Address issues with tech debt (8% of high performers say tech debt costs frequently block new investment vs 45% of the rest); Innovate while maintaining strong cost management discipline (6% frequently miss emerging-tech opportunities vs 44%); Avoid compromising on core investments (30% compromise on security, scalability and data standardization vs 71%).
Blue page with large headline and three equal cyan gradient header cards, each followed by a bolded statistic paragraph and a short underline accent
Section opener for chapter two, 'Realizing value from tech investment'.
Full-bleed image divider with stacked white and cyan headline on the left
Average tech ROI is 200% (2x), but returns are non-linear: a quick-win zone at early maturity, slowing returns as complexity and tech debt rise (51% say legacy processes contribute to poor ROI), then acceleration with maturity. High performers reach 4.5x ROI. Segments: smaller organizations 3.6x, early adopters 2.2x (vs 1.4x for late adopters), organizations with fewer cost pressures 2.6x, transformation-focused organizations 3.2x.
Two-column page: narrative with bullet 'ROI zones' on the left; four stacked segment rows on the right, each with a description and a colored ROI multiple badge
74% say AI use cases provide business value but only 24% achieve ROI across multiple use cases; 58% say traditional ROI measures are insufficient for AI; 55% struggle to demonstrate AI value to stakeholders and shareholders. 80% of C-suite leaders report a clear organization-wide AI strategy vs 68% of senior tech managers. Uniphore example: AI agents for invoice generation lifted team throughput five to six times, followed by 20 to 30 more departments building agents within three months. Pull quote from Zack Kass.
Text column on the left; large pull quote across the top right; two text columns below with a grey 55% statistic box
Three cards: Focus on ROI (high performers 4.5x vs average 2x for the rest); Demonstrate value to the C-suite (13% of high performers lack adequate business sponsorship vs 60% of the rest); Communicate value to a broad range of stakeholders (17% struggle to communicate AI value vs 57% of the rest).
Repeats the blue three-card 'emulate' layout with cyan header cards and statistic paragraphs
Section opener for chapter three, 'Building adaptive strategies amid continual disruption'.
Full-bleed image divider with multi-line two-tone headline on the left
56% say tech plans quickly become outdated (16% of high performers); 78% still rely on established processes to evaluate emerging tech. Budget split: maintenance 35%, growth 36%, transformation 29% (rest of organizations); high performers allocate 30% maintenance, 42% growth, 28% transformation. 32% have too many disconnected AI projects; 78% centralize tech investment prioritization; 91% of high performers do so.
Three-column page: narrative with bullet budget split, a clustered column chart comparing high performers with the rest, and a decision-making narrative column
Share fully centralized in IT or IT-led federated model: prioritizing and planning tech investments 78%, selecting technologies and suppliers 78%, tech talent strategy 78%, architecture and governance guardrails 74%, live systems and platforms 72%, value and performance metrics 69%, organization-wide tech vision 64%. Dean Bortz (Google): 90% of the organization will need enablement and training. 31% plan to increase investment in centers of excellence. Pull quote from Jenny Wood, Skipton Group.
Left column of seven horizontal 100% split bars; right two-thirds with two text columns and a full-width pull quote
67% say ineffective forecasting hampers response to market shocks; 59% of high performers vs 41% of the rest plan to improve data flows for scenario planning; 78% aim to be scaling or fully scaled in digital twins by 2026. High performers are less often hit by market, regulatory or tech shifts (33% vs 65%) and more highly resilient (70% vs 36%). Figure 7 top priorities (high performers vs rest): data security 45% vs 41%, data analysis and insights 53% vs 37%, data accessibility 52% vs 36%, data-powered forecasting 47% vs 33%.
Text column on the left; paired horizontal bar chart with category descriptions on the right
Three cards: Ensure a unified AI program (2% of high performers report too many disconnected AI projects vs 34% of the rest); Consider centrally guided decision making (91% centralize tech investment prioritization vs 78%); Take people on the change journey (6% say some employees feel left behind vs 39%).
Blue three-card 'emulate' layout with cyan header cards and statistic paragraphs
Section opener for chapter four, 'The foundations for the next wave'.
Full-bleed image divider with headline on the left and imagery on the right
88% are already investing in building agentic AI into their systems; 92% say managing AI agents will be an important skill within five years; 90% plan to expand tech ecosystems and partnerships. Figure 8 core tech team FTE mix: 2025 permanent staff 48%, digital workforce 28%, contractors 24%; 2027 predicted permanent 43%, digital workforce 36%, contractors 21%. Quotes from Rohit Gupta, Dean Bortz, Zack Kass, Seth Patton, Jenny Wood and a pull quote from Umesh Sachdev.
Three-column layout: narrative, stacked 100% column chart with connecting bands for 2025 vs 2027, and pull quote plus partnership section with a blue link button
Security and IP/data protection are among the top five barriers to collaboration on emerging tech; 36% plan to enhance data sovereignty audits across partners. Cites Stanford HAI's HELM model evaluation framework. Explains Artificial General Intelligence and Artificial Superintelligence. Quantum: 41% worry they are falling behind on quantum threat preparation and post-quantum cryptography; advice to inventory encryption and plan a PQC transition. Pull quote from Noelle Russell.
Three dense text columns with a pull quote at top left and two blue call-to-action link buttons; footnote at bottom
Four cards: Invest in people (high performers expect 50% permanent human staff by 2027 vs 42% for others); Be deliberate with hiring skills (57% plan more onshore tech hiring vs 35%); Prioritize collaboration and security (85% collaborate frequently with external partners vs 73%; 49% vs 35% plan data sovereignty audits; 21 points more likely to scrutinize cybersecurity partners' location); Be bold in the face of risk (87% vs 78% agree they should take more risks on emerging tech).
Blue page with four equal cyan header cards in a row and statistic paragraphs beneath
Section opener for the luminary spotlight featuring Zack Kass, global AI advisor and former Head of Go-To-Market at OpenAI.
Full-bleed sky and glowing frame image with headline and subtitle on the left
Kass describes 'unmetered intelligence' (abundant cognitive capacity at near-zero marginal cost) and cites the report's 88% embedding AI agents. Five tips: 1) adopt a portfolio of bets with an explicit failure budget; 2) build the AI-native operating model; 3) invest in behavioral adaptability and humanistic skills; 4) govern for scale with a single model and agent registry; 5) prepare for the next frontier (multi-agent systems, synthetic data, edge, quantum-adjacent optimization).
Blue page with headline and headshot at top, intro paragraph, five numbered columns separated by vertical rules, and a closing paragraph
Section opener for the final chapter, 'Conclusion and key recommendations'.
Full-bleed neon cityscape image with two-tone headline
Eight recommendations: 01 Accelerate learning to build your new competitive moat; 02 Maximize value through data-driven investment; 03 Build in adaptability through frameworks and culture; 04 Build a future-ready, agent-empowered workforce; 05 Adopt an AI-first, trust-by-design mindset; 06 Strengthen your data foundation and modernize your tech stack; 07 Drive strategic ecosystem partnerships; 08 Have one eye on the future (quantum, AGI, ASI). Closing summary paragraph.
Blue page with headline and eight narrow numbered columns, followed by a two-paragraph conclusion
Promotional page for KPMG Velocity, KPMG's AI-enabled products and services: 'Drive growth and agility with precision and speed for lasting resilience', with a 'See what's possible' button and kpmg.com/velocity.
Full-bleed blue light-streak background with framed image on the left and headline, copy and button on the right
Contacts: Bobby Soni, Global Technology Consulting Leader, KPMG International; Guy Holland, Global Leader, CIO Center of Excellence, KPMG International. Legal disclaimers, note that some images were created with AI, designed by Evalueserve, publication number 140343-G, publication date January 2026.
White page with large blue heading, two contact blocks, social icons and small-print legal text in the upper-left; rest of page empty
Questions courantes sur cette diapositive et le contenu de présentation sous-jacent.
It is KPMG International's annual global technology executive survey, subtitled 'Leading in the Intelligence Age: Excelling today, shaping tomorrow'. Based on 2,500 tech executives in 27 countries surveyed in 2025, it covers tech maturity across 10 technology areas, AI adoption and ROI, tech debt and skills, adaptive tech strategy and decision-making, data foundations, agentic AI, quantum computing and AGI, and closes with an eight-point 2026 agenda.
Only 11% of organizations are fully scaled across the 10 technology areas, but 50% expect to be by the end of 2026. Average tech ROI is 2x, while the top 5% 'high performers' achieve 4.5x. Only 24% achieve AI ROI across multiple use cases (down 7 points), 55% struggle to demonstrate AI value, 69% say speed and cost trade-offs compromise security and data standards, and 88% are already investing in agentic AI, with the digital workforce expected to grow from 28% to 36% of core tech team capacity by 2027.
It is published by KPMG International, with a foreword from Guy Holland, Global Leader of KPMG's CIO Center of Excellence. KPMG runs the Global Tech Report as a recurring annual survey; the 2026 edition was published in January 2026 (publication number 140343-G) and compares several results with the previous edition.
They are the 5% of respondents that reach the top two maturity stages in at least five of 10 technology categories, the highest process maturity in at least five of 10 functions, and 200% or more ROI on digital technology. The report contrasts them with the rest on dedicated 'How to emulate the high performers' slides, for example 8% vs 45% saying tech debt blocks new investment.
It follows a clear consulting report structure: contents page, foreword, methodology, full-bleed section dividers, numbered figures that state the exact survey question, grey key-finding call-out boxes, giant single-statistic panels, pull quotes from named executives, recurring three- or four-card comparison slides, and a numbered recommendations agenda. A persistent navigation bar keeps every page tied to its chapter, which is useful to copy for long research readouts.
Start with your survey findings or report document, then group them into chapters with one headline insight per page. 2Slides can turn a document, PDF or outline into a presentation automatically, so you can upload your research write-up and get chart-ready, consulting-style slides with section dividers, stat call-outs and recommendation pages, then refine titles and data.
Yes, as long as you cite KPMG International's Global Tech Report 2026 as the source. The report notes that ROI was self-reported by respondents as direct revenues plus cost savings, efficiency, productivity and risk reduction over the past 12 months, so it is good practice to mention that definition when quoting ROI multiples.
The original PDF is published by KPMG International at https://kpmg.com/content/dam/kpmgsites/xx/pdf/2026/01/global-tech-report.pdf. This gallery page reproduces the 29 pages for reference and design study; refer to KPMG's original for authoritative figures.
Original 29-page report PDF, published January 2026, based on a 2025 survey of 2,500 tech executives in 27 countries.

Create Your Own Slides
Turn your ideas into professional presentations in seconds with 2slides AI.
Référencez des conceptions professionnelles, choisissez votre style et générez des diapositives avec un rendu de texte parfait. Alimenté par Nano Banana—commencez à créer votre présentation maintenant.
Votre Agent IA pour les diapositives. Gagnez du temps, brillez plus vite avec la création intelligente de présentations.


© 2026 2slides. Tous droits réservés.