
Fait partie de Exemples de présentations investisseurs · Exemples de présentations investisseurs indiennes
Kotak Mahindra Bank Q2 FY27 Earnings Presentation "Transforming for scale": the 31-slide investor presentation on results for the quarter and half-year ended 30 September 2026, dated 24 October 2026 and filed with BSE/NSE. It covers consolidated and group-entity profit (consolidated PAT of ₹ 5,645 cr, up 26% YoY), bank P&L and balance sheet, deposits, customer assets, asset quality, key subsidiaries, the bank's three strategic pillars, branch footprint and ESG.
Utilise la couverture de cette présentation comme référence de style pour des diapositives créées à partir de votre propre contenu. Ou choisissez une page ci-dessous pour utiliser sa mise en page comme référence.
Navigation rapide
Étiquettes
Partager les diapositives
Kotak Mahindra Bank Q2 FY27 Earnings Presentation "Transforming for scale": the 31-slide investor presentation on results for the quarter and half-year ended 30 September 2026, dated 24 October 2026 and filed with BSE/NSE. It covers consolidated and group-entity profit (consolidated PAT of ₹ 5,645 cr, up 26% YoY), bank P&L and balance sheet, deposits, customer assets, asset quality, key subsidiaries, the bank's three strategic pillars, branch footprint and ESG.
Vue détaillée de chaque page de diapositive, incluant la mise en page, le contenu clé et les éléments visuels.
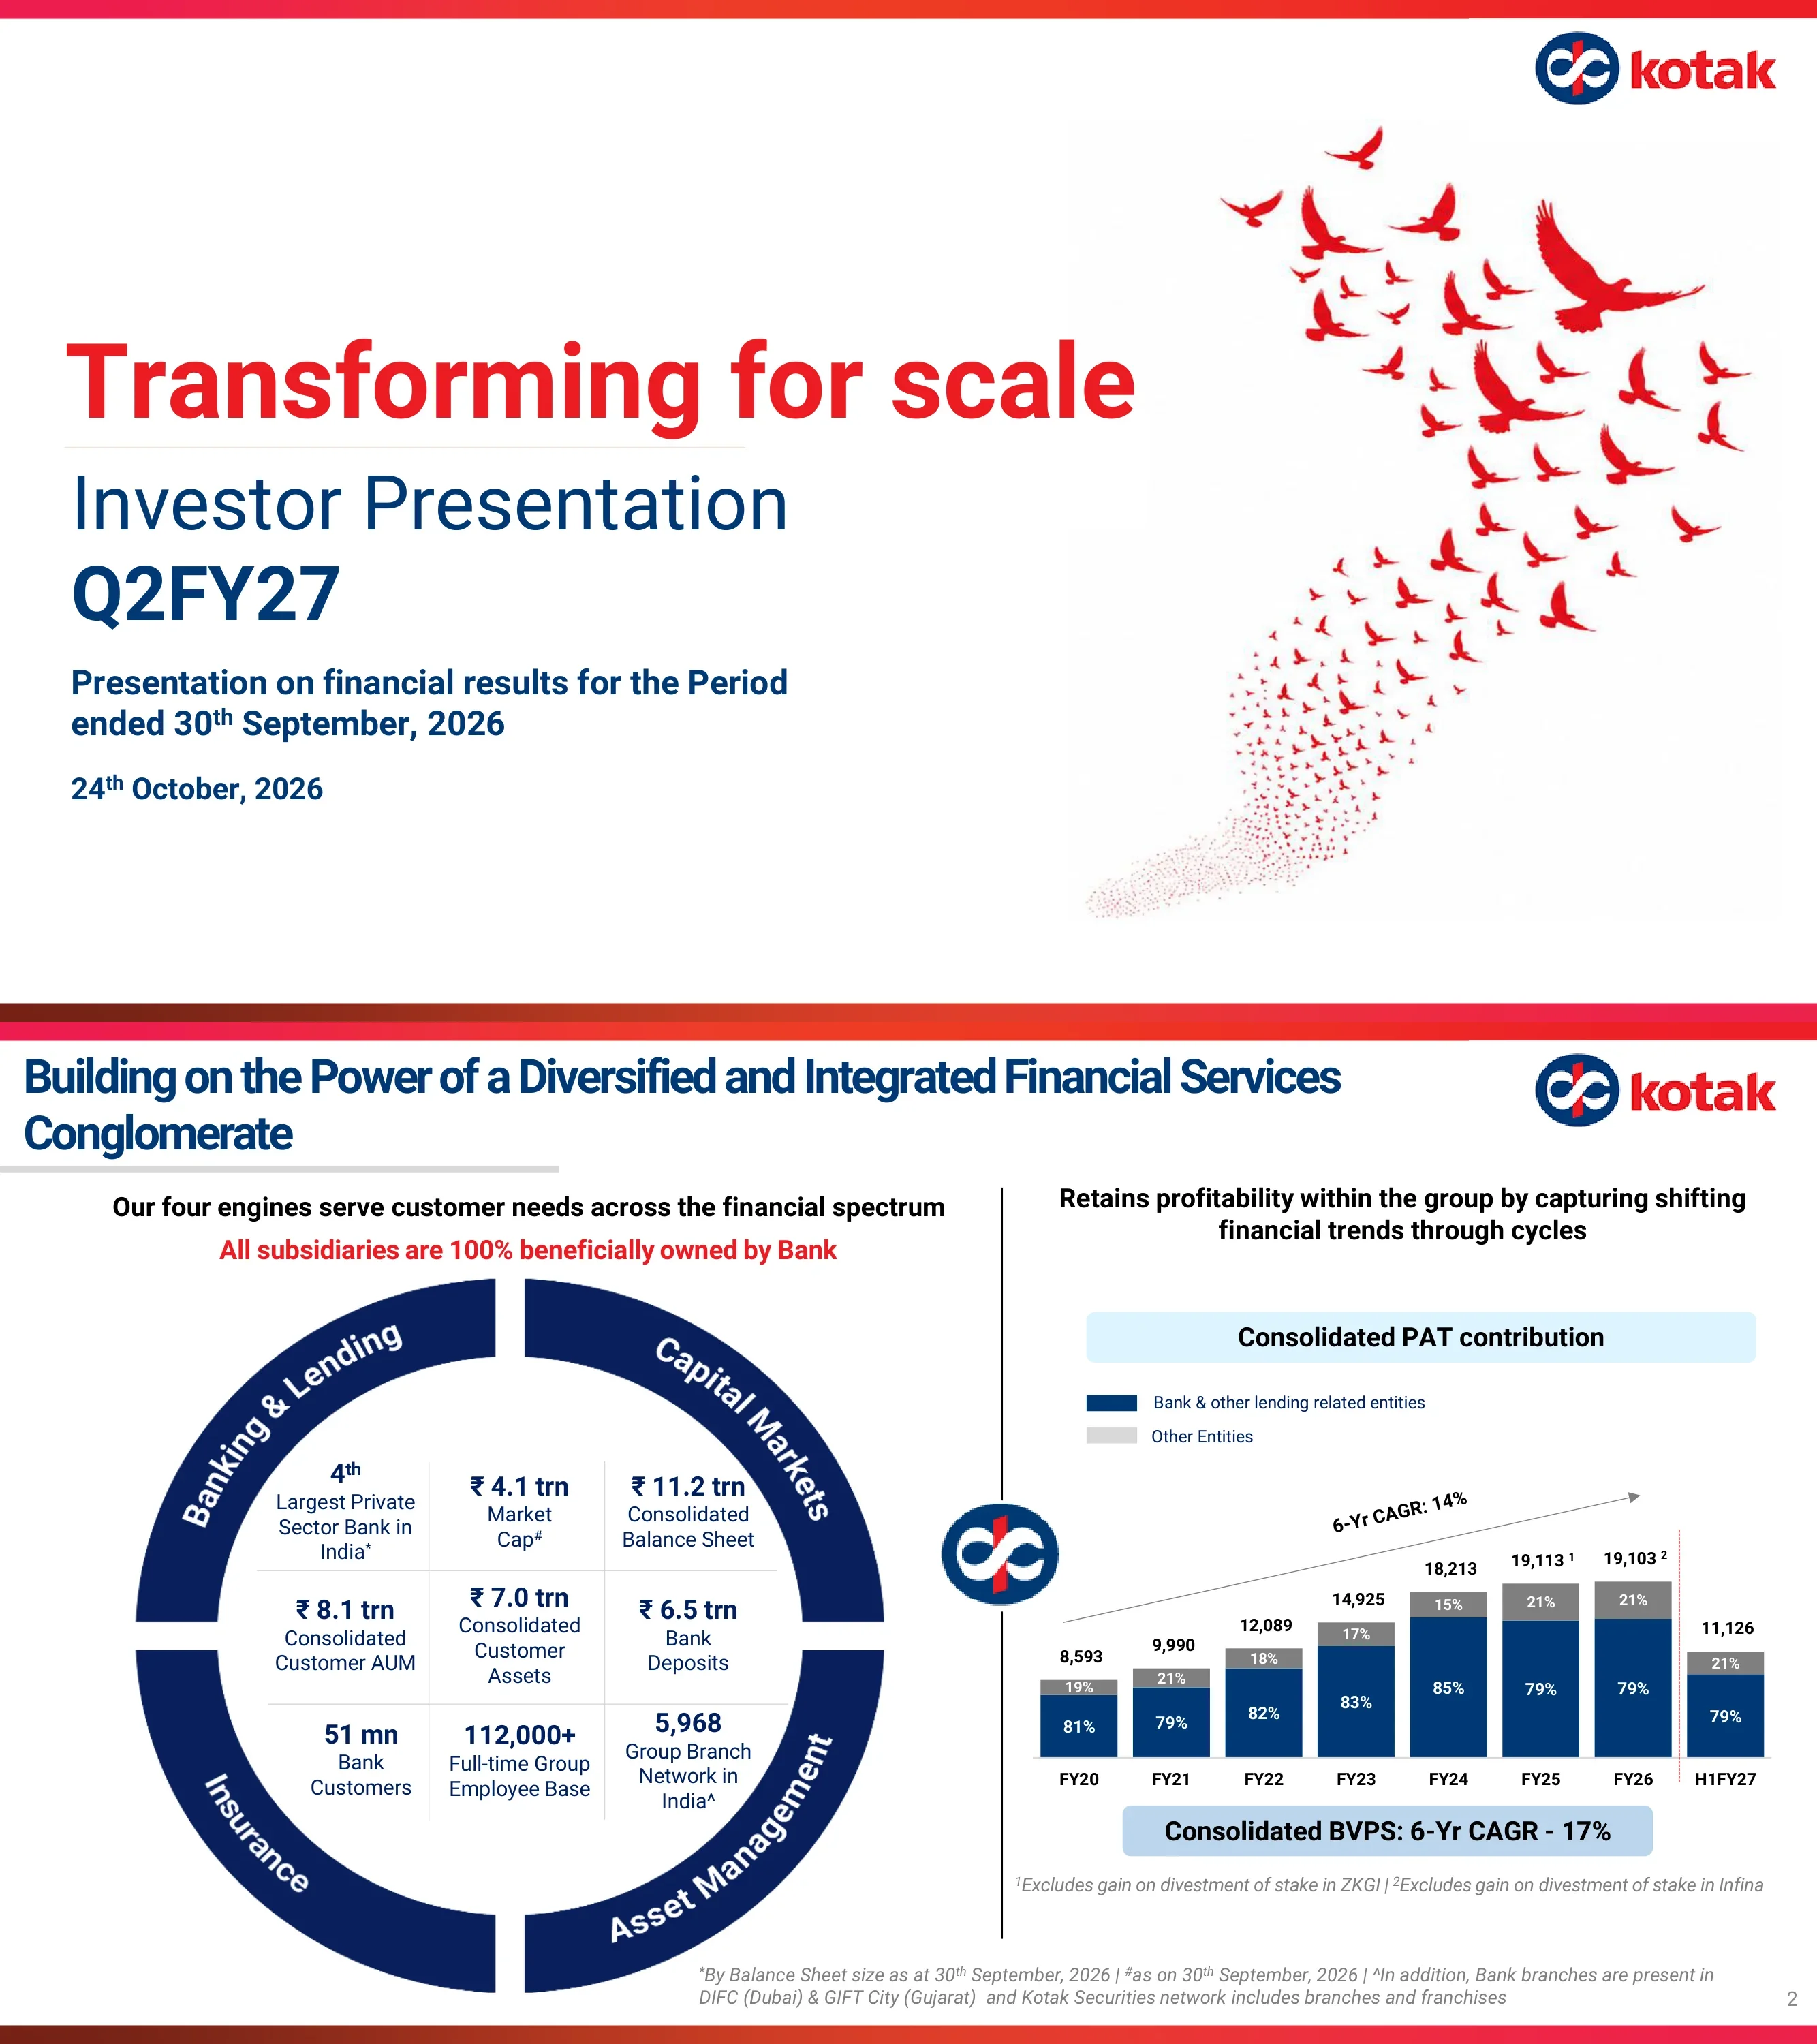
Cover slide: 'Transforming for scale', Investor Presentation Q2FY27, presentation on financial results for the period ended 30th September 2026, dated 24th October 2026.
Left-aligned title block with large red headline, navy subtitle and date; right half filled with a flock of red birds dispersing from a dotted trail; kotak logo top right; thin red gradient band at top and bottom.
Group at a glance: ₹ 11.2 trn consolidated balance sheet, ₹ 4.1 trn market cap, 4th largest private sector bank in India, ₹ 8.1 trn consolidated customer AUM, ₹ 7.0 trn consolidated customer assets, ₹ 6.5 trn bank deposits, 51 mn bank customers, 112,000+ employees and 5,968 group branches; consolidated PAT rose from ₹ 8,593 cr (FY20) to ₹ 19,103 cr (FY26, excluding Infina gain) with H1FY27 at ₹ 11,126 cr (6-yr CAGR 14%); consolidated BVPS 6-yr CAGR 17%; all subsidiaries 100% beneficially owned by the Bank.
Two-panel layout: left a navy ring divided into four engines (Banking & Lending, Capital Markets, Insurance, Asset Management) enclosing a 3x3 KPI grid; right a stacked bar chart of consolidated PAT FY20–H1FY27 split bank-and-lending vs other entities, with a CAGR arrow and a BVPS callout.
Q2FY27 vs Q2FY26: PAT ₹ 5,645 cr vs ₹ 4,468 cr (+26%), ROA 2.10% vs 1.97%, ROE 11.70% vs 10.65%. As at Sep'26 vs Sep'25: customer AUM ₹ 814,118 cr vs ₹ 756,964 cr (+8%), customer assets ₹ 699,250 cr vs ₹ 576,339 cr (+21%), CAR 22.4% vs 22.8%, CET-I 22.1% vs 21.8%, book value per share ₹ 196 vs ₹ 169 (+16%, post 1:5 share split effective 14 January 2026).
Two rows of KPI cards (quarterly flows on top, period-end stocks below); each white raised card shows the current value with a green growth triangle, over a grey card holding the prior-year comparison; small line icons above each card; row labels on the left.
Entity-wise PAT (₹ cr) for Q2FY27/Q2FY26/Q1FY27: Kotak Mahindra Bank 4,212/3,253/4,123 (+29% YoY); Prime 251; Investments 135; Kotak Securities 348; Kotak Mahindra Capital 80; Life Insurance 198 vs 49 (+302%); AMC and TC 287; Alternate Asset Managers 87; Bank & Subsidiaries 5,662; consolidated PAT 5,645 vs 4,468 (+26% YoY, +3% QoQ). Bank and lending entities contribute 82% of Bank & Subsidiaries PAT.
Wide navy-header financial table on the left with indented entity rows, bold segment subtotals and navy-filled total rows; YoY and QoQ columns separated by a red dashed line; right a nested donut chart comparing Q2FY27 and Q2FY26 PAT contribution by segment.
Half-year PAT (₹ cr) H1FY27 vs H1FY26: Kotak Mahindra Bank 8,335 vs 6,535 (+28%); bank and other lending entities 9,280 (+28%); capital market 1,050 (+9%); insurance 534 (+42%); asset management 939 (+12%); consolidated PAT 11,126 vs 8,940 (+24%). FY26 consolidated PAT was 19,103, or 19,288 including the ₹ 185 cr gain on the Infina divestment.
Same table-plus-donut template as page 4 with an FY26 column added and an extra row for the Infina divestment gain; nested donut compares H1FY27 vs H1FY26 contribution.
Networth at Sep'26 (₹ cr) and ROE by segment: bank 145,984 (CET-I 21.4%); bank and lending entities 164,202 with 11.4% ROE; capital market 16,196 (10.6%); insurance 6,999 (11.4%); asset management 9,639 (16.2%); group total networth 194,706 with 11.7% ROE. Bank and lending entities account for 83% of networth; subsidiary CET-I ratios shown at 22.8%, 51.0% and 40.2% for Prime, Investments and the infrastructure debt fund.
Financial table with PAT, networth and ROE columns plus a narrow CET-I side column; single-ring donut on the right showing networth contribution as at 30 September 2026.
Customer AUM rose 8% to ₹ 814,118 cr at 30 September 2026 from ₹ 756,964 cr a year earlier: domestic MF equity 412,008 (from 362,694), domestic MF debt 203,671 (from 196,886), insurance policyholder AUM 104,694 (from 91,230), offshore funds 39,763 (from 47,966), alternate assets 37,035 (from 44,985), NPS & PMS 16,947 (from 13,203).
Side-by-side donut charts for Sep 2026 and Sep 2025, each topped with a grey 'Total' pill and surrounded by labelled callout boxes; a green triangle with '8%' sits between them above a vertical divider.
Standalone bank Q2FY27 vs Q2FY26: PAT ₹ 4,212 cr vs ₹ 3,253 cr (+29%), NIM 4.31% vs 4.54%, ROA 1.92% vs 1.88%, cost/income 45.2% vs 46.8%, credit cost 0.35% vs 0.79%. As at Sep'26 vs Sep'25: customer assets ₹ 626,801 cr (+23%), deposits ₹ 651,491 cr (+23%), net NPA 0.24% vs 0.32%, CASA ratio 38.2% vs 42.3%, CAR 21.9% and CET-I 21.4%.
Ten KPI cards in two rows (five flow metrics, five balance-sheet metrics) using the same white-over-grey card pattern as the consolidated highlights slide, each with a line icon and green growth tags where relevant.
Bank P&L (₹ cr) Q2FY27 vs Q2FY26: net interest income 8,459 vs 7,311 (+16%); other income 3,194 (+23%) including fees and services 2,926 (+21%); net total income 11,653 (+18%); operating expenditure 5,271 (+14%); operating profit 6,382 (+21%); provisions 803 (-15%); PBT 5,579; PAT 4,212 (+29% YoY, +2% QoQ); ROE 11.65%. Fees split into distribution 475, general banking fees 2,275 and others 176. Notes flag ~₹ 158 cr processing fees on FCNR(B) advances, ~₹ 116 cr costs on international-branch borrowings and ₹ 274 cr standard-asset provisions.
Left a full P&L table with italic sub-rows and navy PAT row; right a smaller 'Fees & Services' table and a rounded grey 'Notes' panel with bullet explanations.
Half-year bank P&L (₹ cr) H1FY27 vs H1FY26: NII 16,387 vs 14,570 (+12%); other income 6,532 (+15%); net total income 22,919 (+13%); operating expenditure 10,406 (+11%); operating profit 12,513 (+16%); provisions 1,471 (-32%); PBT 11,042 (+27%); PAT 8,335 vs 6,535 (+28%); ROE 11.82% vs 10.69%. FY26 PAT was 14,008. Fees and services 5,426 (+16%).
Same template as page 9 with an FY26 column in place of the prior quarter; Fees & Services table on the right; no notes panel.
Bank balance sheet (₹ cr) at 30-Sep-26 vs 30-Sep-25: total assets 886,758 vs 706,967; net advances 577,295 vs 462,688; investments 202,035; cash, bank and call 80,910; deposits 651,491 vs 528,776 (CASA 249,105); borrowings 55,223 vs 23,911; capital and reserves 145,984. CASA ratio 38.2% and CD ratio 88.6%. Notes: deposits include ~₹ 55,344 cr FCNR(B) under the RBI swap facility, ~₹ 15,800 cr borrowings raised in international branches, ~₹ 16,110 cr loans against FCNR(B).
Two side-by-side tables (liabilities left, assets right) with large row text, navy total rows and a ratio row beneath each; a rounded bordered notes box across the bottom.
CASA EOP stacked bars for Sep-26/Sep-25/Jun-26 (current account 97,960; fixed-rate SA 136,643; floating-rate SA 14,502 at Sep-26) with CASA % of 38.2%, 42.3% and 40.3%; term deposits EOP 402,386 vs 304,985 (Activmoney 58,672 plus other term deposits 343,714). Average balances Q2FY27: total deposits 606,234 (+19%), current account 82,026 (+17%), fixed-rate SA 129,731 (+14%), term deposits 379,765 (+22%). Cost of funds 4.52% vs 4.70%; cost of SA 2.86% vs 2.89%.
Left: two stacked-bar panels (CASA and term deposits) with navy title tabs and grey percentage pills; right: a navy-label comparison table of average balances with green YoY triangles, and a cost-of-funds mini panel with icons.
Customer assets (₹ cr) at 30-Sep-26: retail banking 228,029 (+22% YoY; home loans and LAP 157,217, PL/BL/consumer durables 26,548, credit cards 13,264, retail microcredit 6,779, advances against FCNR(B) 16,110); institutional banking 287,371 (+25%; corporate 139,786 incl. ₹ 8,915 cr transferred from KMIL, SME 138,700); independent product businesses 67,455 (CV/CE 47,038, tractor 20,417); advances 582,855 (+22%); customer assets 626,801 (+23%); net advances 577,295 (+25%). Mix: institutional 49%, retail 39%, independent product 12%. Unsecured retail advances were 8.1% of net advances.
Dense loan-book table on the left with bold segment rows and navy subtotal rows; right a pie chart of advance mix and two rounded text boxes for the unsecured-retail note and the KMIL transfer footnote.
GNPA movement (₹ cr) Q2FY27: opening 6,122, fresh slippages 1,230, upgrades and recoveries 642, write-offs 629, closing 6,081; annualised credit cost 0.35% vs 0.79% a year earlier. Ratios at 30-Sep-26: GNPA 1.04% (1.39% a year ago), NNPA 0.24% (0.32%), PCR 78%; NNPA ₹ 1,367 cr; total provisions ₹ 7,564 cr. SMA-2 was ₹ 468 cr (₹ 249 cr in June); ₹ 136 cr of the quarter's slippages were upgraded within the quarter.
Two navy-header tables side by side (NPA movement and NPA ratios) with large readable rows; a bordered bullet box below for SMA-2 and same-quarter upgrades.
Scorecard Q2FY27 vs Q2FY26 vs Q1FY27 grouped by theme. Profitability: NIM 4.31%, cost of funds 4.52%, ROE 11.65%, ROA 1.92%. Efficiency: cost to income 45.2%, cost to assets 2.40%. Balance sheet stability: CD ratio 88.6%, CASA 38.2%, CET-I 21.4%, consolidated BVPS ₹ 196. Asset quality: NNPA 0.24%, credit cost 0.35%, slippages ratio 0.85%, PCR 78%.
Single centred table with a navy header, large navy category labels in a merged left column (Profitability, Efficiency, Balance Sheet Stability, Asset Quality) and dotted row separators.
Section divider introducing the key subsidiaries section.
Centred large navy section title with a short grey underline; red bird-flock illustration on the right.
Car and two-wheeler finance subsidiary: Q2FY27 NII ₹ 621 cr, NII and other income 746, PBT 335, PAT 251 (Q2FY26: 246); NNPA 1.0%, CAR 23.3%, ROA 1.9%; FY26 PAT 1,008. Customer assets ₹ 47,458 cr at Sep-26 (vehicle 37,312, others 10,146), up 12% YoY and 3% QoQ. Prime completed 30 years of operations in October 2026.
Subsidiary template: navy-header financial table on the left; stacked bar chart of customer assets in a rounded panel on the right with green YoY/QoQ arrows; an 'Other Highlight' tab and text box at the bottom.
Broking subsidiary: Q2FY27 total income ₹ 1,591 cr, PAT 348 (Q1FY27: 533; FY26: 1,642); cash market share 9.4%, derivatives 15.7%, overall 13.2%; cash ADV ₹ 7,405 cr (+15% YoY, -20% QoQ); MTF market share ~14%. Kotak Neo: DIY orders were 97% of total orders; external MF portfolio import via MF Central; upgraded Python SDK and options-chain APIs. Institutional broking executed 13 ECM block deals and 1 OFS worth USD 1.6 bn.
Financial table top left, bar chart of cash ADV top right, MTF callout box, and a wide two-column 'Other Highlights' panel with red sub-headings for retail and institutional broking.
Asset manager, described as the 5th largest fund house in India: overall average AUM ₹ 635,421 cr in Q2FY27 (+12% YoY, +4% QoQ); equity AAUM ₹ 418,636 cr (+16% YoY, +7% QoQ); PAT ₹ 287 cr (Q2FY26: 258). Individual MAAUM share 58%; September SIP inflows ₹ 2,110 cr (+11% YoY); equity AAUM market share 6.52%; distribution mix led by MFDs (38%); leads the arbitrage fund category; Infinity Hybrid Long Short Fund (SIF) scaled to ₹ 3,152 crore.
Left column of two bar-chart panels (overall and equity AAUM) with navy title tabs; right a small PAT table plus 'Key Highlights' and 'Other Highlights' bullet boxes.
Life insurer: Q2FY27 total premium ₹ 5,343 cr (Q2FY26: 4,430; gross written premium +20.6% YoY), shareholders' PAT ₹ 198 cr (from 49), solvency 2.14x, capital and reserves 6,999; individual APE 774. Individual NB premium +6.2%, group premium +51.7%, retail sum assured +22.8%, protection business +28.8%; traditional products 70.8% of regular premium; AUM ₹ 111,551 cr (+14.2%). Launched Kotak Protect Advantage and a lead-management platform for 1.2 lakh+ distributors.
Financial table top left, stacked bar chart of gross written premium by channel top right with an Ind APE row beneath, and four rounded highlight cards with icons along the bottom.
Section divider introducing the strategic pillars section.
Large navy section title on the left with grey underline; red bird-flock illustration on the right.
Three pillars: (1) focus customer segment propositions – HNI (Private Banking + Solitaire), Core India (Kotak811), SME and Institutional, to deepen wallet share and cross-engine monetisation; (2) independent product businesses within the bank – tractor finance and commercial vehicles/construction equipment, for secured growth and PSL accretion; (3) technology, digital and AI – scalable digital infrastructure, data and analytics, and AI, for customer experience and efficiency.
Three equal columns, each with a red italic 'Pillar' label, a grey rounded header card with an icon, a bullet list, and a statement of value marked by a red vertical bar.
HNI (Private Banking + Solitaire): Kotak Private manages wealth for over 65% of India's top 100 families; 90.8K families (78.2K in June) with relationship value of ₹ 13.6 lakh cr. Core India (Kotak811): fully digital onboarding and servicing; monthly acquisition run rate of 321K (298K); Kotak811 SA is 13.3% of the bank's total SA, growing 34% YoY and 11% QoQ.
Two-column segment comparison: app icon plus outlined pill title, proposition paragraph, red 'Value to Kotak Group' heading with bullets, and a red-bar KPI callout at the bottom of each column.
SME: relationship-led working capital, term loan, supply chain, trade, cash management and FX proposition with an IIT partnership; SME advances ₹ 1.4 lakh cr, +27% YoY and +10% QoQ, 24% of advances. Institutional: integrated balance-sheet, capital-market and advisory platform; contributes 20% of the bank's fee and services income (+36% YoY in H1FY27); KMCC and KIE cross-sell adds ~109 bps to Corporate Bank ROE.
Mirror of page 23 with Kotak fyn icons: two columns of proposition, value bullets and red-bar KPI callouts.
Tractor finance: granular fixed-rate secured book across 600+ districts, superior ROE and direct-agri PSL; 9.6% market share, loan book ₹ 20,417 cr (+11% YoY), 4% of advances. CV/CE: entry point into transport and infrastructure; 4.4% (CV) and 7.3% (CE) market share in H1FY27, combined book ₹ 47,038 cr (+8% YoY), 8% of advances.
Two columns headed by outlined pill titles, each with portfolio characteristics, red 'Value to the Group' bullets and a red-bar KPI block.
Core banking scaled to ~10,000 transactions per second and 3.6 cr+ API calls daily; UPI remitter market share 3.8% by value, with 13.3% of customers' UPI transactions routed through Kotak apps; 15+ ML models and 5,000+ features in risk intelligence; AI for customers (voice automation, collections), colleagues ('Kompanion'), control and engineering ('Spark'). Digital footprint: Kotak Bank App, Kotak811, Kotak fyn and Kotak Neo.
Grey banner 'Operating backbone of Franchise' over three light-grey rounded columns with red headings; a second grey banner 'Our Digital Footprint' over a row of four app icons with captions.
Group network of 5,968 branches in India: Kotak Bank 2,327, Prime 168, Life Insurance 387, Kotak Securities 1,432 (incl. franchises), AMC 128, BSS Sonata Microcredit 1,526. Bank branches by type: metro 1,081 (46%), urban 496 (22%), semi-urban 330 (14%), rural 420 (18%); by region: North 738, East 198, West 714, South 677. 2,673 ATMs and 10 currency chests; international presence in DIFC, GIFT City, New York, London, Mauritius, Dubai, Abu Dhabi and Singapore.
Left a branch table with grey header and navy total row plus an international-reach box; right navy label boxes for branch classification and distribution, a comparison callout, and two icon stat pills for ATMs and currency chests.
Section divider introducing the annexure.
Centred large navy title with grey underline and the red bird-flock illustration on the right.
Group structure wheel: banking and other lending entities (Kotak Mahindra Bank, Prime, Investments, Infrastructure Debt Fund, BSS Sonata Microcredit), capital market (Kotak Securities, Kotak Mahindra Capital), asset management (AMC, Trusteeship, Pension Fund, Alternate Asset Managers, international subsidiaries) and insurance (Kotak Mahindra Life Insurance). All subsidiaries are 100% beneficially owned by the bank; AAA rating noted for the bank and six subsidiaries.
Central four-quadrant donut (navy, light blue, grey, red) around the Kotak logo with entity names and business lines arranged on both sides; grey banner on top and an AAA rating badge with a highlighted text box at bottom right.
Environment, social and governance highlights: renewable energy and green buildings, 4.5 lakh+ saplings and 25+ lakes rejuvenated; gender diversity 27.9% toward a 30% target by FY2028-29; Kotak BizLabs accelerator and Women Startup Programme with 2,500+ entrepreneurs; ISO/IEC 27001 and ISO 45001. ESG in core business: ₹ 8,900+ cr green asset book and finance for 1.76 mn active women microfinance borrowers. Ratings: Sustainalytics 16.9 (low risk), MSCI ESG AA, top 10 in MSCI India Selection Index, SES 74.1, CRISIL 72, NSE 70.
Three navy-header columns (Environment, Social, Governance) with icon badges and arrow bullets; a full-width 'ESG in Core Business' band; a 'Ratings and Indices' strip with a red trophy block and six rating-agency logos.
Legal disclaimer on forward-looking statements, no offer of securities and no independent verification; figures regrouped where necessary. Investor relations contact: Devang Gheewalla / Kaynaan Shums, Kotak Mahindra Bank Limited, investor.relations@kotak.com.
Rounded white panel of small disclaimer text on the left; photo of a hand holding a business card with contact details on the right.
Questions courantes sur cette diapositive et le contenu de présentation sous-jacent.
It is Kotak Mahindra Bank's 31-slide 'Transforming for scale' investor presentation for the quarter and half-year ended 30 September 2026, dated 24 October 2026. It covers consolidated highlights, group PAT and networth by entity, customer AUM, the bank's P&L, balance sheet, deposits, customer assets and asset quality, the key subsidiaries (Prime, Securities, AMC, Life Insurance), the three strategic pillars, branch network and ESG.
Consolidated PAT was ₹ 5,645 crore, up 26% from ₹ 4,468 crore in Q2FY26, with consolidated ROE of 11.70%. The standalone bank earned PAT of ₹ 4,212 crore (+29% YoY) on net interest income of ₹ 8,459 crore (+16%), with NIM of 4.31%, net NPA of 0.24% and credit cost of 0.35%. Customer assets grew 23% to ₹ 626,801 crore and deposits 23% to ₹ 651,491 crore.
Indian companies follow an April-to-March fiscal year, so FY27 runs from April 2026 to March 2027. Q2 FY27 is July to September 2026, and H1 FY27 is April to September 2026.
Kotak Mahindra Bank filed the presentation with the Indian stock exchanges (BSE/NSE) alongside its quarterly results. The version here has the exchange cover letter removed so that it starts with the presentation itself.
Yes. Besides the original PDF, there is an editable PPTX converted from the PDF. Because it is a conversion rather than the company's source file, some tables, charts and text boxes may need adjusting after you open it.
It works well as a layout reference: navy-header financial tables with YoY/QoQ columns, white-over-grey KPI cards, nested donut charts for segment contribution, stacked bars for deposit mix, and a consistent one-slide template per subsidiary. Replace the Kotak branding and figures with your own; the content itself remains Kotak's disclosure.
CASA is current and savings account deposits as a share of total deposits (38.2% here). NIM is net interest margin (4.31%). GNPA and NNPA are gross and net non-performing assets as a share of advances (1.04% and 0.24%). PCR is the provision coverage ratio (78%). CET-I is the common equity tier-1 capital ratio (21.4% for the bank).
Indian companies report in crore (10 million) and lakh crore (1 trillion) of rupees. The deck's figures are kept exactly as written, so ₹ 5,645 cr equals ₹ 56.45 billion, and ₹ 13.6 lakh cr equals ₹ 13.6 trillion.
Official investor relations page with quarterly results, presentations and exchange filings.

Create Your Own Slides
Turn your ideas into professional presentations in seconds with 2slides AI.
Référencez des conceptions professionnelles, choisissez votre style et générez des diapositives avec un rendu de texte parfait. Alimenté par Nano Banana—commencez à créer votre présentation maintenant.
Votre Agent IA pour les diapositives. Gagnez du temps, brillez plus vite avec la création intelligente de présentations.


© 2026 2slides. Tous droits réservés.