
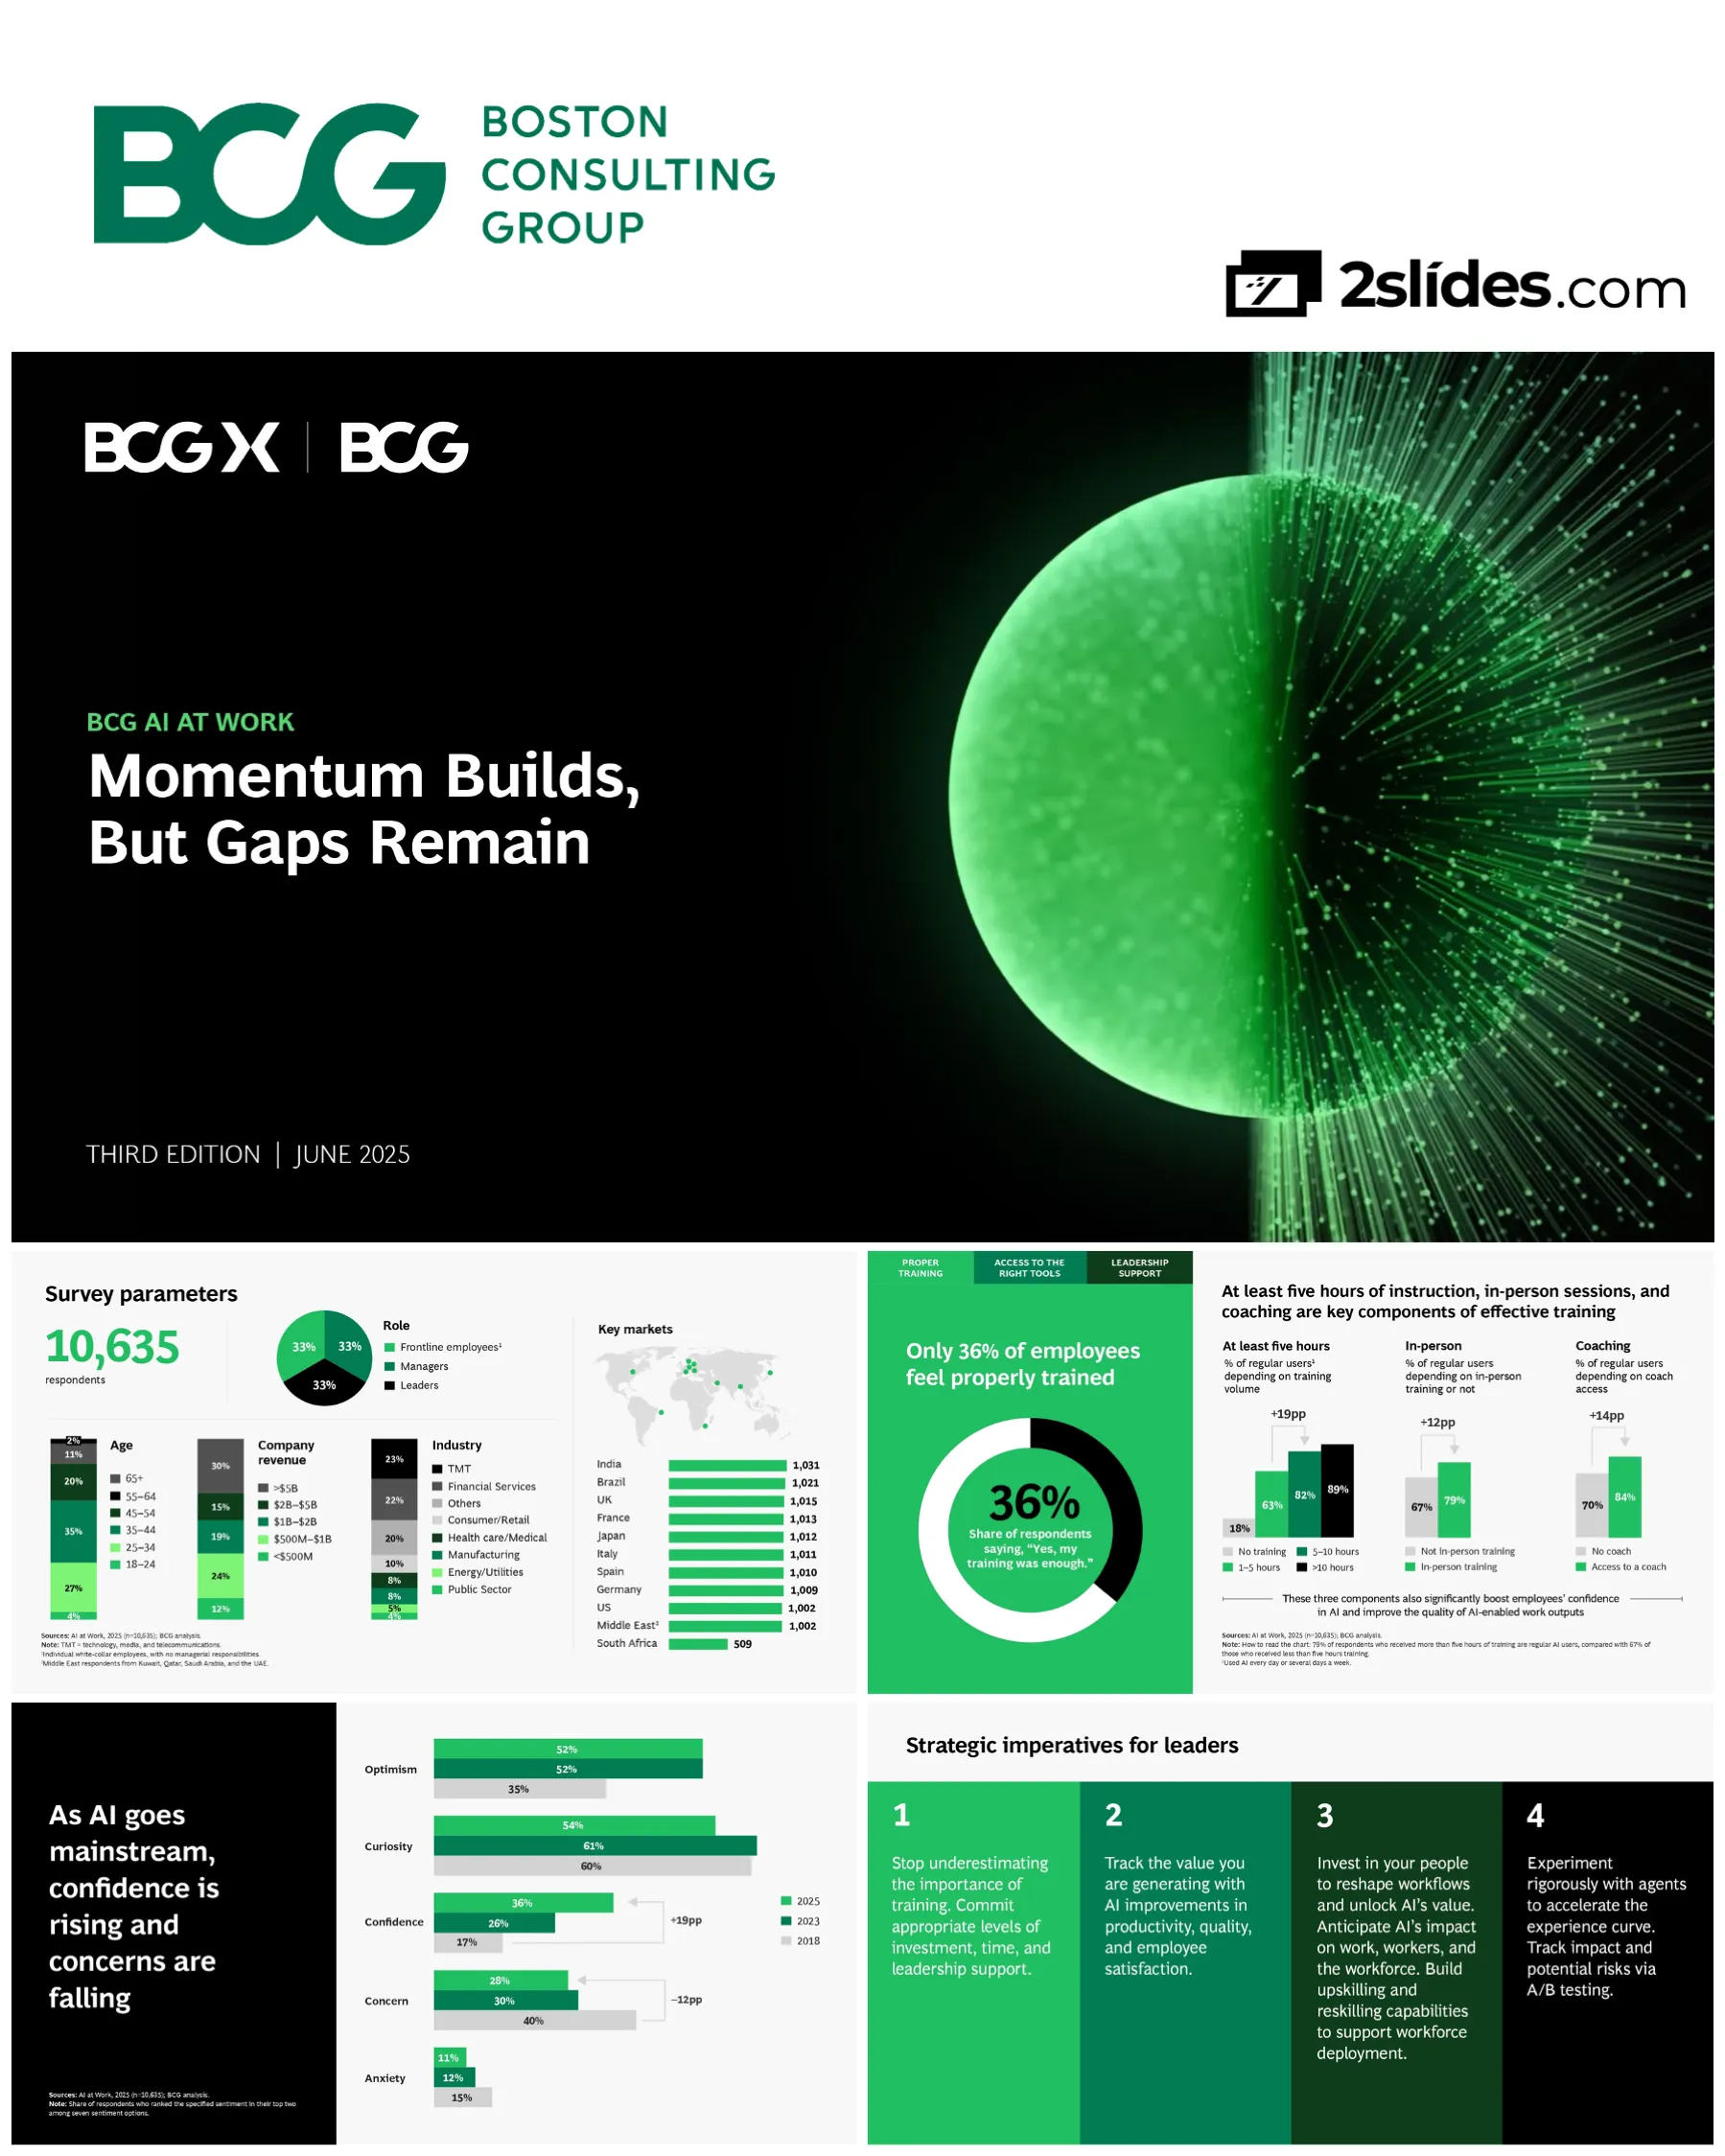
BCG AI at Work Survey - Third Edition analyzing AI adoption momentum and persistent implementation gaps in workplace environments
Navigation rapide
Étiquettes
Partager les diapositives
BCG AI at Work Survey - Third Edition analyzing AI adoption momentum and persistent implementation gaps in workplace environments
Vue détaillée de chaque page de diapositive, incluant la mise en page, le contenu clé et les éléments visuels.
Title slide for the third edition of BCG's AI at Work study published June 2025, featuring the report's main finding about growing AI momentum alongside persistent implementation challenges
Dark background with striking green fiber optic sphere visual on right side, BCG X and BCG logos in top left, large white title text on left, publication details at bottom
Comprehensive breakdown of survey sample showing 10,635 respondents equally distributed across frontline employees (33%), managers (33%), and leaders (33%), spanning 11 countries with detailed demographic, industry, and company size distributions
Multi-column layout with large respondent number on left, pie chart for role distribution in center, world map with country bars on right, and demographic breakdowns (age, revenue, industry) at bottom
Distillation of report's five critical findings: (1) AI mainstream adoption at 72% but frontline stalled at 51%, (2) Training satisfaction crisis at only 36%, (3) Global South leadership with India at 92%, (4) Value creation through process redesign, (5) Limited AI agents deployment at 13%
Five numbered text blocks arranged in a grid pattern on solid green background, each containing a key finding with supporting statistics highlighted
Section break introducing the first major theme: AI has become part of daily work life, but frontline employees have encountered an adoption barrier
Full-slide dark green gradient background with centered large white text spanning multiple lines
Longitudinal data (2018-2025) showing dramatic shifts in employee sentiment toward AI: optimism increased 19 percentage points to 61%, while anxiety decreased 12 percentage points to 17%, demonstrating growing workforce confidence
Left side contains horizontal bar chart comparing five sentiments across three time periods (2018, 2023, 2025), with percentage changes noted on right
Critical finding showing strong overall adoption (72% regular users) masks a concerning trend: while leaders (88%) and managers (85%) show high usage, frontline employees have plateaued at 51% for two consecutive years (2024-2025)
Grouped bar chart showing three worker levels across three years (2023-2025), with arrows indicating 14pp growth for leaders/managers versus flat trend for frontline
Geographic analysis revealing stark regional differences: Global South countries dominate adoption with India leading at 92%, UK at 87%, Middle East at 78%, while Global North lags with US at 51% and Japan at 68%
World map with countries sized by adoption percentage, split into Global South (green) and Global North (gray) categories, showing 72% global average
Significant finding that 41% of respondents believe their job will probably or certainly disappear within ten years, with frontline employees (43%) showing highest concern compared to managers and leaders (36%)
Three vertical percentage bars showing fear levels across worker categories, with 7pp difference highlighted between frontline and management
Critical insight showing paradox: the three countries with highest AI adoption (India 92%, UK 87%, Middle East 78%) also show highest job loss fears, with Spain at 61%, India at 48%, suggesting adoption awareness heightens displacement concerns
Country comparison showing fear percentages with adoption rankings, split between Global South (green) and Global North (gray), with 41% global average baseline
Productivity impact analysis showing 47% of AI users save more than an hour per day, but only one-third receive guidance on reallocation. Time is redirected to diverse activities: performing more tasks (54%), finishing earlier with better quality (52%), and strategic work (44%)
Large percentage callout on left, horizontal bar chart on right showing eight different time reallocation activities with percentages
Section break introducing the second major theme: proper training, access to the right tools, and strong leadership support are the three critical enablers for improving AI adoption
Full-slide green gradient background with centered multi-line white text, using em dash for emphasis
Identification of three critical barriers from frontline perspective: (1) inadequate skills training with only 36% feeling properly trained, (2) 37% lack access to right tools leading to 54% shadow AI usage, (3) only 25% receive sufficient leadership support
Three text sections with headers and detailed explanations, presented in tabbed format with green highlight on active section
Evidence-based training recommendations showing three critical components significantly boost adoption: training exceeding five hours increases regular users from 67% to 79% (+12pp), in-person training adds 19pp lift, and coaching access adds 14pp improvement
Three grouped bar comparisons showing impact of training volume, in-person delivery, and coaching access, with navigation tabs at top and 36% satisfaction callout
Critical security concern revealing that 54% of employees would use AI tools without company authorization, with Gen Z and Millennials at 62% versus 43% for others (+19pp difference), creating significant governance and security risks
Large '54%' statistic on left side, two-segment donut chart in center showing would use vs would wait, and generational comparison bars on right
Compelling evidence showing leadership support dramatically affects outcomes: with support, 82% are regular users versus 41% without (+41pp), career optimism jumps from 13% to 62% (+49pp), and job enjoyment increases from 15% to 55% (+40pp)
Three paired vertical bar comparisons showing dramatic differences in adoption, career positivity, and job enjoyment based on leadership support presence
Section break introducing the third major theme: organizations must move beyond AI tool adoption to value generation through comprehensive workflow and function redesign
Full-slide green gradient background with centered multi-line white text emphasizing transformation journey
BCG's AI value creation framework showing 72% at Deploy stage (rolling out tools), 50% at Reshape stage (redesigning workflows), and 22% at Invent stage (new business models). Companies creating most value invest 80% in Reshape and Invent phases
Three horizontal sections with percentages, stage names, and descriptions, using gradient green boxes with arrows indicating progression
Industry benchmarking showing Financial Services (54%) and Consumer/Retail (54%) lead in workflow redesign, followed by Technology (48%) and Manufacturing (47%), while Public Sector lags at 31%, with 50% overall average
Horizontal bar chart showing eight industries ranked by Reshape percentage, with 50% average reference line
Comparative analysis proving companies redesigning workflows invest more in people and achieve superior results: 18pp more provide proper training, 23pp more have leadership support, 26pp better track value, employees save 9pp more time, and 13pp more see improved decision-making
Two-column comparison showing six metrics with paired bars and percentage point differences, contrasting Deploy-only versus Reshape companies
Important caveat showing employees in companies actively redesigning workflows feel more vulnerable to job loss (46%) compared to those in tool-rollout-only companies (34%), a 12pp difference reinforcing need for clear communication and upskilling commitments
Three vertical percentage bars comparing job displacement fears across all respondents, Deploy-only companies, and Reshape companies, with 12pp difference highlighted
Section break introducing the fourth major theme: AI agents hold significant promise but are not yet widely deployed in organizational workflows
Full-slide green gradient background with centered two-line white text statement about AI agents deployment gap
Comprehensive view of AI agents status showing 31% not deployed, 56% in experimental/pilot phase, only 13% integrated into workflows. Despite 77% believing agents will be important in 3-5 years, only 33% properly understand what they are
Three-segment horizontal bar showing deployment stages, with two circular percentage callouts on left showing importance perception (77%) versus understanding (33%)
Geographic analysis of AI agents integration showing Brazil (18%) and Germany (18%) lead, followed by India (17%), Spain (15%), US (13%), and UK (13%), with Global South generally ahead, though gap is smaller than general AI adoption, 13% global average
World map with countries displaying integration percentages, split between Global South (green) and Global North (gray) with 13% global average reference
Employee concerns about AI agents with three primary issues: decisions without human oversight (46%), unclear accountability for mistakes (35%), and risk of bias or unfair treatment (32%), highlighting governance and control challenges
Three text sections with large percentage callouts, presenting top three concerns in descending order of importance
Critical finding showing knowledge reduces fear: employees who understand AI agents well see them as valuable collaborative tools (71%) versus those uncertain (25%), a 46pp difference. Simultaneously, threat perception drops from 16% to 2% (-14pp)
Two-column comparison with circular percentage callouts showing contrasting perceptions between those who understand agents versus those uncertain
Executive recommendations summarizing four critical actions: (1) commit appropriate investment in training and leadership support, (2) track AI value in productivity, quality, and satisfaction, (3) invest in people for workflow redesign with upskilling/reskilling, (4) experiment rigorously with agents using A/B testing
Four numbered sections arranged in grid format on green background, each containing strategic imperative with supporting explanation
Final slide with BCG branding and website (bcg.com) featuring signature visual identity with green fiber optic burst against black background
Dark background with green fiber optic visual at top, BCG X and BCG logos centered, website URL at bottom
Questions courantes sur cette diapositive et le contenu de présentation sous-jacent.
While overall AI adoption has reached 72% of workers using AI regularly, there's a critical adoption ceiling for frontline employees who have stalled at 51% for two consecutive years (2024-2025). Meanwhile, leaders (88%) and managers (85%) show much higher adoption rates, creating a concerning gap that threatens equitable value realization across organizations. This frontline adoption barrier is the key challenge companies must address.
BCG identifies three key enablers: (1) Proper training - at least five hours of instruction with in-person sessions and coaching access increases regular users by 12-19 percentage points, though only 36% of employees currently feel adequately trained; (2) Access to the right tools - 37% lack proper tools, leading 54% to risk using unauthorized 'shadow AI'; (3) Leadership support - only 25% of frontline employees receive it, yet it drives a 41 percentage point increase in regular AI usage.
Global South countries significantly outpace the Global North in AI adoption. India leads globally at 92% regular usage, followed by the UK at 87% and Middle East at 78%. In contrast, Global North countries like the US show only 51% adoption and Japan 68%. This pattern holds true across general AI tools and emerging AI agents deployment, suggesting different cultural, organizational, or economic factors driving faster adoption in emerging markets.
Deploy (72% of companies) involves rolling out off-the-shelf AI tools like ChatGPT or Microsoft Copilot. Reshape (50%) means redesigning end-to-end workflows and reimagining entire functions with AI integrated throughout. Invent (22%) involves creating new AI-powered business models and revenue streams. BCG research shows companies creating the most value invest 80% of resources in Reshape and Invent phases. Companies doing Reshape provide 18pp more training, offer 23pp more leadership support, and employees save 9pp more time daily.
Shadow AI refers to employees using AI tools without company authorization or IT oversight. The survey reveals 54% of employees would use unauthorized AI tools if their company doesn't provide adequate solutions, with Gen Z and Millennials at an alarming 62%. This creates significant security, data privacy, and compliance risks as sensitive company information may be processed through unvetted third-party AI services beyond corporate governance frameworks.
AI agents adoption is still in very early stages: only 13% of respondents report agents integrated into their workflows, 56% see them in experimental or pilot phases, and 31% haven't deployed them at all. While 77% believe agents will be important in 3-5 years, only 33% properly understand what they are. Top concerns include decisions without human oversight (46%), unclear accountability for mistakes (35%), and potential bias (32%). However, employees who understand agents well view them as collaborative tools (71%) rather than threats (2%).
47% of AI users report saving more than one hour per day. However, only one-third receive guidance on reallocating this time. The saved time is being redirected diversely: 54% perform more tasks, 52% finish work earlier with better quality, 44% work on strategic tasks, 36% experiment more with GenAI, and 34% pursue professional development. This lack of strategic guidance on time reallocation represents a missed opportunity for maximizing AI's organizational value.
41% of respondents fear their job will disappear in the next ten years, with frontline employees showing highest concern (43% vs 36% for managers/leaders). Paradoxically, countries with highest AI adoption also show highest fears: Spain (61%), India (48%), and Italy (63%) lead in job loss concerns. Employees in companies actively redesigning workflows feel even more vulnerable (46%) versus those in tool-rollout-only companies (34%), reinforcing the critical need for clear communication and robust upskilling commitments during transformation.

Create Your Own Slides
Turn your ideas into professional presentations in seconds with 2slides AI.
Référencez des conceptions professionnelles, choisissez votre style et générez des diapositives avec un rendu de texte parfait. Alimenté par Nano Banana—commencez à créer votre présentation maintenant.
Votre Agent IA pour les diapositives. Gagnez du temps, brillez plus vite avec la création intelligente de présentations.




© 2026 2slides. Tous droits réservés.