
Ανήκει στη συλλογή Παραδείγματα παρουσιάσεων για επενδυτές
Uni-President Q3 2026 Earnings Presentation: an 18-page English investor deck from Uni-President Enterprises Corp. (TWSE: 1216), Taiwan's largest food and retail conglomerate, covering consolidated results for the first nine months of 2026 (2026 9M) in NT$ (New Taiwan dollars), plus balance sheet, cash flow, dividends, ESG and group-structure slides. The deck is dated 17 November 2026 and was filed on Taiwan's Market Observation Post System (MOPS) for the investor conference (法說會).
Χρησιμοποιεί το εξώφυλλο αυτής της παρουσίασης ως πρότυπο στυλ για διαφάνειες με το δικό σας περιεχόμενο. Ή επιλέξτε οποιαδήποτε σελίδα παρακάτω για να χρησιμοποιήσετε τη διάταξή της ως αναφορά.
Γρήγορη Πλοήγηση
Ετικέτες
Κοινοποίηση διαφανειών
Uni-President Q3 2026 Earnings Presentation: an 18-page English investor deck from Uni-President Enterprises Corp. (TWSE: 1216), Taiwan's largest food and retail conglomerate, covering consolidated results for the first nine months of 2026 (2026 9M) in NT$ (New Taiwan dollars), plus balance sheet, cash flow, dividends, ESG and group-structure slides. The deck is dated 17 November 2026 and was filed on Taiwan's Market Observation Post System (MOPS) for the investor conference (法說會).
Λεπτομερής προβολή κάθε σελίδας διαφάνειας, συμπεριλαμβανομένης της διάταξης, βασικού περιεχομένου και οπτικών στοιχείων.
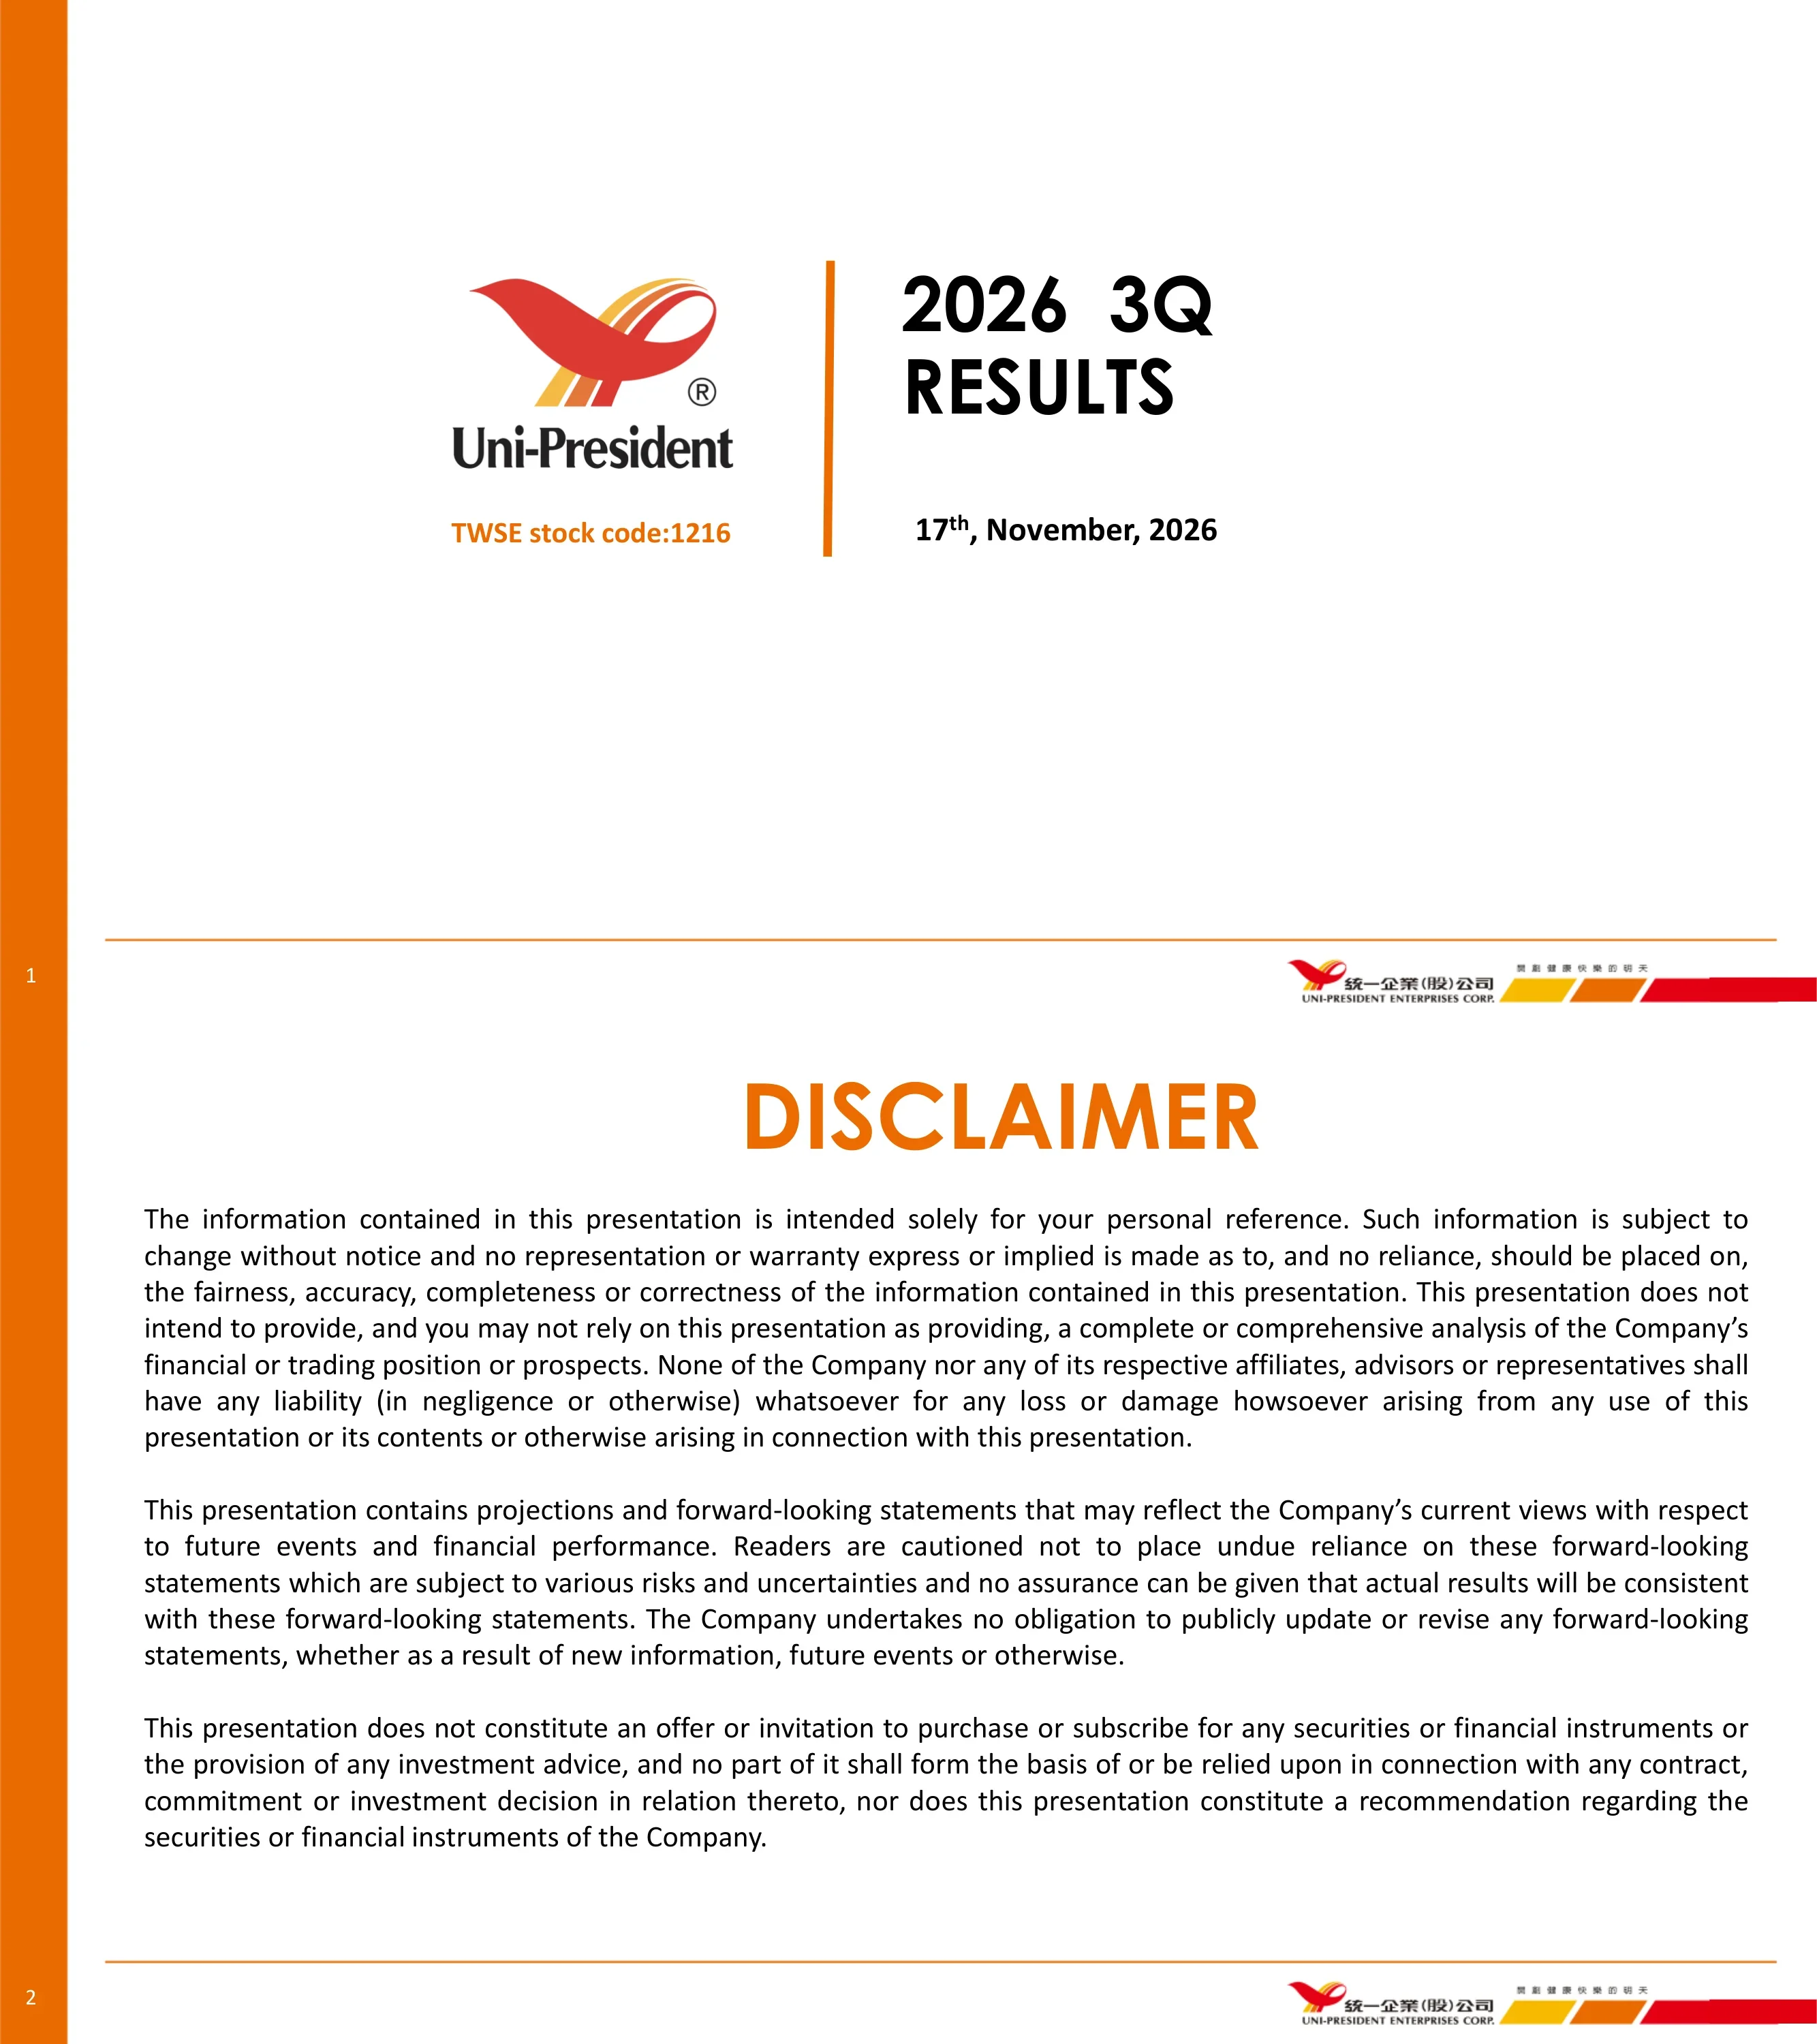
Cover slide titled "2026 3Q RESULTS" with the Uni-President logo, "TWSE stock code:1216" and the date "17th, November, 2026".
Left orange vertical band; logo and stock code on the left, a thin orange vertical divider, then large bold title and date on the right; footer rule with Chinese and English company wordmark.
Standard legal disclaimer in three paragraphs: information is for personal reference and subject to change, the deck contains forward-looking statements, and it is not an offer or investment advice.
Centered orange heading above three justified text paragraphs on a white background.
Consolidated 2026 9M vs 2025 9M table in NTD millions: Revenue 537,005 vs 515,164 (4.24%), Gross Profit 179,610 vs 172,539 (4.10%), Operating Profit 31,048 vs 30,787 (0.85%), Share of profit under equity method 5,863 vs 2,011 (191.55%), Profit Before Tax 40,632 vs 35,794 (13.52%), Profit After Tax attributable to parent 21,006 vs 16,665 (26.05%), EPS 3.70 vs 2.93 (0.77). Margins: gross 33.45% (-0.04 ppts), operating 5.78% (-0.20 ppts), pretax 7.57% (+0.62 ppts).
Full-width bordered table with four columns (item, 2026 9M, 2025 9M, YoY); three shaded rows at the bottom highlight margins.
2026 9M revenue mix: CVS and Other Retail 56%, F&B and Feeds 30%, Others 11%, Container and Packaging 3%. Printed NT$M figures 2025 1-9 vs 2026 1-9: F&B and Feeds 147,177 to 159,734 (+9%), CVS and Other Retail 292,346 to 303,519 (+4%), Container and Packaging 21,370 to 16,663 (-22%), Others 54,272 to 57,089 (+5%).
3D pie chart on the left and a four-group clustered column chart on the right with growth arrows above each pair; grey bars for 2025 and pink bars for 2026.
2026 9M segment income mix: F&B and Feeds 48%, CVS and Other Retail 31%, Others 16%, Container and Packaging 5%. Printed NT$M figures 2025 1-9 vs 2026 1-9: F&B and Feeds 13,098 to 13,881 (+6%), CVS and Other Retail 8,686 to 8,902 (+2%), Container and Packaging 3,066 to 1,629 (-47%), Others 4,094 to 4,630 (+13%).
Same template as the revenue slide: 3D pie on the left, clustered columns with growth arrows on the right.
Six KPI bubbles: Revenue YoY Growth 6.09%, Revenue 5Y CAGR 8.41%, Gross Profit YoY Growth 3.31%, OP 5Y CAGR 3.56%, OP YoY Growth 0.59%, EPS YoY Growth 8.57%. Two column charts show 26Q3 Revenue and 26Q3 Operating Profit for 3Q 21 to 3Q 26 with trend lines; bar values are not labelled.
Row of six alternating pale and solid orange circles at the top; two side-by-side column charts below with dotted trend lines and the latest quarter highlighted in pink.
Six KPI bubbles: Revenue YoY Growth 4.24%, Revenue 5Y CAGR 8.46%, Gross Profit YoY Growth 4.10%, OP 5Y CAGR 6.05%, OP YoY Growth 0.85%, EPS YoY Growth 26.28%. Charts of 9M Revenues and 9M Operating Profit for 21 9M to 26 9M have no data labels (values not labelled).
Same template as the Q3 overview: KPI circles above, two column charts with trend lines below.
Consolidated selected items at 2026/9/30 vs 2025/9/30 (NTD millions): cash 109,251 vs 100,043; current financial assets 48,789 vs 30,099; total assets 765,705 vs 717,115; borrowings 195,340 vs 179,302; total equity 221,034 vs 198,977. ROE 14.19% vs 12.85%; current ratio 87.65% vs 87.57%; interest-bearing liabilities to equity 88.38% vs 90.11%; net interest-bearing liabilities to equity 38.95% vs 39.83%.
Table with amount and percent sub-columns for each date; shaded ratio rows at the bottom; footnotes on financial assets and lease liabilities.
Cash flow bridge 2026 1-9 vs 2025 1-9 (NTD millions): beginning balance 103,180 vs 100,442; operating activities 57,654 vs 58,404; investing (27,587) vs (36,355) including capital expenditure (21,420) vs (29,168); financing (23,862) vs (20,030) including cash dividends (17,046) vs (17,046); ending balance 109,251 vs 100,043.
Two-column comparison table with shaded activity rows, italic sub-rows and a solid orange ending-balance row; capex footnote below.
Combo chart of cash dividends per share and payout ratio for 2016-2025. Printed dividends: 2.1, 5.5, 2.5, 2.5, 2.7, 2.7, 3.15, 3, 3, 3; payout ratios: 82%, 78%, 81%, 75%, 71%, 77%, 104%, 93%, 82%, 87%. Text states dividends were distributed for 43 consecutive years with a cumulative payout of NT$88.3 in stock and cash dividends.
Full-width column chart with an orange payout-ratio line on a secondary axis, legend below and a summary sentence at the bottom.
Five panels: Brand Recognition (Top 25 Global Brands in Taiwan; Green Procurement Excellence Award for 12 consecutive years), Enterprise Awards, Sustainability and Low-Carbon (IFRS sustainability disclosure, carbon cost management, Xinshih logistics park solar operation in 2025), Corporate Governance (more than one-third independent directors; executive assessment tied to ESG) and Social Responsibility (human rights policy; Genki Select Animal Welfare Eggs).
Two-column card layout with colored title underlines, small icons per card and award badges in the bottom right.
Targets: water withdrawal intensity below 1.00 million liters per $10 million sales revenue; internal carbon fee of NTD 300/ton CO2e; consolidated GHG intensity cut of 1% per year in 2026 (individual 1.5%) and 38% below 2005 levels by 2030; plastic reduction of 45 tons per year in 2026; COD below 48mg/L in 2026 and below 46mg/L in 2028. A line chart for 2022-2025 prints water intensity 0.9, 0.89, 0.9, 0.85 and GHG intensity 35.52, 34.76, 33.2, 30.67.
Five outlined boxes in a grid; the GHG box includes an illustration and a dual-axis line chart with labelled points.
Section divider reading "Q&A" that opens the question-and-answer session; no figures.
Centered grey overlapping-circle icon with large Q&A text on a white background.
Section divider reading "Appendix" introducing the supporting slides on group structure, regional footprint, logistics parks and annual results.
Overlapping grey circle icon, large title and a thin blue underline, centered on a white background.
Org chart under Uni-President (1216TT) in four columns with holdings as of 2026/9/30, including Uni-President China (220 HK) 72.98%, PCSC (2912TT) 45.80%, Uni-Wonder (Taiwan Starbucks) 100%, Philippine 7-11 (SEVN PM) 56.88%, Ton-Yi Industrial (9907TT) 47.22%, President Packaging 50.58%, Scinopharm (1789TT) 46.54% and President Securities (2855TT) 34.37%. The footnote says only major subsidiaries are shown.
Red banner across the top with four rounded columns (F&B, Retail & Logistics, Container & Packaging, Others) holding white entity cards with ownership percentages.
Regional map listing operations in Vietnam, Thailand, Indonesia, the Philippines, South Korea, China and Taiwan (Headquarters). Printed store counts as of 2026/9/30: China 7-11 (Shanghai and Zhejiang) over 700 stores, Philippines 7-11 over 4,700, Taiwan PCSC over 7,300 and Uni Prosperity over 280. Four value-chain pillars: Manufacture + R&D, Trade + Circulation, Experience + Retail, Alliance + Integration.
Central Asia map with orange highlighted countries and curved connector lines to text blocks on both sides; four colored pillar labels with icons along the bottom.
Taiwan map of group logistics parks: Taoyuan Aerotropolis, Minfeng and U-PARK Zhihui (opening in 2029), Anle Distribution Center, Taichung Port (P1 opening in 26H1, P2 in 2029), Jiatai Warehouse and Tainan Xinshih (opened in 2025). Right side lists Synergy, Efficiency, Sustainability and Win-Win themes.
Left column of brand logo hexagons, central Taiwan map with pins and rendering photos, right-hand circular flow of four themes with short descriptions.
Full-year 2025 vs 2024 consolidated results in NTD millions: Revenue 672,864 vs 657,637 (2.32%), Gross Profit 222,580 vs 215,129 (3.46%), Operating Profit 34,871 vs 33,827 (3.09%), Profit Before Tax 41,496 vs 42,227 (-1.73%), Profit After Tax attributable to parent 19,628 vs 20,673 (-5.05%), EPS 3.45 vs 3.64 (-5.22%), cash dividend per share 3.00 vs 3.00. Gross margin 33.08% vs 32.71%; operating margin 5.18% vs 5.14%.
Full-width bordered table with a grey dividend row and shaded margin rows, matching the style of the 9M highlight table.
Συχνές ερωτήσεις σχετικά με αυτή τη διαφάνεια και το βασικό περιεχόμενο παρουσίασης.
It is an 18-page investor deck from Uni-President Enterprises Corp. (TWSE: 1216) dated 17 November 2026. It covers consolidated results through the first nine months of 2026, with revenue, profit, segment, balance sheet, cash flow, dividend and ESG slides.
It is the English version filed on Taiwan's Market Observation Post System (MOPS) for the company's investor conference (法說會). A Chinese-language version of the presentation also exists on MOPS.
Slide 3 prints revenue of 537,005 (up 4.24%), operating profit of 31,048 (up 0.85%), profit after tax attributable to the parent of 21,006 (up 26.05%) and EPS of 3.70 versus 2.93, all in NTD millions except EPS.
Slides 4 and 5 split revenue and income into F&B and Feeds, CVS and Other Retail, Container and Packaging, and Others. They show 2025 1-9 and 2026 1-9 values with printed growth rates.
Yes. Slide 10 charts cash dividends and payout ratios for 2016-2025, and slide 8 lists total assets, borrowings, equity, ROE and leverage ratios at 2026/9/30 versus 2025/9/30.
The layouts are a useful reference: highlights table, KPI bubbles, segment pie plus column charts, balance sheet and cash flow tables, and an org chart. The content and branding belong to Uni-President, so build your own slides with your data and identity.
Slides 11 and 12 cover awards, governance, low-carbon plans and targets such as a 38% GHG cut versus 2005 levels by 2030, an internal carbon fee of NTD 300/ton CO2e and COD limits for 2026 and 2028.
No. The deck's own disclaimer on slide 2 says it is not an offer or investment advice and contains forward-looking statements. Check the original MOPS filing and the company's financial statements before making decisions.

Create Your Own Slides
Turn your ideas into professional presentations in seconds with 2slides AI.
Αναφερθείτε σε επαγγελματικές σχεδιάσεις, επιλέξτε το στυλ σας και δημιουργήστε σλάιντ με τέλεια απόδοση κειμένου. Τροφοδοτείται από το Nano Banana—ξεκινήστε να δημιουργείτε την παρουσίασή σας τώρα.
Ο Πράκτορας AI σας για διαφάνειες. Εξοικονομήστε χρόνο, λάμψτε πιο γρήγορα με έξυπνη δημιουργία παρουσιάσεων.


© 2026 2slides. Όλα τα δικαιώματα διατηρούνται.