
Ανήκει στη συλλογή Παραδείγματα παρουσιάσεων για επενδυτές
Strategy's Q3 2026 earnings presentation (October 29, 2026): 848,517 BTC held, a ~$20.9B Q3 digital asset gain, net income of $19.1B and diluted EPS of $44.75, plus digital credit (STRF, STRC, STRE, STRK, STRD). It is organized into Financial Results (CFO Andrew Kang), Digital Equity (CEO Phong Le), Digital Credit, STRC Deep Dive, Digital Capital (Executive Chairman Michael Saylor), Future Outlook, Q&A and Appendix. This US earnings deck accompanies the quarterly results; Strategy files its results with the SEC and the safe harbor references its 10-Q.
Χρησιμοποιεί το εξώφυλλο αυτής της παρουσίασης ως πρότυπο στυλ για διαφάνειες με το δικό σας περιεχόμενο. Ή επιλέξτε οποιαδήποτε σελίδα παρακάτω για να χρησιμοποιήσετε τη διάταξή της ως αναφορά.
Γρήγορη Πλοήγηση
Ετικέτες
Κοινοποίηση διαφανειών
Strategy's Q3 2026 earnings presentation (October 29, 2026): 848,517 BTC held, a ~$20.9B Q3 digital asset gain, net income of $19.1B and diluted EPS of $44.75, plus digital credit (STRF, STRC, STRE, STRK, STRD). It is organized into Financial Results (CFO Andrew Kang), Digital Equity (CEO Phong Le), Digital Credit, STRC Deep Dive, Digital Capital (Executive Chairman Michael Saylor), Future Outlook, Q&A and Appendix. This US earnings deck accompanies the quarterly results; Strategy files its results with the SEC and the safe harbor references its 10-Q.
Λεπτομερής προβολή κάθε σελίδας διαφάνειας, συμπεριλαμβανομένης της διάταξης, βασικού περιεχομένου και οπτικών στοιχείων.
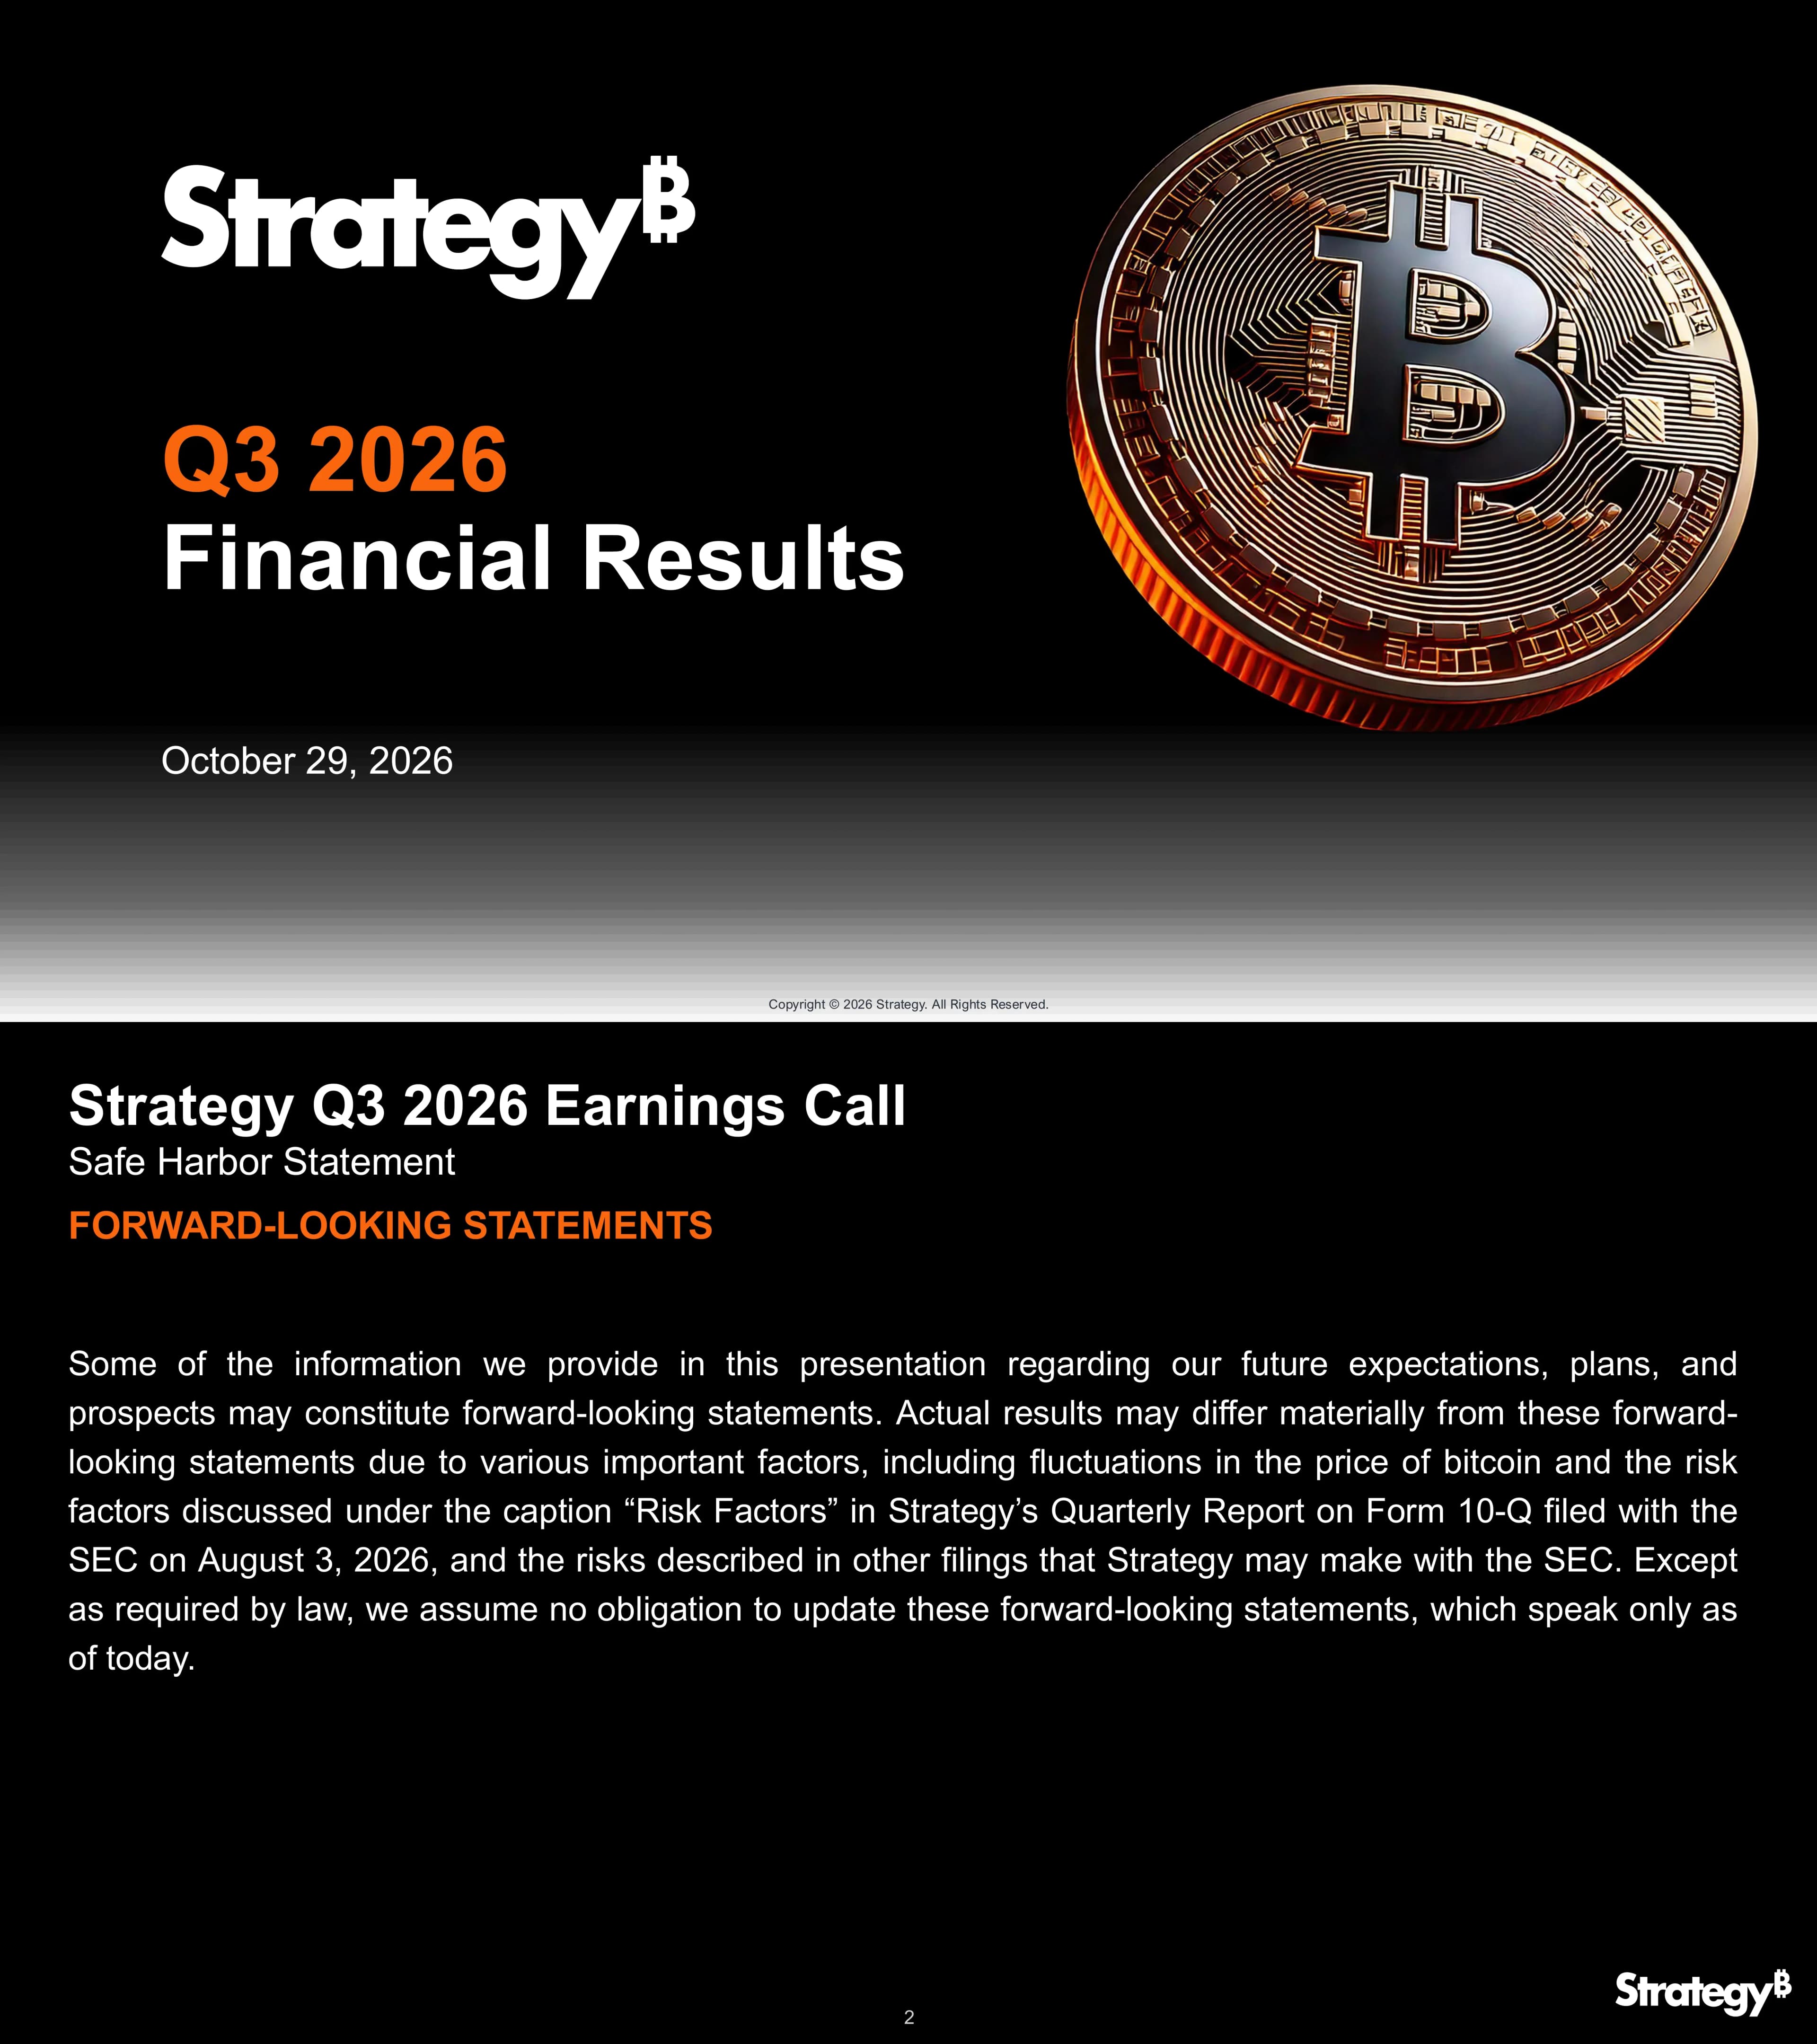
Cover slide for Strategy's Q3 2026 Financial Results presentation, dated October 29, 2026.
Cover: Strategy₿ logo top-left, large white title and date on black, copper bitcoin coin render on the right
Forward-looking statements disclaimer. It points to the risk factors in the 10-Q filed with the SEC on Aug 3, 2026 and notes bitcoin price fluctuation risk.
Text-only disclaimer page with heading and small paragraphs on black
Section divider introducing Andrew Kang, EVP & CFO, who presents the financial results section.
Section divider: logo top-left, orange title, speaker name over dark background
Three columns summarize the quarter. Digital Capital: 848,517 BTC and a $21B Q3 digital asset gain. Digital Equity: $62B market cap and +76% Q3 MSTR price performance. Digital Credit: $99.27 STRC 1M VWAP and 49 years of dividend coverage. Data as of the 8-K of Oct 26, 2026; market data at the Oct 23 close.
Three-column KPI layout with headline figures and short labels
Strategy has acquired bitcoin in every quarter since Q3 2020. KPIs: 848,517 BTC, a $69B BTC reserve, $64B total acquisition cost, $75K average purchase price, and 4.0% of all BTC ever to exist. Holdings ('000s) grew from 38 in Q3'20 to 447 in Q4'24, 673 in Q4'25, 762 in Q1'26, 846 in Q2'26, 848 in Q3'26 and 849 at 10/25/2026.
KPI strip across the top with a bar chart of holdings by quarter below; latest bar highlighted orange
Bar chart as of Oct 23, 2026: Strategy 848,517 BTC, IBIT 809,780, United States 329,693, China 190,000, FBTC 176,281, GBTC 125,278, WBTC 116,150, Tether 100,000, cbBTC 97,703 and BTCB 65,301.
Ranked vertical bar chart with color legend for Strategy, ETFs, Countries and DeFi
Q1 2026: Berkshire $397B led and Strategy ranked #8 at $54B. Latest available: Berkshire $366B, Google $242B, Amazon $123B, NVIDIA $99B, Meta $83B, Microsoft $77B, and Strategy #7 at $74B ahead of Apple $62B, Tesla $47B and Micron $43B.
Two side-by-side horizontal bar charts; green for cash and short-term investments, gold for bitcoin
Typographic slide pairing the 21M maximum bitcoin supply with a $21B Q3 2026 gain. The footnote states $20.91B as an unaudited management estimate from the 8-K of Oct 5, 2026.
Giant split numeral 21: gold top half for ₿21M, orange bottom half for $21B
Waterfall in $B: 6/30/26 market value $49.7, BTC price change +$21.0, net BTC purchased +$0.2, price change on Q3 purchases ($0.1), reaching $70.8 at 9/30/26. A table shows BTC count rising from 846,000 to 847,666 (1,666 net additions) and price from $58,714 to $83,552.
Waterfall bar chart with a small data table beneath
Five-quarter table (Q3'25 to Q3'26). Operating income: $3.9B, ($17.4B), ($14.5B), ($8.3B), $20.9B. Net income attributable to common: $2.6B, ($12.6B), ($12.8B), ($8.6B), $19.1B. Diluted EPS: $8.42, ($42.93), ($38.25), ($24.45), $44.75 per share.
Financial data table with five quarterly columns and three metric rows
BTC Yield (sats per share): 2020 56,598; 2021 83,353 (+47.3%); 2022 84,872 (+1.8%); 2023 91,097 (+7.3%); 2024 158,826 (+74.3%); 2025 194,986 (+22.8%); 10/25/2026 187,753 (-3.7%). BTC Yield is a 23% CAGR from 2020 to 2026 YTD.
Bar chart of sats per share by year with percentage change labels and CAGR callout
Strategy raised $21B YTD in 2026. Capital raised: 2024 $22.6B (Q1 1.5, Q2 0.8, Q3 2.1, Q4 18.1); 2025 $25.3B (7.7, 6.9, 5.1, 5.5); 2026 YTD $21.2B (Q1 7.4, Q2 8.4, Q3 5.4, Q4 QTD 0.06).
Quarterly bar chart grouped by year with BTC price line overlaid
Balance sheet 6/30/26 vs 9/30/26: digital assets $49.7B to $70.8B; cash and ST investments $2.4B to $5.9B; deferred tax $0.0B to ($1.4B); debt $6.7B unchanged; preferred equity $14.4B to $13.1B; common equity $30.9B to $55.4B; total equity $45.3B to $68.5B (+51%). Callouts: 1,666 net BTC acquired, $5.80B USD assets at quarter end, $1.38B of STRC repurchased in Q3.
Balance sheet table with two period columns and three side callouts
Assets: BTC reserve $68.9B plus USD assets $5.1B. Liabilities and equity: OTM debt $6.7B, preferred $13.3B, net reserve $53.9B ($67.3B net of OTM debt). Key metrics: 1.15x mNAV, 1.28x amplification, 2.38% net leverage, 3.4 years USD duration, with BTC at $81,200 and MSTR at $146.01.
Two stacked bars (assets vs liabilities and equity) beside a metrics panel
BTC Rating of 42x. Six converts total $6,714M notional: 2028 $1,010M (conversion $183.19, bond $115.73); 2030B $2,000M ($433.43, $93.13); 2029 $1,500M ($672.40, $90.88); 2030A $800M ($149.77, $125.16); 2031 $604M ($232.72, $104.00); 2032 $800M ($204.33, $116.76). Only two trade below par, the earliest put is March 2028, and the weighted average coupon is 0.515%.
Data table of six convertible notes with put, maturity, conversion price and bond price columns
Seventeen firms rate Strategy Buy: AGP (new), Barclays, Bernstein, B. Riley, BTIG, Canaccord, Cantor, Citi, Clear Street, Compass Point, HC Wainwright, Maxim, Mizuho, Siebert, StoneX, TD Cowen and Texas Capital. Average BTC target is $111K and average MSTR price target is $248 (range $165 Mizuho to $435 StoneX), per Bloomberg as of Oct 26, 2026.
Analyst table listing firm, rating and targets with summary averages
99.3% of MSTR votes cast were FOR (64% of shares outstanding). Timeline: approved Oct 28, 2026; STRC first record Nov 1 and payment Nov 2; STRF, STRK and STRD first record Jan 1 and payment Jan 4. Dividends accrue every calendar day.
Headline vote result with horizontal timeline of record and payment dates
Section divider introducing Phong Le, President & CEO, for the Digital Equity section.
Section divider: logo top-left, orange title, speaker name on dark background
Six numbered points: MSTR as amplified BTC (76% vs 43% BTC return in Q3); 176,017 BTC added YTD 2026 and #7 treasury vs the S&P 500; $21B raised YTD as the #4 US equity issuer; net leverage cut to 2.4% from 8.4% in Q2; BTC could fall 78% (~$18K) before reaching 1x BTC Rating; objective of doubling BPS in 7 years with 23% BPS CAGR since Dec 2020.
Numbered list of six summary points with bold lead-ins
MSTR (the operating business) equals amplified bitcoin (more bitcoin per share) plus digital credit (STRF, STRC, STRE, STRK, STRD and future innovation).
Three circle icons arranged as an equation with equals and plus signs
30-day historical volatility as of Oct 23, 2026: BTC 36% (digital capital), MSTR 82% (digital equity), STRC 10% (digital credit, 12% dividend rate).
Transformer coil diagram with three labeled outputs and volatility figures
S&P 500 top 10 by options open interest as % of market cap: FSLR 70%, MSTR 65% (#2), LULU 46%, COIN 44%, SMCI 38%. By daily volume as % of market cap: SMCI 6.7%, MSTR 5.6% (#2), CTVA 5.5%. MSTR has $38B options OI (#17) vs NVDA $324B and $3.3B daily volume (#18). FactSet, Oct 23, 2026.
Two ranked bar charts side by side with MSTR highlighted
2024 (#2): Boeing $18.5B, Strategy $16.3B, Arthur J. Gallagher $8.5B, Welltower $7.4B, GE HealthCare $5.1B. 2025 (#1): Strategy $23.3B, Bitmine $17.6B, Welltower $9.2B, Medline $6.0B, Brown & Brown $4.4B. 2026 YTD (#4): SpaceX $86.3B, Alphabet $25.7B, Intel $23.0B, Strategy $21.2B, Oracle $20.0B. Source: TD Securities / ECM Analytics.
Three bar panels, one per year, with Strategy bars highlighted
Cumulative return Jan 2023 to Dec 2024: MSTR +1,897% vs BTC +454%, a 3.6x outperformance. The footnote notes MSTR has underperformed bitcoin since Dec 31, 2024.
Two-line cumulative return chart with end-point labels and outperformance callout
Bitcoin could fall 78% today before reaching the BTC Floor; in 2022 it traded below it. Past vs present: holdings 132,500 BTC (37% encumbered) vs 848,517 BTC (0% encumbered); BTC added 18,459 vs 208,486; BTC floor $18,151 (10% above spot) vs $17,662 (78% below spot); BTC Rating 0.9x vs 4.6x; net leverage 110% vs 2.4%; USD duration 0 vs 3.4 years. Price charts: $68K (8-Nov-21) to $17K (31-Dec-22), and $124K (6-Oct-25) to a $59K low and $81K (23-Oct-26).
Two mini price charts above a past-versus-present comparison table
Jan 2023 vs Oct 2026: BTC reserve 132,500 BTC vs 848,517 BTC; reserve value $2.2B vs $68.9B; USD assets $0 vs $5.1B; digital credit $0 vs $13.3B; net leverage 108% vs 2.4%.
Two-column comparison table with five metric rows
From Oct 6, 2025 to Oct 25, 2026 BTC price fell from $124,387 to $81,200, while Strategy holdings rose from 640K to 849K BTC.
Dual-line chart with BTC price line and stepped holdings line
MSTR equals Net BTC (net reserve $53.9B amplified 1.28x) plus BTC $ Gain times a Multiple (potential future BTC dollar gain, which grows as digital credit is issued). mNAV can expand when the market believes Strategy can issue credit accretively.
Formula diagram with labeled terms and explanatory callouts
Median daily mNAV: 2021 2.28x, 2023 2.57x, 2024 2.60x, versus 1.15x today. The current bar is an outline because it is the current value, not a median.
Four-bar chart with the current bar drawn as an outline
Four-step flow: sell digital credit (target 10-20% of BTC reserves annually), generate amplification, increase BPS, outperform BTC. Three levers: lower cost of credit, higher digital credit sales, higher mNAV.
Four-step icon flow with a boxed list of three levers
Section divider for the Digital Credit section.
Section divider: logo top-left, large orange title on dark background
Six points: ecosystem scaling fast with 6 issuers and a $16B market in 20 months; STRC returned to health at $99-$100; USD assets grew from $2.55B to $5.07B; $2B of STRC repurchased with $957M capacity remaining; daily dividends approved for STRF, STRC, STRK and STRD; improved credit profile with 40% USD strength and 49 years of dividend coverage.
Numbered list of six summary points
Metaphor: iron 75% plus chromium 25% makes stainless steel; bitcoin 60% (46 years of coverage) plus dollars 40% (3.4 years of coverage) makes digital credit, shown as a glowing glass cube.
Illustrated metaphor with two alloy equations and photoreal renders
Strategy holds about 84% share at $13B. The annotated timeline Jan 2025 to Oct 2026 includes STRK IPO $730M (first digital credit security), STRF $850M, STRD $1.2B, STRC $2.8B (first variable-rate preferred), STRE $894M (euro-denominated), SATA $200M (2nd BTC treasury issuer), BMNP $350M (3rd issuer, ETH), CHAD $14M (4th issuer, SOL), MORE $13M, SATS $700M, and STRC Layer 2 adoption of 20+ products and $470M+ STRC held.
Annotated line chart of notional outstanding with dated IPO callouts
Tax-equivalent yields at 37% federal / up to 52% combined: STRD 22.8% / 29.9%, STRE 20.1% / 26.4%, STRC 19.2% / 25.2%, STRK 18.3% / 24.1%, STRF 15.7% / 20.6%. Comparisons: private credit 10.0%, junk bonds 8.2%, bank preferreds 7.4%, IG 5.9%, MBS 5.8%, T-bills 4.3%, CP 4.1%, money markets 3.7%, bank accounts 0.4%. As of 10/23/26.
Ranked bar chart comparing digital credit with other credit asset classes
Strategy expects return-of-capital treatment for 10+ years. Illustrative amount kept per $100 dividend: ROC $100 (tax deferred, lowers basis), qualified dividends $65-80 (20-35% tax), taxable interest $48-63 (37-52% tax). ROC applies because of preferred equity and negative E&P.
Three-bar comparison of cash retained per $100 with short explanation
Greek-temple diagram with six pillars: USD Reserve $4.83B (preferred dividends and interest, at least 1 year); USD Cash $242M (highlighted); BTC Monetization; Digital Credit repurchases with $957M authorization remaining; MSTR repurchases with $1.0B remaining; STRC dividend at 12.00%, daily, reviewed monthly (daily from Nov 1, 2026).
Temple graphic with six labeled pillars and one highlighted pillar
USD Cash gives flexible liquidity for BTC purchases and buybacks; USD Reserve supports preferred dividends and debt interest. USD assets of $5.07B consist of a $4.83B reserve and $242M cash.
Two description cards beside a stacked bar, green palette
USD duration rose from 0.5 to 3.4 years across Dec 2025 to Oct 2026, with Jun-Oct 2026 shaded. USD Strength (USD duration as % of blended preferred Macaulay duration) rose from 6% to 40%.
Two line charts side by side with a shaded period
40 of 40 dividends paid in cash: STRK 7 since Mar 2025; STRF 6 since Jun 2025; STRD 5 since Sep 2025; STRC 18 since Aug 2025 (monthly, then semi-monthly from Jul 15, 2026); STRE 4 since Dec 2025. STRD is non-cumulative.
Checkmark timeline Mar 2025 to Sep 2026 with one row per security
Vertical BTC ARR scale with four zones: above 10.6% hurdle, equity and credit both thrive; 2.2% to 10.6%, equity may underperform bitcoin but dividends still covered; -17.4% floor to 2.2% breakeven, equity underperforms and credit may perform; below -17.4%, credit stressed and restructuring may be required.
Vertical scale divided into four labeled zones
Log-scale chart of rolling 4-year annualized BTC return (now 42.7%) vs US M2 4-year growth (1.9%), with dashed thresholds at hurdle 10.6%, breakeven 2.2% and floor -17.4%. It covers 148 rolling windows from July 2014 to Oct 2026.
Log-scale line chart Jan 2015-2026 with dashed threshold lines
Assumes BTC at $81,200, $5.1B USD assets, 40% volatility and 10% ARR. Debt totals $6,714M (42.0x BTC Rating, floor $1,931). Preferreds: STRF $1,284M (10.4 yr duration, 23.6x, 4 bps), STRC $8,391M (8.3, 6.1x, 54 bps), STRE $868M (8.1, 5.7x, 61 bps), STRK $1,402M (8.9, 5.1x, 76 bps), STRD $1,402M (7.2, 4.6x, 86 bps). Total preferred $13,347M; debt plus preferred $20,061M, 6.2 years, 4.6x, BTC floor $17,662.
Dense capital structure table with credit-spread color legend
STRF $101.20, 9.88% yield, 487 bps spread, 4 bps BTC credit; STRC $99.36, 12.08%, 714 bps, 54 bps; STRE EUR 78.88, 12.68%, 941 bps, 61 bps; STRK $69.30, 11.54%, 967 bps, 76 bps; STRD $69.71, 14.35%, 945 bps, 86 bps. Benchmarks: ICE BofA US Corporate 5.84% / 91 bps, HY 8.14% / 338 bps, S&P Lincoln senior debt 10.28% / 642 bps. Modeled BTC credit of 4-86 bps sits below the 91 bps IG spread, yet digital credit trades at 487-967 bps.
Spread comparison table with benchmark rows and a callout box
Section divider for the STRC Deep Dive section.
Section divider: logo top-left, large orange title on dark background
Effective yield 12.1% (tax-deferred ROC; 19.2% tax-equivalent); liquidity $160M average daily; volatility 10.1% (30D); USD strength 40% (3.4 years); notional $8.4B; $2.0B repurchased with $957M remaining; USD assets $5.1B; BTC reserve $69B; BTC rating 6.1x; BTC duration 46 years.
KPI grid of ten metric tiles
STRC close Jun-Oct 2026 dipped to about $74 in late June and recovered to $99.36. Actions: new capital framework, dividend raised to 12%, semi-monthly payments, USD assets built to $5.1B, $2.0B of STRC repurchased, daily dividends vote approved.
Price line chart beside a checklist of actions
3/17/26: retail 55% ($2,744M), HNWI ($1M+) 24% ($1,193M), institutional 21% ($1,081M), so HNWI plus institutional 45% ($2.3B). 9/30/26: retail 48% ($4,028M), HNWI 29% ($2,434M), institutional 23% ($1,930M), so 52% (+7 pts), $4.4B. Broadridge data.
Two stacked horizontal bars comparing ownership at two dates
BlackRock iShares PFF (#1 preferred ETF, $12B AUM): STRC $415M at 3.49% weight, ahead of Boeing at 3.40%. VanEck PFXF (#6, $2B AUM): STRC $169M at 7.58%, ahead of Boeing at 7.55%. Other holdings include Alphabet, SMCI, HPE, Wells Fargo, Oracle, BofA, Citi, NextEra and Southern Co.
Two holdings tables with company logos
$550M+ of STRC sits in products and treasuries: Stablecoins & DeFi $225M; Tokenization $229M; Funds & ETPs $15M; Cash & yield accounts $2M; Corporate treasuries $100M held. Partners include Apyx, Pendle, Kraken, Ondo, 21Shares, Castle, Anchorage Digital, OranjeBTC and Strive.
Five-column layout with partner logos and market-size figures
Digital credit that works every day: weekends and holidays count as record dates, aligning with ownership periods and mirroring money-market daily accrual. Built for the digital transformation of capital markets: bitcoin trades 24/7 and tokenization uses a 365-day framework.
Bullet text beside a glowing earth image with a bitcoin symbol in a clock ring
Event promotion for Strategy World 2027 in Orlando, Mar 29 to Apr 1, with a dusk photo of the Signia by Hilton hotel, a cartoon mascot and a Corporations₿ headline.
Event promo with hotel photo, mascot and large headline
Section divider introducing Michael Saylor, Founder & Executive Chairman.
Section divider: logo top-left, orange title, speaker name on dark background
Six points: bitcoin is entering a bull market at 21% above its 200-week average; dominance is 67% vs 47% at the Nov 2021 crypto ATH; bitcoin ETFs drew $6.3B inflows in Q3; Bitcoin Banking Adoption Index is 34% vs 24% in 2025; modest credit could absorb all new supply; Strategy is the most tokenized company with $509M tokenized stock value.
Numbered list of six summary points
BTC price vs the 200-week moving average, 2016-2026, shows a 21% premium, and 78% of BTC history was spent above the current premium. Source: Coin Metrics, Oct 23, 2026.
Line chart of price and 200-week MA with premium callouts
Bitcoin's market cap dominance is now 67%, vs 47% in Nov 2021. Chart covers 2021-2026; source CoinGecko.
Dominance line chart 2021-2026 with endpoint labels
Drivers: fiscal debasement; bank adoption (US bank custody and lending); bitcoin-backed credit; momentum and capital flows (ETF inflows); tokenization and 24/7 markets; AI disruption; and the April 2028 halving, which cuts weekly supply from 3,150 to 1,575 BTC.
Icon table with driver and why-it-matters columns
Monthly US spot bitcoin ETF net flows: Jan -$1.6B, Feb -$0.2B, Mar +$1.3B, Apr +$2.0B, May -$2.4B, Jun -$4.5B, Jul +$0.2B, Aug +$3.5B, Sep +$2.6B, with Q3 shaded. Source: Farside Investors.
BTC price line above monthly net flow bars with Q3 shaded
FY2026 federal cash flows total $7.40T spending, with net interest of $1.05T highlighted in orange against Social Security $1.67T, Medicare $1.07T, defense $0.97T. Inflows include individual income tax $2.85T, payroll $1.81T and deficit financing $1.99T. $19 of every $100 of receipts goes to interest (up from $18.50 in FY2025), and interest now exceeds defense.
Sankey diagram of inflows and outflows with a waffle chart
Treasury proposed rules on who can issue and sell stablecoins; the SEC opened a path for tokenized US stocks to trade on-chain; the CFTC sent crypto market rules to White House review and opened comment on retail crypto leverage. Footnote: the CLARITY Act failed a Senate procedural vote on Sep 15.
Icon table with agency and update columns
Harvey-ball matrix of 25 global banks across Trading & Custody, Products, Margin and Leadership, with Q2 and Q3 index. Fidelity 71% to 77%; JPMorgan 43% to 47%; BNY 46%; Goldman 45%; Morgan Stanley 43% to 45%; Citigroup 43%; Santander 35% to 40%; Standard Chartered 28% to 35%; Deutsche Bank 22% to 27%; Lloyds 17% to 22%. Overall index 32% to 34%.
Dense Harvey-ball matrix with bank rows and dimension columns
Average adoption across the top 25 banks: Dec 2023 9%, Dec 2024 14%, Dec 2025 24%, Oct 2026 34%, a gain of 25 points.
Four-bar chart with +25 pts annotation
Bitcoin adoption: Morgan Stanley E*TRADE crypto rollout with Zerohash custody; Citigroup custody later in 2026; Deutsche Bank toward a 2026 custody launch; Standard Chartered extended institutional BTC/ETH spot to the UAE; Santander bitcoin ETF access for Spanish retail. Broader: 21-bank stablecoin consortium (H1 2027 launch); Barclays first UK tokenized-deposit transactions; Lloyds via Project Agora; UK tokenization taskforce of 54 firms.
Two-column bulleted list: bitcoin adoption and broader updates
That is about 1.5% of weekly new US bank lending. Today vs after the April 2028 halving: block reward 3.125 vs 1.5625 BTC; 450 vs 225 BTC/day; ~$37M vs ~$18M/day; 3,150 vs 1,575 BTC/week; ~$256M vs ~$128M/week; ~$13.3B vs ~$6.7B/year. Weekly new US bank lending is $17.1B vs $0.26B of new bitcoin ($0.13B after halving).
Today vs post-halving comparison table with a bar chart
Tokenized stock value: Strategy $509M (STRC $229M plus MSTR $280M), Circle $387M, SpaceX $268M, NVIDIA $153M, Micron $132M, SanDisk $125M, Tesla $125M, Alphabet $115M, Intel $88M, Coinbase $46M. DefiLlama, Oct 23, 2026.
Ranked bar chart with Strategy split into STRC and MSTR segments
A single grey cube (Traditional Security, one interface) becomes a fragmented orange and grey cube (Tokenized Security, same capital, more interfaces). Callouts: 24/7 markets, global distribution, programmable collateral, faster settlement, agentic finance, product innovation.
3D cube illustration pair with six callouts
Stablecoins (0% yield from issuers under the GENIUS Act from Jan 18, 2027) lead to tokenized STRC with a 12% dividend (digital credit). Bitcoin holders seeking upside lead to tokenized MSTR, amplified bitcoin (digital equity).
Two cube-graphic flows from on-chain capital to Strategy securities
Ranked from most to least durable: Bitcoin (fixed 21M supply), land/real estate/commodities, energy/utilities/infrastructure, telecom, semiconductors and defense, healthcare and pharma, banking and insurance, consumer brands, manufacturing/retail/logistics, legal/consulting/education, and software/services/media (AI replicates the work).
Ranked vertical list with an icon per sector
Abundant: GPT-4-level AI cost per million tokens fell from $37.50 (Oct 2023) to $0.06 (Oct 2026), about 650x cheaper. Scarce: bitcoin max supply stays fixed at 21M, with 19.5M mined in Oct 2023 and 20.1M in Oct 2026.
Split chart: falling AI cost on one side, fixed bitcoin supply on the other
Industry leaders fund the Bitcoin protocol security community. Members shown: Anchorage Digital, ARK Invest, BlackRock, Block, Blockstream, Coinbase, Fidelity Digital Assets, Galaxy and Strategy.
Paragraph with a logo wall
Section divider for the Future Outlook section.
Section divider: logo top-left, large orange title on dark background
Treemap of global assets: real estate $411T, bonds $353T, equities $164T, money $141T, gold $29T (18x bitcoin), art/cars/collectibles $28T, bitcoin $1.6T (0.1%). Source: Jesse Myers (Croesus_BTC), Q2 2026 data.
Treemap with proportional tiles and a highlighted bitcoin tile
One capital network to preserve wealth, move value and program economic activity. Save & Invest: digital capital (bitcoin), digital equity (MSTR), digital credit (STRC/SATA), digital debt (bonds/notes). Move & Program: digital currency (stablecoins), digital money, digital derivatives, digital collateral.
Two lists of four items each under Save & Invest and Move & Program
Three analogies: oil (kerosene lamp fuel to gasoline, plastics, pharmaceuticals), electricity (lighting to motors, computers, data centers, AI), and bitcoin (peer-to-peer electronic cash to capital, equity, credit, debt, currency, money, income, derivatives, collateral, identity, authentication, commerce).
Three columns with icons showing first use and later uses
Treasury companies acquired about 165% of all BTC mined in 2026 YTD. The flywheel: more issuers (4 issuers, 13 securities), a broader investor base ($68B digital equity and $15B digital credit market cap), deeper liquidity, and more capital into bitcoin (220,474 BTC acquired YTD, $18B net deployed).
Circular flywheel diagram with four stages
Nine digital credit securities across 4 issuers added 220,474 BTC in 2026 YTD. Strategy (MSTR): $62B equity cap, $13B credit notional, 848,517 BTC, $21B raised, 176,017 BTC acquired. Strive (ASST) 43,000 BTC; Metaplanet (MTPLF) 44,000 BTC; Smarter Web (SWC) 2,850 BTC. Totals: $68B, $15B, 938,367 BTC, $25B raised, 220,474 BTC acquired.
Issuer comparison table with totals row
Mathematics: Millennium Prize proof claimed by OpenAI's AI under review; 372 open problems solved or advanced. Physics: THOR AI computes metal properties 400x faster; 381K new materials from DeepMind GNoME. Finance: digital credit designed with AI-assisted modeling; $40B attempted fraud blocked by Visa AI in 2024.
Three icon rows for mathematics, physics and finance
30-day volatility by investment horizon: 0-4 months money market / digital money (~0%); 4 months to 4 years digital credit STRC and SATA (~10%); beyond 4 years STRF, STRE, STRK, STRD, SATS, digital capital BTC (~35%) and digital equity MSTR (~80%).
Step chart of volatility versus horizon with labeled instruments
BTC reserve plus USD assets equal the world's 56th largest central bank. Ranking of 60 central banks by total assets: China $7,285B, United States $6,754B, Japan $4,021B, Germany $2,627B, ... Ukraine $75B (#55), Strategy $74B (#56, highlighted orange), Slovakia $63B, Chile $58B, Croatia $45B, New Zealand $43B.
Three-column ranking table of 60 central banks with Strategy row highlighted
Section divider for Q&A with Michael Saylor, Phong Le, Andrew Kang and CJ (Chaitanya Jain).
Section divider: logo top-left, orange title, four speaker names on dark background
Closing thank-you slide.
Centered closing message on black with wordmark
Section divider for the Appendix.
Section divider: logo top-left, large orange title on dark background
Total revenues were $125.4M (3% YoY decrease). Revenue mix: subscription services 55%, support 30%, other services 12%, product licenses 3%. Subscription services revenue ($M): Q3'25 46.0, Q4'25 51.8, Q1'26 58.9, Q2'26 62.9, Q3'26 68.6 (+49% YoY).
Pie chart of revenue mix beside a bar chart of subscription revenue, lime-green accent
Strategy expects US ROC treatment for 10+ years. Return of capital reduces cost basis with 0% current tax (STRE, STRK, STRF, STRD, STRC); qualified dividends are taxed 20-35%; interest income is taxed 37-52%. Bullets: ROC arises from negative tax E&P, and no US dividend withholding is expected for US or non-US investors.
Three-row tax treatment table with bullet points beneath
Wide table from 12/31/2020 to 10/25/2026: total BTC 70,469 to 848,517; Class A 76,230K to 402,714K; Class B 19,640K; basic shares 95,870K to 422,355K; ADSO 451,934K; FDSO at 10/25/2026 426,323K. Convert share counts: 2028 5,513K, 2029 2,231K, 2030A 5,342K, 2030B 4,614K, 2031 2,594K, 2032 3,915K, STRK 1,402K. Options 3,106K; RSU/PSU 862K.
Wide multi-column share count table with many footnotes
Definitions: Bitcoin Per Share (BPS, in sats) is gross BTC divided by Assumed Diluted Shares Outstanding; also ADSO, basic shares outstanding, Satoshi (1/100,000,000 BTC), BTC Yield (% change in BPS), BTC Gain and BTC $ Gain (priced at Coinbase).
Text-only definitions page
Explains how BTC Yield is calculated across measurement and reference periods, with a worked example (BPS 100 to 110 to 125 gives Q2 yield 15% and YTD 25%; 1,000 BTC gives BTC gain 250). Covers why management uses the KPIs and their limitations: they ignore debt and preferred seniority and assume refinancing or conversion.
Dense small-text page with worked example
BPS, BTC Yield, BTC Gain and BTC $ Gain are not financial performance, valuation or liquidity measures. MSTR price can deviate from bitcoin value; ASU 2023-08 fair-value accounting means unrealized gains and losses in net income are not reflected in the KPIs; accretive and dilutive refer only to the KPI.
Text-only continuation page
KPIs ignore the source of capital (non-convertible notes and preferreds increase BPS while adding senior claims). Redemption could require selling stock or bitcoin; perpetual preferred dividends may be paid in cash or (STRK) shares; there are no common dividends; KPIs supplement SEC filings for sophisticated investors.
Text-only continuation page
mNAV equals MSTR price divided by Net Bitcoin Per Share (USD), is not equivalent to NAV, and its definition changed July 23, 2026. Net BTC is bitcoin less notional of OTM converts and perpetual preferreds plus USD assets. Also defines Fully Diluted Shares Outstanding (only in-the-money instruments).
Text-only definitions page
When mNAV is above 1, common issuance to buy bitcoin is accretive to Net BPS; below 1, it is dilutive. Covers preferred issued above or below notional and defines Net BPS ($) and BPS ($).
Text-only continuation page
Assumptions and limitations: notional vs liquidation amounts, in/out-of-the-money determination, FX at 12:30 PM NY on Friday, and no transaction costs. Net BTC can fall to or below zero, is not book value, and supplements SEC filings.
Text-only continuation page
Amplification equals BTC Reserve divided by Net Reserve. BTC Reserve is bitcoin count times the Coinbase price; Net Reserve is BTC Reserve less OTM convert notional and perpetual preferred notional (excluding in-the-money STRK) plus USD assets. A higher bitcoin price lowers amplification; the definition changed July 23, 2026.
Text-only definitions page
Dense glossary: BTC ARR, BTC Volatility, BTC Price, BTC Rating, BTC Risk (lognormal model), BTC Credit, BTC Duration, Duration, Macaulay Duration formula (1 + y/n)/y, Effective Yield, Risk-Free Rate (3-month Treasury), BSE Annualized Return (since Aug 10, 2020), Hist Volatility 30D and 1Y, Market Cap.
Dense two-column glossary of terms
Glossary: BTC Reserve, Digital Credit Duration, Net Leverage, USD Assets (USD Reserve plus USD Cash), USD Cash, USD Duration, USD Reserve, USD Strength, Equity Component %, BTC Breakeven ARR, BTC Floor ARR, BTC Hurdle ARR, and Tax-Equivalent Yield (37% marginal rate, ROC assumptions).
Dense glossary text page
Legal text: Strategy is not a registered money market fund (STRC is not NAV-priced, has no required backing assets and no stable value) and is not an ETP/ETF under the Investment Company Act (Delaware corporation, taxed at entity level, no daily NAV transparency). Informational only, not investment, tax or legal advice.
Text-only legal disclosure page
Συχνές ερωτήσεις σχετικά με αυτή τη διαφάνεια και το βασικό περιεχόμενο παρουσίασης.
It is Strategy's 96-slide earnings deck dated October 29, 2026. Sections are Financial Results, Digital Equity, Digital Credit, STRC Deep Dive, Digital Capital, Future Outlook, Q&A and an Appendix of definitions. Strategy files its results with the SEC, and the safe harbor references its 10-Q.
Strategy held 848,517 BTC and reported a Q3 digital asset gain of about $20.9B. Net income attributable to common was $19.1B with diluted EPS of $44.75, and total equity rose $23.2B in Q3 to $68.5B.
Digital credit is Strategy's family of preferred securities (STRF, STRC, STRE, STRK, STRD) backed by bitcoin and USD assets. STRC carries a 12% dividend rate, and shareholders approved daily dividends with 99.3% of votes cast in favor. STRC dividends become daily from Nov 1, 2026.
The deck shows mNAV of 1.15x, amplification of 1.28x and net leverage of 2.38%. BTC Yield is measured in sats per share (BPS), which stood at 187,753 on 10/25/2026, and the deck cites a 23% BTC Yield CAGR from 2020 to 2026 YTD.
Andrew Kang, EVP & CFO, presented Financial Results. Phong Le, President & CEO, presented Digital Equity, and Michael Saylor, Founder & Executive Chairman, presented Digital Capital. The Q&A slide lists Saylor, Le, Kang and CJ (Chaitanya Jain).
You can download the deck as a PDF or as a PPTX with all 96 slides. The PPTX was converted from the PDF, so the text is editable in PowerPoint but the layout comes from a conversion. Check fonts, charts and tables after opening.
Borrow the structure: KPI highlight pages, section dividers with speaker names, waterfall and ranked bar charts, and a definitions appendix. The style uses a black background, white bold headings and orange and gold accents. Replace the content with your own data and branding.
No. The deck is informational, and its closing legal page states it is not investment, tax or legal advice. Review Strategy's SEC filings and consult a qualified advisor before making decisions.

Create Your Own Slides
Turn your ideas into professional presentations in seconds with 2slides AI.
Αναφερθείτε σε επαγγελματικές σχεδιάσεις, επιλέξτε το στυλ σας και δημιουργήστε σλάιντ με τέλεια απόδοση κειμένου. Τροφοδοτείται από το Nano Banana—ξεκινήστε να δημιουργείτε την παρουσίασή σας τώρα.
Ο Πράκτορας AI σας για διαφάνειες. Εξοικονομήστε χρόνο, λάμψτε πιο γρήγορα με έξυπνη δημιουργία παρουσιάσεων.


© 2026 2slides. Όλα τα δικαιώματα διατηρούνται.