
Ανήκει στη συλλογή Παραδείγματα παρουσιάσεων για επενδυτές · Παραδείγματα παρουσιάσεων για επενδυτές από την Ιαπωνία
Sony Group FY2026 Q2 earnings presentation (2026年度第2四半期連結業績概要), a 19-page Japanese-language deck originally published on TDnet (Tokyo Stock Exchange Timely Disclosure) on November 5, 2026, covering the three months ended September 30, 2026: sales ¥34,294 hundred million (+10%), operating income ¥6,223 hundred million (+45%), and a raised full-year forecast of ¥130,000 hundred million sales and ¥18,700 hundred million operating income.
Χρησιμοποιεί το εξώφυλλο αυτής της παρουσίασης ως πρότυπο στυλ για διαφάνειες με το δικό σας περιεχόμενο. Ή επιλέξτε οποιαδήποτε σελίδα παρακάτω για να χρησιμοποιήσετε τη διάταξή της ως αναφορά.
Γρήγορη Πλοήγηση
Ετικέτες
Κοινοποίηση διαφανειών
Sony Group FY2026 Q2 earnings presentation (2026年度第2四半期連結業績概要), a 19-page Japanese-language deck originally published on TDnet (Tokyo Stock Exchange Timely Disclosure) on November 5, 2026, covering the three months ended September 30, 2026: sales ¥34,294 hundred million (+10%), operating income ¥6,223 hundred million (+45%), and a raised full-year forecast of ¥130,000 hundred million sales and ¥18,700 hundred million operating income.
Λεπτομερής προβολή κάθε σελίδας διαφάνειας, συμπεριλαμβανομένης της διάταξης, βασικού περιεχομένου και οπτικών στοιχείων.
Cover of Sony Group Corporation's Japanese-language earnings deck for the three months ended September 30, 2026, dated November 5, 2026.
Full-bleed navy background with the SONY wordmark top-left and centered white Japanese title, period subtitle, date and company name.
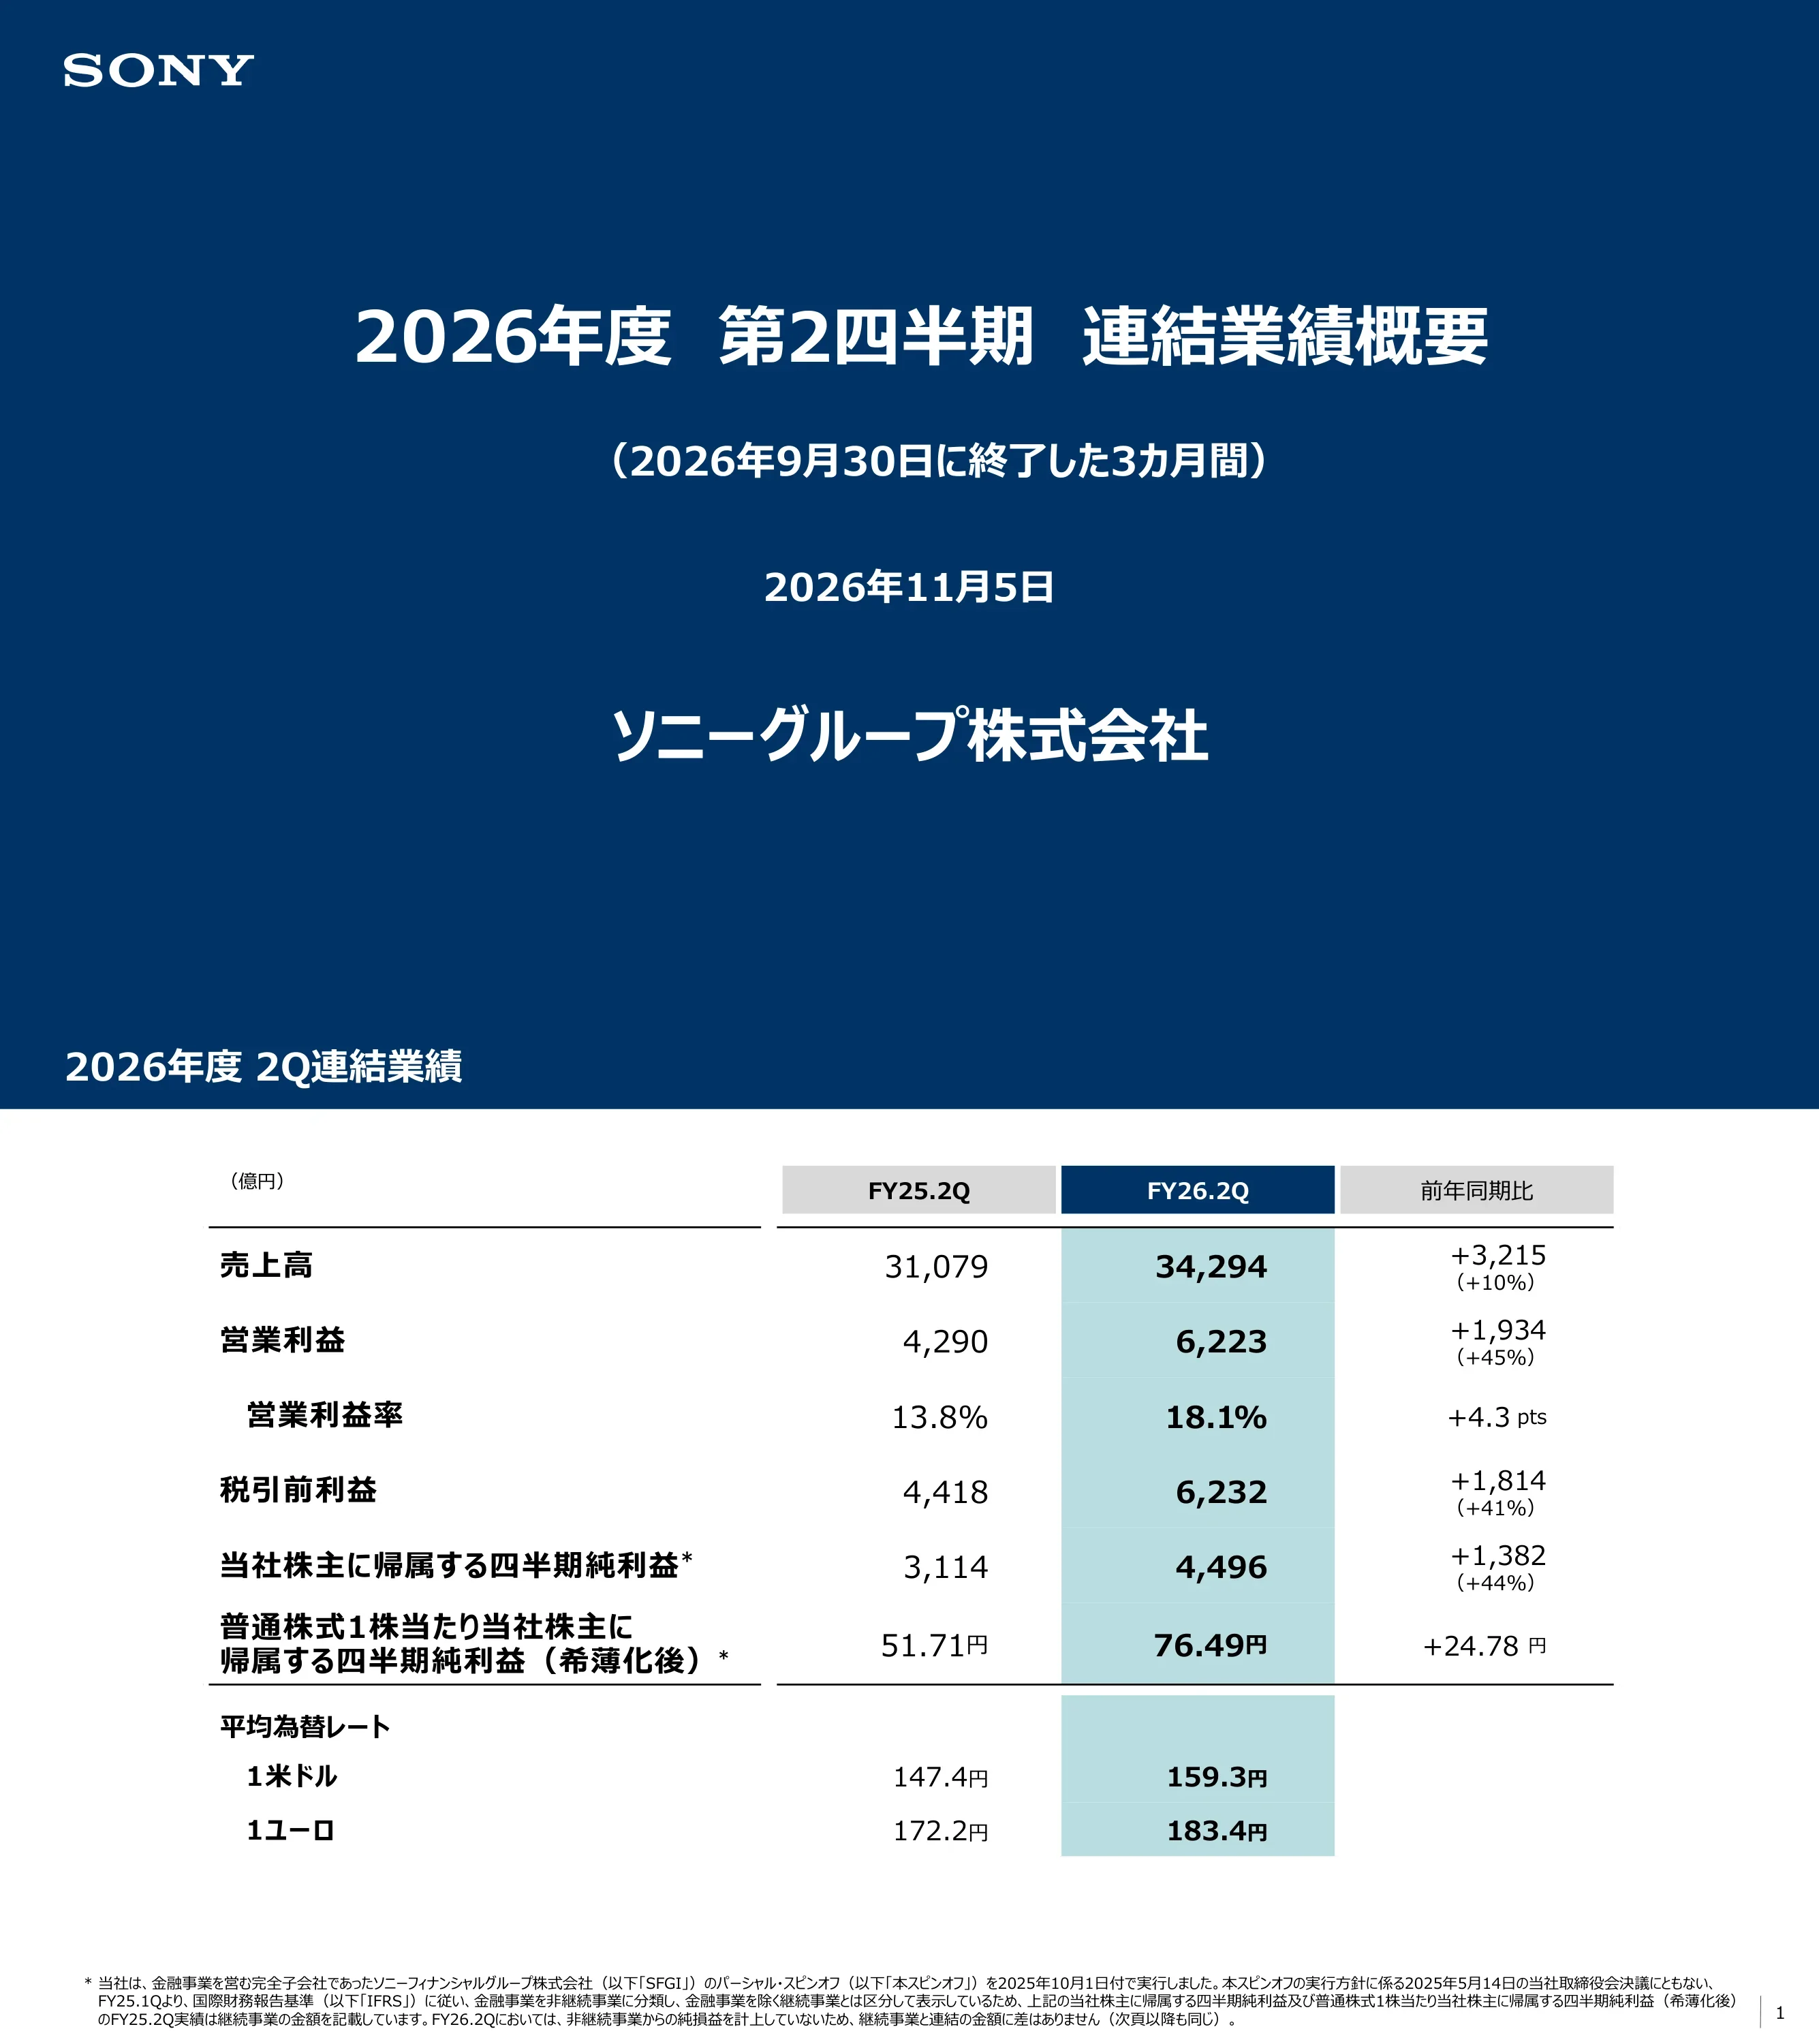
Year-on-year table in ¥100 million: sales ¥34,294 vs ¥31,079 (+¥3,215, +10%); operating income ¥6,223 vs ¥4,290 (+¥1,934, +45%); operating margin 18.1% vs 13.8% (+4.3 pts); income before taxes ¥6,232 (+41%); net income attributable to Sony Group shareholders ¥4,496 vs ¥3,114 (+44%); diluted EPS ¥76.49 vs ¥51.71. Average rates: ¥159.3/US$ and ¥183.4/euro. A footnote explains that FY25 Q2 figures are continuing operations following the October 1, 2025 partial spin-off of Sony Financial Group.
Three-column financial table (FY25.2Q, highlighted FY26.2Q, YoY change) with the current quarter column shaded teal; exchange-rate block beneath and dense footnote.
Explains the drivers: sales +¥3,215 (100 million yen, +10%) on higher Pictures and G&NS sales, about +4% at constant currency; operating income +¥1,934 (+45%) led by G&NS and Pictures; net financial income/expense down ¥120 on foreign-exchange and interest; income taxes improved ¥429 with the effective tax rate falling from 28% to 27% on a higher share of US profit.
Four-row table: line item, teal-shaded variance column, and (+)/(−) bullet explanations of improving and worsening factors.
Segment sales and operating income (¥100 million units, 億円) with FX impact: G&NS sales ¥12,085 (+953), OI ¥2,201 (+997); Music sales ¥5,984 (+560), OI ¥1,228 (+74); Pictures sales ¥5,137 (+1,677), OI ¥926 (+787); ET&S sales ¥5,678 (−79), OI ¥641 (+32); I&SS sales ¥5,776 (−370), OI ¥1,546 (+164); consolidated sales ¥34,294 and OI ¥6,223.
Segment table with color-coded vertical bars per segment (blue, red, orange, navy, green, grey), four numeric columns including FX impact.
Full-year FY2026 forecast (¥100 million units, 億円): November forecast sales ¥130,000 (July: ¥125,000; +5,000, +4%), operating income ¥18,700 (+1,500, +9%), margin 14.4%, income before taxes ¥18,600, net income attributable to shareholders ¥13,300 (+1,200, +10%), operating cash flow ¥16,000. FX assumption about ¥153/US$ and ¥175/euro for Q3–Q4. Planned dividend ¥35 per share for the year (¥17.5 interim and year-end, +¥10).
Wide table comparing FY25 actual, July forecast and highlighted November forecast with variance column; exchange-rate assumptions and a dotted-border dividend box at the bottom right.
Reasons for the upgrade versus the July forecast: sales +¥5,000 (100 million yen, +4%) from G&NS, Music and Pictures; operating income +¥1,500 (+9%) from Pictures and G&NS; income before taxes +¥1,500 and net income +¥1,200 (+10%) following the operating income upgrade.
Four-row variance table with navy header, teal variance column and factor bullets on the right.
Segment forecast (¥100 million units, 億円): G&NS sales ¥48,300 (+2,900 vs July), OI ¥7,000 (+400); Music sales ¥23,000 (+1,100), OI ¥4,450 (+250); Pictures sales ¥17,600 (+1,000), OI ¥2,000 (+500); ET&S unchanged at ¥22,500 sales and ¥1,500 OI; I&SS sales ¥21,200 (+100), OI ¥4,500 (+300); corporate and eliminations OI −¥750.
Same color-coded segment table format as page 4, with FY25, July forecast, highlighted November forecast and change columns.
G&NS Q2 sales up ¥953 hundred million (9%) to ¥12,085 (FX +¥730), helped by network services and first- and third-party software, offset by lower hardware unit sales. Operating income up ¥997 (83%) to ¥2,201, mainly from lapping last year's Bungie intangible-asset impairment (¥315) and a capitalized development cost correction (¥183). Adjusted OIBDA ¥2,449.
Blue segment header with English subtitle; clustered bar chart (sales, operating income, adjusted OIBDA) on the left, bulleted YoY factor analysis on the right.
G&NS full-year sales forecast raised ¥2,900 hundred million (6%) to ¥48,300 on higher third-party software sales; operating income raised ¥400 (6%) to ¥7,000 on third-party software, cost improvements and network services, partly offset by first-party title release date changes. Adjusted OIBDA forecast ¥8,000.
Three-group bar chart (FY25, FY26 July forecast, FY26 November forecast) left; revision bullets right.
Music Q2 sales up ¥560 hundred million (10%) to ¥5,984 (FX +¥343) on live events, merchandise and streaming in recorded music and publishing, partly offset by a lower contribution from last year's Demon Slayer: Infinity Castle film in Visual Media & Platform. Operating income up ¥74 (6%) to ¥1,228; adjusted OIBDA ¥1,546.
Red segment header; clustered bar chart left, factor bullets right.
Music sales forecast raised ¥1,100 hundred million (5%) to ¥23,000 and operating income raised ¥250 (6%) to ¥4,450, driven by live/merchandise and streaming revenue. Adjusted OIBDA forecast ¥5,700.
Three-period bar chart left with revision bullets right, red accent.
Pictures Q2 sales up ¥1,677 hundred million (48%) to ¥5,137 (US$ basis +$880 million, +37%), mainly from theatrical revenue of Spider-Man: Brand New Day. Operating income up ¥787 (568%) to ¥926 (US$ basis +$488 million, +527%); adjusted OIBDA ¥1,059.
Orange segment header; clustered bar chart left, US-dollar-based factor analysis right.
Pictures sales forecast raised ¥1,000 hundred million (6%) to ¥17,600 on current-year theatrical releases led by Spider-Man: Brand New Day; operating income raised ¥500 (33%) to ¥2,000. Adjusted OIBDA forecast ¥2,500.
Three-period bar chart left, revision bullets right, orange accent.
ET&S Q2 sales down ¥79 hundred million (1%) to ¥5,678 (FX +¥266) on lower unit sales across businesses including imaging; operating income up ¥32 (5%) to ¥641 (FX +¥61), helped by US tariff refunds, partly offset by lower imaging and sound sales. Adjusted OIBDA ¥915.
Dark-blue segment header; clustered bar chart left, factor bullets right.
ET&S forecast unchanged from July: sales ¥22,500 hundred million and operating income ¥1,500; adjusted OIBDA ¥2,600.
Three-period bar chart left; two short 'unchanged from July' headlines right, leaving generous white space.
I&SS Q2 sales down ¥370 hundred million (6%) to ¥5,776 (FX +¥409) on lower mobile image sensor sales (lower volumes partly offset by better product mix); operating income up ¥164 (12%) to ¥1,546 (FX +¥259). Adjusted OIBDA ¥2,192.
Green segment header; clustered bar chart left, nested factor bullets right.
I&SS sales forecast roughly flat at ¥21,200 hundred million; operating income raised ¥300 (7%) to ¥4,500 on lower costs and favorable FX, partly offset by the impact of the Kumamoto earthquake. Adjusted OIBDA forecast ¥7,100.
Three-period bar chart left, revision bullets right, green accent.
Defines adjusted OIBDA (operating income plus depreciation and amortization, excluding content amortization, less items Sony deems non-recurring) as a non-IFRS measure; explains constant-currency sales and FX impact calculations; notes that Music (SME, SMP) and Pictures (SPE) results are consolidated in US dollars and translated to yen.
Text-only page with underlined section headings and dense paragraph text under a navy header.
Forward-looking statement disclaimer listing 16 risk factors (product quality, competition, strategy execution, regulation, exchange rates, talent, IP, disasters, cybersecurity, litigation, etc.) and referencing Ukraine–Russia, Middle East and US tariff policy changes plus Sony's securities report and Form 20-F.
Dense legal text with a numbered list (1)–(16) under a navy header.
Συχνές ερωτήσεις σχετικά με αυτή τη διαφάνεια και το βασικό περιεχόμενο παρουσίασης.
The slides are in Japanese. This is Sony Group's 決算説明会資料 (earnings briefing material) titled 2026年度第2四半期連結業績概要, originally released on November 5, 2026 via TDnet, the Tokyo Stock Exchange's Timely Disclosure network. The page-by-page analysis on this page translates slide titles and key figures into English.
Sony's fiscal year runs from April to March, so FY2026 (2026年度) is April 2026 to March 2027. FY2026 Q2 is the three months from July 1 to September 30, 2026, and FY25 figures in the deck refer to April 2025 to March 2026.
Most amounts are in 億円, i.e. units of ¥100 million. For example, Q2 sales of 34,294 億円 equal about ¥3.43 trillion, and the November full-year sales forecast of 130,000 億円 equals ¥13 trillion. Per-share figures (EPS ¥76.49, dividend ¥35) are in yen.
For FY2026 Q2, sales rose 10% to ¥34,294 hundred million and operating income rose 45% to ¥6,223 hundred million, led by Game & Network Services and Pictures (Spider-Man: Brand New Day). Sony raised its full-year forecast to ¥130,000 hundred million in sales and ¥18,700 hundred million in operating income.
Yes. The original PDF is available along with a PPTX conversion, so you can reuse the table layouts, segment color system and bar-chart-plus-bullets pages in PowerPoint or Keynote. Japanese fonts may be substituted if they are not installed.
It works well for any company reporting several segments: a summary table, a variance-factor page, a segment table, a forecast-vs-prior-forecast table, then paired results and outlook pages per segment. Replace the figures and segment names and keep the structure.
Adjusted OIBDA is a non-IFRS measure Sony defines as operating income plus depreciation and amortization (excluding amortization of content assets such as film costs and first-party game content), minus items Sony judges to be non-recurring. The definition appears on the Notes page (page 18).
Official IR site with quarterly earnings releases, supplemental data and English-language materials.

Create Your Own Slides
Turn your ideas into professional presentations in seconds with 2slides AI.
Αναφερθείτε σε επαγγελματικές σχεδιάσεις, επιλέξτε το στυλ σας και δημιουργήστε σλάιντ με τέλεια απόδοση κειμένου. Τροφοδοτείται από το Nano Banana—ξεκινήστε να δημιουργείτε την παρουσίασή σας τώρα.
Ο Πράκτορας AI σας για διαφάνειες. Εξοικονομήστε χρόνο, λάμψτε πιο γρήγορα με έξυπνη δημιουργία παρουσιάσεων.


© 2026 2slides. Όλα τα δικαιώματα διατηρούνται.