
Ανήκει στη συλλογή Παραδείγματα παρουσιάσεων για επενδυτές
Snowflake Q2 FY2026 Investor Presentation - AI Data Cloud Platform Financial Performance and Growth
Γρήγορη Πλοήγηση
Ετικέτες
Κοινοποίηση διαφανειών
Snowflake Q2 FY2026 Investor Presentation - AI Data Cloud Platform Financial Performance and Growth
Λεπτομερής προβολή κάθε σελίδας διαφάνειας, συμπεριλαμβανομένης της διάταξης, βασικού περιεχομένου και οπτικών στοιχείων.
Title slide featuring Snowflake branding with distinctive snowflake logo and blue gradient background with dotted pattern design elements
Full-screen branded cover with large bold typography for title, company logo in upper left, copyright notice at bottom, clean modern design with signature Snowflake blue color scheme
Comprehensive legal disclaimer explaining non-GAAP financial measures used throughout the presentation including definitions of adjusted metrics for product gross profit, operating income, net income, and various margin calculations. Details exclusions such as stock-based compensation, amortization, acquisition expenses, and other adjustments
Dense text layout with section header and detailed paragraph format, small font size for legal compliance, standard disclosure format
Standard forward-looking statements disclaimer covering risks and uncertainties related to business operations, financial projections, product development, market conditions, and other factors that could cause actual results to differ from projections. References SEC filings for additional risk disclosures
Two-column dense text format with header, comprehensive legal language, standard safe harbor structure
Visual representation of Snowflake's three strategic pillars shown over image of robotic arm and automotive manufacturing setting, emphasizing data-driven AI transformation in industrial contexts
Full-screen image background with three large text overlays horizontally arranged, dramatic industrial photography with blue tint overlay
Comprehensive diagram showing Snowflake's platform capabilities across the complete data lifecycle from source to consumption, including Bronze/Silver/Gold data layers (medallion architecture), support for both structured and unstructured data, and various consumption patterns including BI, Data Science, Apps, and Sharing
Left-to-right flow diagram with three main sections (Data Source, Processing, Consumption) connected by arrows, database cylinder icons for data layers, catalog and governance foundation spanning the architecture
Visual representation of Snowflake's four core product categories presented as equal pillars: Data Engineering, Analytics, AI, and Applications & Collaboration, each with distinctive iconography
Four equally-sized blue rounded square tiles arranged horizontally, each with white icon and text, centered on page with consistent spacing
Three-panel image composition illustrating Snowflake's core platform principles through visual metaphors: laptop work (Easy), global network visualization (Connected), and mobile user (Trusted)
Three equal vertical panels spanning full width, each with large white text overlay on photographed imagery with blue tint
Comprehensive display of Snowflake's partner ecosystem featuring logos from major technology companies, consulting firms, and solution providers including AWS, Microsoft, Google Cloud, Salesforce, and numerous consulting and technology partners across multiple rows
Partner logo grid arranged in 5 rows with centered headline, logos varying in size based on prominence, horizontal blue divider line separating top and bottom sections
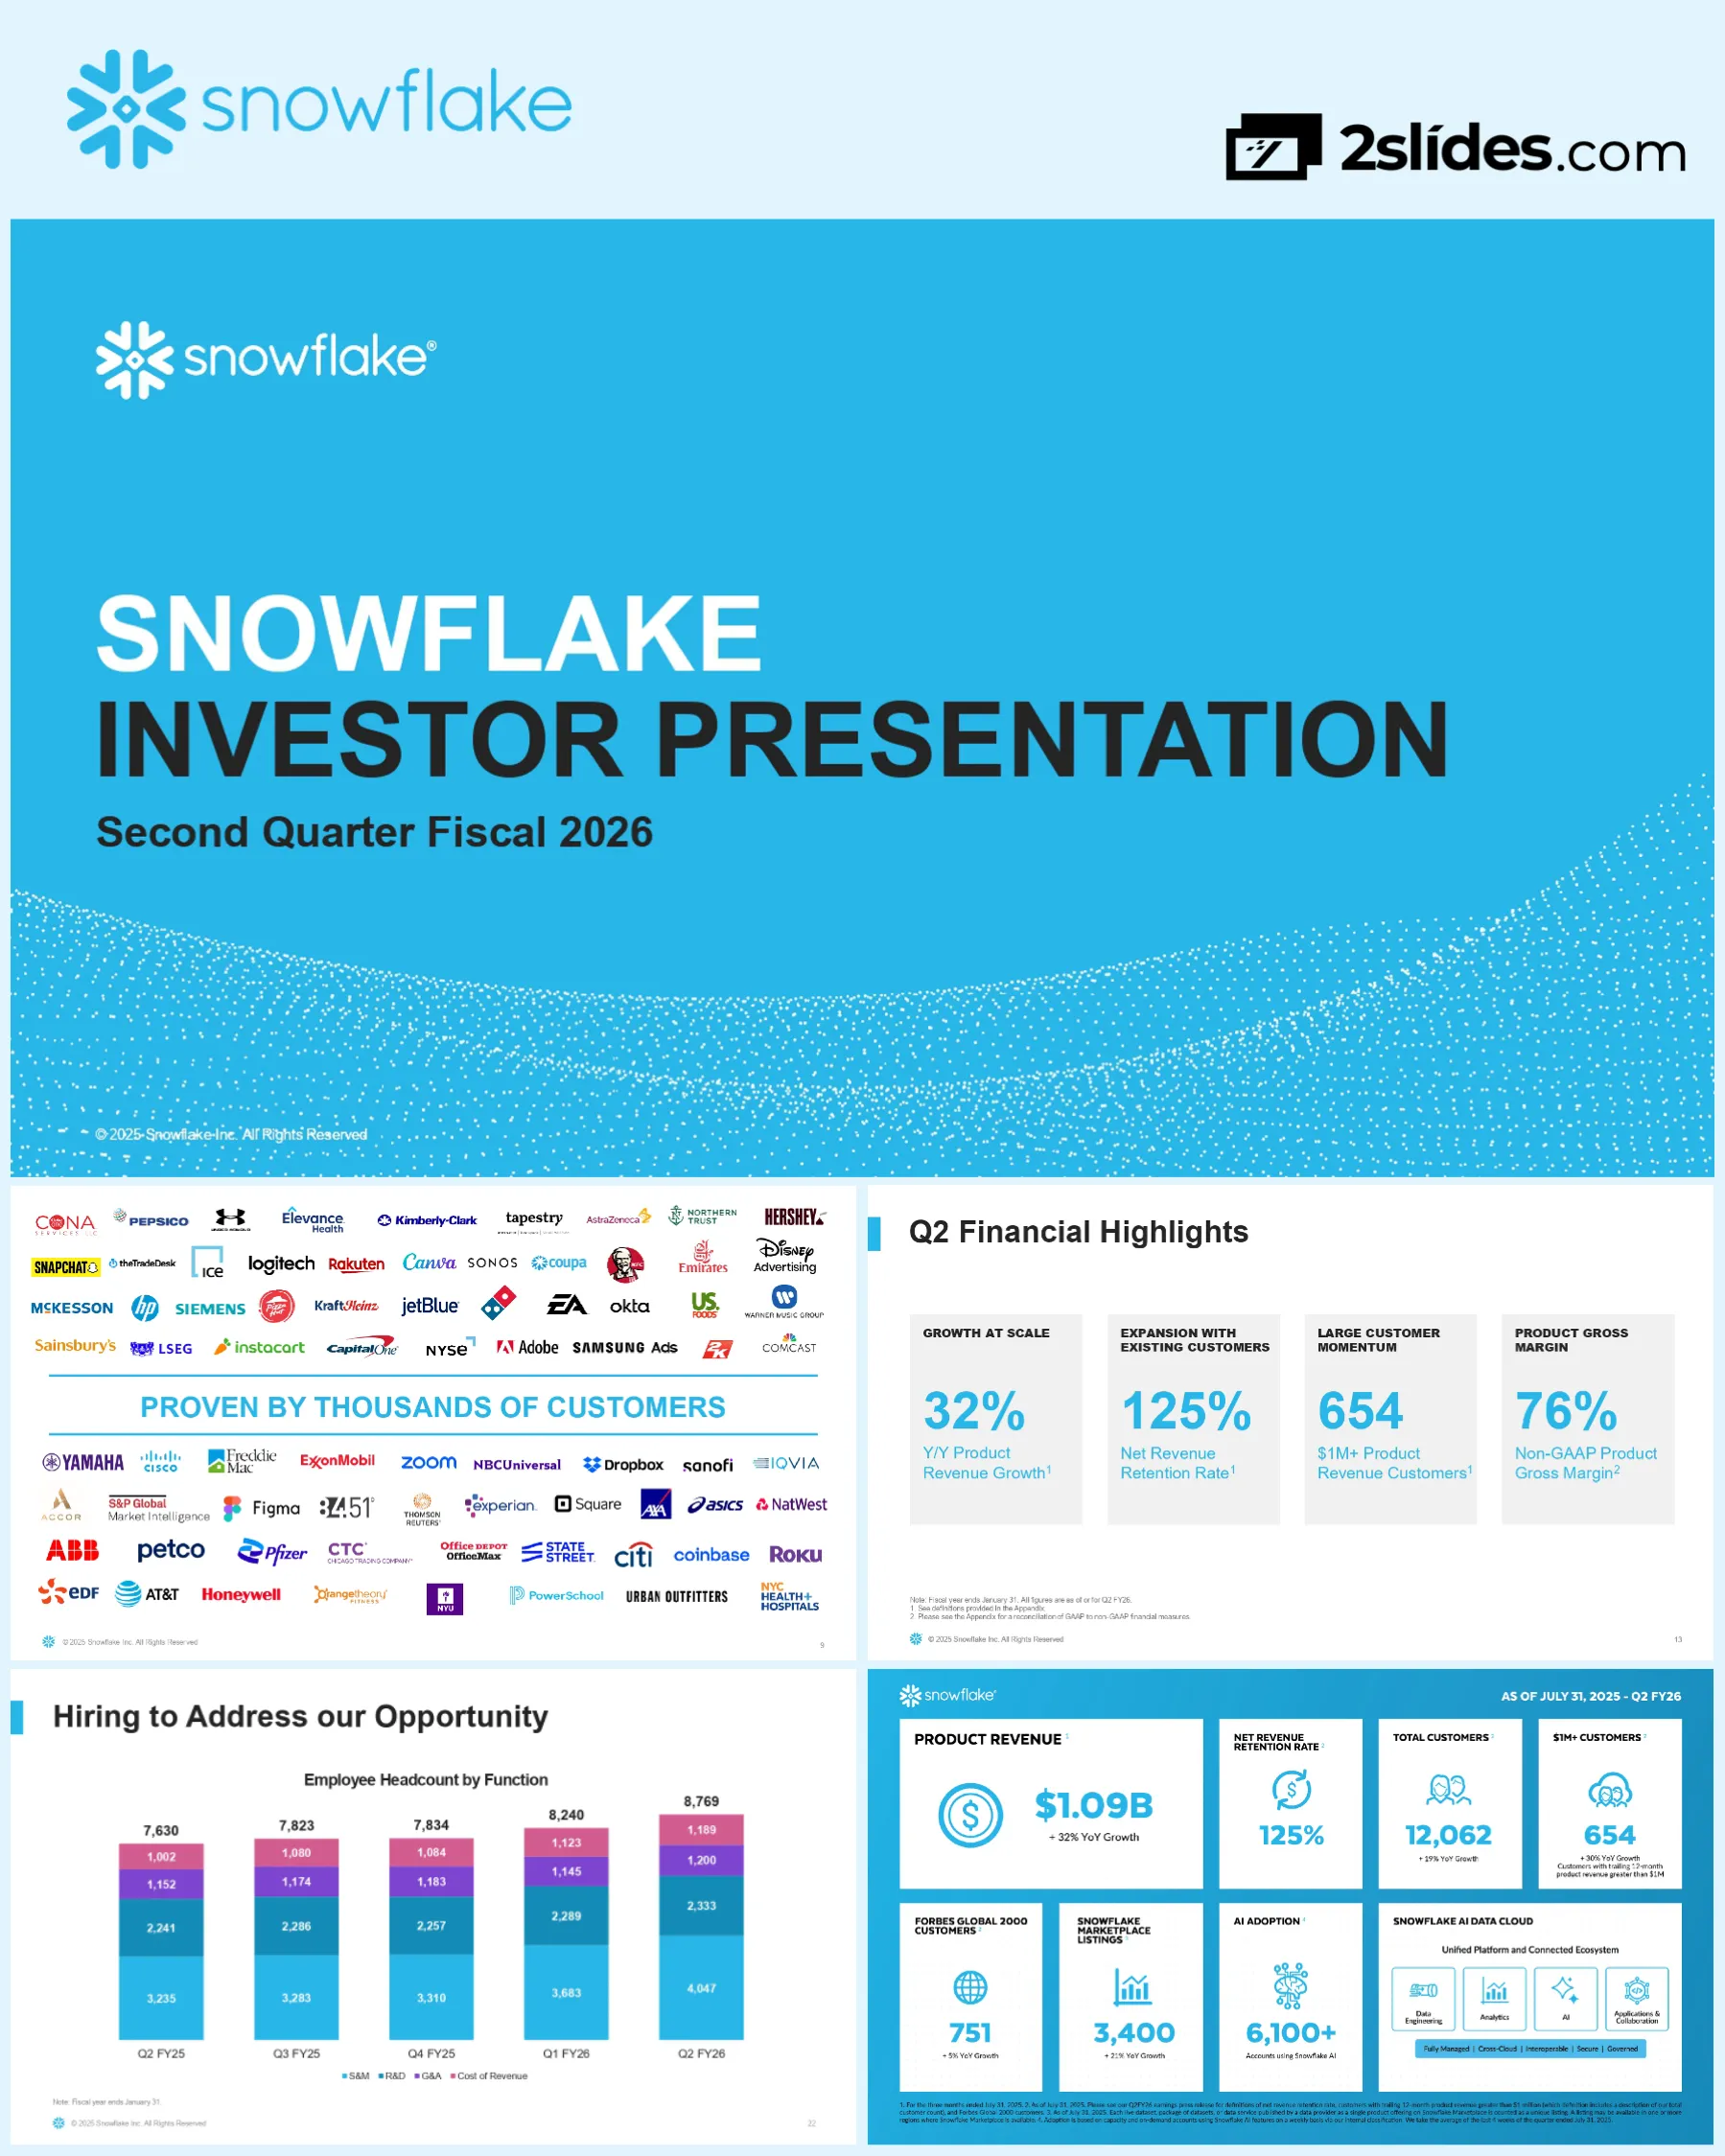
Extensive customer logo showcase featuring prominent global brands across multiple industries including consumer goods, technology, financial services, healthcare, retail, and media. Companies displayed include Disney, Samsung, Capital One, Adobe, Comcast, Coca-Cola, and many others demonstrating broad market adoption
Customer logo wall arranged in 7 rows with centered headline, blue gradient divider line, logos of varying sizes representing different customer types and industries
Dramatic visual comparison showing the exponential growth of Snowflake's AI Data Cloud network from April 2020 to July 2025. The visualization transforms from a sparse ring of dots to a dense, interconnected sphere representing massive expansion in data sharing activity and customer connections
Two-panel before/after comparison with centered date labels, network graph visualizations showing connection density, footnote explaining visualization methodology
Section transition slide with large bold white text on dark blue background with subtle dotted wave pattern, marking the beginning of financial metrics and performance discussion
Full-screen section divider with centered large typography, decorative dotted pattern element at bottom, clean minimal design
Total Addressable Market (TAM) projection showing Snowflake's market opportunity growing from $170B in CY24 to $355B in CY29, representing more than 2x growth over 5 years with consistent annual expansion
Bar chart with 6 columns showing calendar years CY24-CY29, ascending bars in Snowflake blue, large callout showing 2x+ growth multiplier, clean axis labels
Key performance indicators for Q2 FY26 presented in four metric cards showing: 32% YoY Product Revenue Growth, 125% Net Revenue Retention Rate, 654 customers with $1M+ Product Revenue, and 76% Non-GAAP Product Gross Margin
Four equal-sized boxes arranged in 2x2 grid, each containing large metric number, descriptive label, and box title, light gray backgrounds with clean typography
Circular flow diagram explaining Snowflake's consumption-based business model showing the relationship between booking, billing, consumption, and how this drives future revenue. Highlights three key metrics: Product Revenue (leading indicator), RPO (contracted future revenue), and Billings (not necessarily indicative of consumption)
Central circular flow with four numbered steps, three text boxes on right explaining key metrics, arrows showing cyclical relationship between steps
Three-column framework explaining Snowflake's consumption model across Revenue Recognition, Pricing Model, and Billings Terms. Each column presents the approach with pros and considerations, emphasizing consumption-based pricing, variable revenue recognition, and typically upfront billing
Three equal vertical columns with headers, each containing approach description followed by 'Pro' items (with triangles) and 'Consider' items (with play icons), clear hierarchy and structured formatting
Dual chart presentation showing both annual and quarterly product revenue trends. Annual chart shows growth from $1.939B (FY23) to $3.462B (FY25) with 30% YoY growth. Quarterly chart shows progression from $829M (Q2 FY25) to $1.090B (Q2 FY26) with 32% YoY growth, demonstrating consistent growth trajectory
Two bar charts side by side - left showing annual fiscal years, right showing quarterly periods, both with ascending blue bars and growth rate callouts
Remaining Performance Obligations (RPO) chart showing contracted future revenue progression from $5.231B (Q2 FY25) to $6.932B (Q2 FY26). Each bar is split to show percentage expected to be recognized in next 12 months (ranging from 48-50%) versus beyond 12 months
Five-bar chart with stacked segments, each bar showing total RPO value at top, percentage splits shown within bars using two-tone blue coloring, consistent 50% near-term recognition expectation
Dual chart showing customer acquisition and penetration metrics: Total Customers growing from 10,147 to 12,062 (19% YoY growth) and Forbes Global 2000 Customers growing from 714 to 751 (5% YoY growth), demonstrating both volume growth and enterprise market penetration
Two bar charts side by side with ascending blue bars, quarter labels on x-axis, customer count values on bars
Chart showing customers generating over $1M in annual product revenue, growing from 504 (Q2 FY25) to 654 (Q2 FY26), representing 30% YoY growth. Demonstrates increasing customer quality and expansion within existing accounts
Five ascending blue bars with growth rate callout overlay, upward trending arrow, clear progression across quarters
Net Revenue Retention Rate displayed across five quarters, consistently maintaining 124-128% range, with Q2 FY26 showing 125%. This metric demonstrates strong customer expansion and value realization within existing customer base
Five equal-height blue bars showing retention rate percentages, minimal variation demonstrating stability
Three-panel comparison showing year-over-year efficiency metrics for Q2 FY25 vs Q2 FY26: Non-GAAP Product Gross Margin stable at 76%, Non-GAAP Operating Margin improved from 5% to 11%, and Non-GAAP Adjusted Free Cash Flow Margin declined from 8% to 6%
Three side-by-side bar chart comparisons, each showing two bars (Q2 FY25 vs Q2 FY26), consistent blue color scheme
Stacked bar chart showing employee headcount growth by function from 7,630 (Q2 FY25) to 8,769 (Q2 FY26). Breakdown by function: Sales & Marketing (largest), R&D, G&A, and Cost of Revenue, showing strategic investment in growth functions
Five stacked bars with four color-coded segments per bar, legend showing function categories, total headcount labeled above each bar
Five-quarter revenue mix by geography showing consistent regional distribution: Americas 78-79%, EMEA 16%, and APJ 5-6%. Demonstrates strong Americas dominance with stable international presence
Five 100% stacked bars showing percentage distribution across three regions, consistent coloring and segment sizing across quarters
Two key AI adoption metrics presented: 40% of customers have at least one stable edge (data sharing), and 3,400 Marketplace Listings representing 21% YoY growth, demonstrating network effects and ecosystem expansion
Two equal-sized metric boxes side by side, left showing percentage, right showing absolute number with growth rate
Full-year FY26 guidance table showing historical performance (FY23-FY25) and FY26 targets: Product Revenue $4,395M (27% growth), Product Gross Margin 75%, Operating Margin 9%, Adjusted FCF Margin 25%
Table format with 4 historical columns (FY23-FY26 Guidance) and 5 metric rows, alternating gray/white row backgrounds for readability
Section transition slide with large white text 'APPENDIX' on dark blue background with subtle decorative dotted pattern, indicating start of supplemental materials section
Full-screen section divider with centered large typography, minimalist design with brand colors
Comprehensive definitions for key business metrics including: Customers Over $1M Product Revenue, Data Sharing (stable edge definition), Forbes Global 2000 Customers, Marketplace Listing, Net Revenue Retention Rate, Product Revenue, Remaining Performance Obligations (RPO), and Total Customers
Dense text format with metric names in bold followed by detailed definitions, small font size to accommodate extensive content, single column layout
Detailed reconciliation table showing quarterly (Q2 FY25 - Q2 FY26) and annual (FY23-FY25) adjustments from GAAP to Non-GAAP metrics for Product Gross Profit (71-76% margin), Sales & Marketing expense, and Research & Development expense. Shows stock-based compensation, amortization, and restructuring adjustments
Multi-section table with 8 columns (5 quarters + 3 annual periods), separate sections for each metric category, adjustment line items with values and percentages
Reconciliation table for General & Administrative expenses showing adjustments from GAAP (11-20% of revenue) to Non-GAAP (6-9% of revenue) across quarterly and annual periods. Includes adjustments for stock compensation, amortization, acquisition expenses, restructuring charges, and asset impairment ($106M in Q1 FY26 related to San Mateo office exit)
Single-section table format with 8 time period columns, adjustment line items in rows, dollar values and percentage calculations
Comprehensive reconciliation showing total operating expenses and operating income/loss transformation from GAAP to Non-GAAP. GAAP operating loss ranges from -30% to -43% of revenue, while Non-GAAP operating income improves to 5-11% margin. Major adjustments include stock-based compensation ($373-449M quarterly), amortization, and Q1 FY26 office facility impairment
Two-section table with operating expenses (top) and operating income (bottom), 8 time period columns, detailed adjustment rows
Bottom-line reconciliation showing net income and net income attributable to Snowflake Inc. transformation from GAAP net loss (-26% to -41% margin) to Non-GAAP net income (7-11% margin). Includes all adjustments: stock compensation, amortization, restructuring, asset impairment, debt issuance costs, and tax effects
Two-section table format showing Net Income (top) and Net Income Attributable to Snowflake Inc. (bottom), comprehensive adjustment rows, 8 time period columns
Per-share metrics reconciliation showing GAAP net loss per share (basic and diluted) ranging from $(0.89) to $(1.29), compared to Non-GAAP net income per share of $0.18-$0.38 (diluted). Includes weighted-average share count adjustments for dilutive securities, convertible notes, and capped call transactions
Complex table with share count calculations, basic vs diluted comparisons, add-back adjustments for dilutive effects
Cash flow reconciliation showing GAAP operating cash flow (7-44% margin) adjusted for capex and software development costs to arrive at Free Cash Flow (5-42% margin), then further adjusted for payroll tax timing differences to show Adjusted Free Cash Flow (6-43% margin). Q2 FY26 adjusted FCF margin of 6% represents $67.8M
Three-section table: Operating Cash Flow (top), Free Cash Flow (middle), Adjusted Free Cash Flow (bottom), with investing and financing cash flows shown at bottom
Comprehensive visual dashboard presenting all key Q2 FY26 metrics in organized sections: Product Revenue ($1.09B, +32% YoY), Net Revenue Retention (125%), Total Customers (12,062), $1M+ Customers (654), Forbes Global 2000 (751), Marketplace Listings (3,400), AI Adoption (6,100+ accounts), and platform architecture showing four product categories with key attributes (Fully Managed, Cross-Cloud, Interoperable, Secure, Governed)
Multi-section dashboard layout with metric cards, icons, and platform architecture diagram, blue color scheme throughout, organized in grid format
Simple closing slide with large white 'THANK YOU' text on solid blue background, Snowflake logo and copyright notice
Full-screen closing slide with centered large typography, minimal design, brand colors
Συχνές ερωτήσεις σχετικά με αυτή τη διαφάνεια και το βασικό περιεχόμενο παρουσίασης.
Snowflake operates a consumption-based business model where customers pay only for the compute, storage, and data transfer resources they actually use. Unlike traditional subscription software where customers pay fixed amounts regardless of usage, Snowflake recognizes revenue as customers consume the platform. Customers typically book capacity contracts with annual upfront billing, but have flexibility to consume more than contracted amounts or roll over unused capacity. This model aligns pricing with customer value, eliminates shelfware, but creates revenue variability based on consumption patterns.
Snowflake delivered strong Q2 FY26 results with Product Revenue of $1.09 billion (32% YoY growth), demonstrating growth at scale. The company maintained a world-class Net Revenue Retention Rate of 125%, indicating strong expansion within existing customers. Customer quality improved with 654 customers now generating over $1M in annual product revenue (30% YoY growth). Non-GAAP metrics showed 76% Product Gross Margin, 11% Operating Margin, and 6% Adjusted Free Cash Flow Margin, reflecting improving operational efficiency.
Snowflake estimates its Total Addressable Market will grow from $170 billion in Calendar Year 2024 to $355 billion by Calendar Year 2029, representing more than 2x expansion over five years. This growth is driven by increasing enterprise data volumes, AI/ML adoption, cloud migration, and expanding use cases across data engineering, analytics, AI, and applications. For FY2026, Snowflake guides to $4.395 billion in Product Revenue (27% YoY growth) with continued margin expansion to 75% Product Gross Margin and 9% Operating Margin.
Snowflake calculates Net Revenue Retention Rate by comparing product revenue from a cohort of customers over a two-year measurement period. They identify all customers using the platform in the first month of year one, then compare that cohort's revenue in year two versus year one. A 125% rate means the cohort generated 25% more revenue in the second year through expansion, upsells, and increased consumption, net of any churn or contraction. This metric includes adjustments for M&A activity and demonstrates strong value delivery to existing customers.
Remaining Performance Obligations (RPO) represents Snowflake's total contracted future revenue not yet recognized, including both deferred revenue and amounts to be invoiced in future periods. As of Q2 FY26, RPO reached $6.93 billion with approximately 50% expected to be recognized within 12 months. Snowflake emphasizes RPO over billings because their consumption model means billings vary based on customer payment terms and aren't necessarily indicative of future consumption patterns. RPO provides better visibility into contracted commitments, though actual revenue timing depends on when customers consume the platform.
Snowflake's AI Data Cloud creates powerful network effects through data sharing and marketplace capabilities. As of July 2025, 40% of customers have at least one 'stable edge' (active data sharing connection), and the network visualization shows exponential growth from April 2020 to present. The Snowflake Marketplace now features 3,400+ listings (21% YoY growth), and over 6,100 accounts are using Snowflake AI features. This interconnected ecosystem makes the platform more valuable as more participants join, share data, and build applications, creating a virtuous cycle of adoption.
Snowflake serves 12,062 total customers as of Q2 FY26 (19% YoY growth), with strong penetration of enterprise accounts including 751 Forbes Global 2000 companies. Most impressively, 654 customers now generate over $1 million in annual product revenue (30% YoY growth), demonstrating both land-and-expand success and customer quality improvement. The company's focus on strategic organizations, particularly in regulated industries like financial services and healthcare, drives higher-value deployments. Geographic mix remains stable with 78% Americas, 16% EMEA, and 6% APJ, showing international growth opportunity.
Snowflake shows significant differences between GAAP and Non-GAAP results due to substantial stock-based compensation expenses. For Q2 FY26, GAAP operating loss was $340 million (-30% margin) while Non-GAAP operating income was $128 million (+11% margin). The primary adjustments include $436 million in stock-based compensation, $28 million in amortization of acquired intangibles, and prior quarter office facility impairment charges. Management emphasizes Non-GAAP metrics as better indicators of core business performance and operational efficiency, while GAAP results reflect total shareholder dilution and accounting charges. The company is improving profitability on both bases as it scales.

Create Your Own Slides
Turn your ideas into professional presentations in seconds with 2slides AI.
Αναφερθείτε σε επαγγελματικές σχεδιάσεις, επιλέξτε το στυλ σας και δημιουργήστε σλάιντ με τέλεια απόδοση κειμένου. Τροφοδοτείται από το Nano Banana—ξεκινήστε να δημιουργείτε την παρουσίασή σας τώρα.
Ο Πράκτορας AI σας για διαφάνειες. Εξοικονομήστε χρόνο, λάμψτε πιο γρήγορα με έξυπνη δημιουργία παρουσιάσεων.




© 2026 2slides. Όλα τα δικαιώματα διατηρούνται.