
Ανήκει στη συλλογή Παραδείγματα παρουσιάσεων για επενδυτές · Παραδείγματα παρουσιάσεων για επενδυτές από την Ιαπωνία · Παραδείγματα παρουσιάσεων για επενδυτές από εταιρείες ημιαγωγών
Renesas Electronics Q3 FY2026 Earnings Presentation (July–September 2026) — a 19-page Japanese-language quarterly results deck (2026年12月期 第3四半期プレゼンテーション) published on TDnet, the Tokyo Stock Exchange's timely-disclosure system. Renesas uses a calendar fiscal year, so FY2026 (the fiscal year ending December 2026) runs January–December 2026 and Q3 covers July–September 2026. The deck reports Non-GAAP revenue of ¥435.2 billion (4,352 億円, +30.2% YoY, +7.4% QoQ), a 59.4% gross margin and a 34.6% operating margin, explains the exclusion of the Timing business divested on July 1, 2026, covers inventory, fab utilization and capex, guides Q4 revenue to 4,540 億円 (±75) and a full-year forecast of 16,668 億円, and closes with Non-GAAP/GAAP reconciliations, the balance sheet and a 'Renesas at a Glance' summary.
Χρησιμοποιεί το εξώφυλλο αυτής της παρουσίασης ως πρότυπο στυλ για διαφάνειες με το δικό σας περιεχόμενο. Ή επιλέξτε οποιαδήποτε σελίδα παρακάτω για να χρησιμοποιήσετε τη διάταξή της ως αναφορά.
Γρήγορη Πλοήγηση
Ετικέτες
Κοινοποίηση διαφανειών
Renesas Electronics Q3 FY2026 Earnings Presentation (July–September 2026) — a 19-page Japanese-language quarterly results deck (2026年12月期 第3四半期プレゼンテーション) published on TDnet, the Tokyo Stock Exchange's timely-disclosure system. Renesas uses a calendar fiscal year, so FY2026 (the fiscal year ending December 2026) runs January–December 2026 and Q3 covers July–September 2026. The deck reports Non-GAAP revenue of ¥435.2 billion (4,352 億円, +30.2% YoY, +7.4% QoQ), a 59.4% gross margin and a 34.6% operating margin, explains the exclusion of the Timing business divested on July 1, 2026, covers inventory, fab utilization and capex, guides Q4 revenue to 4,540 億円 (±75) and a full-year forecast of 16,668 億円, and closes with Non-GAAP/GAAP reconciliations, the balance sheet and a 'Renesas at a Glance' summary.
Λεπτομερής προβολή κάθε σελίδας διαφάνειας, συμπεριλαμβανομένης της διάταξης, βασικού περιεχομένου και οπτικών στοιχείων.
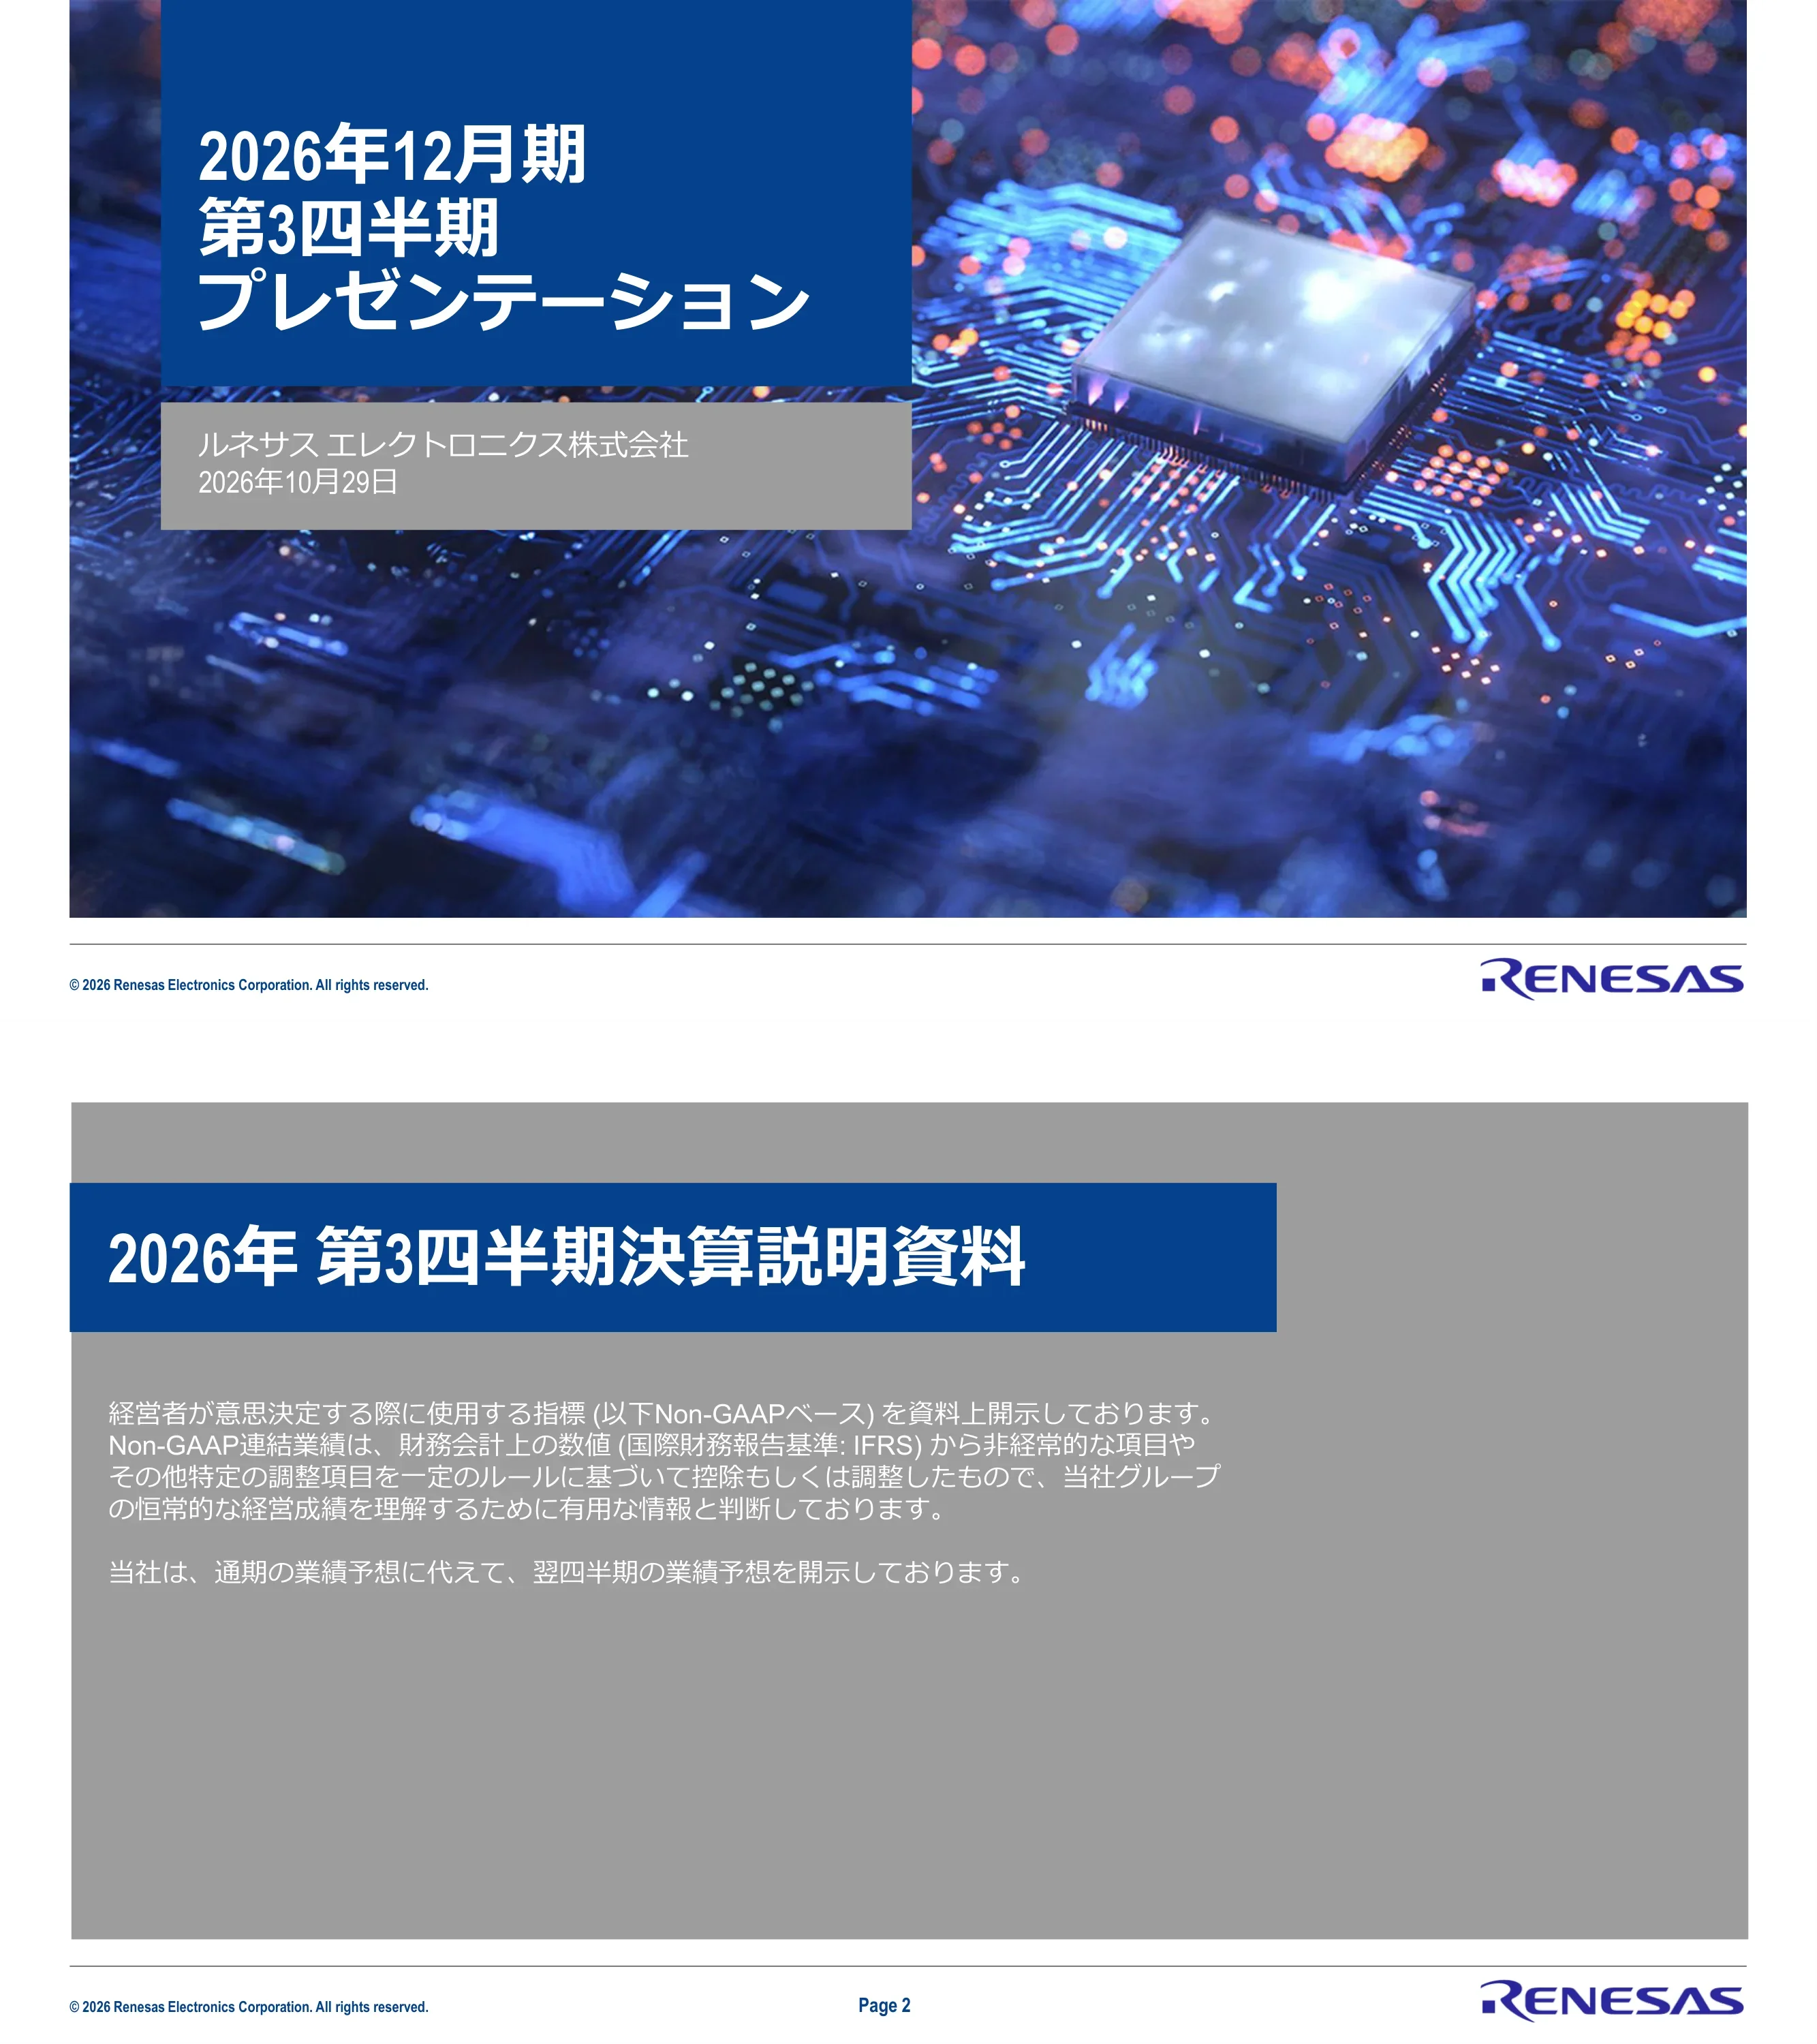
Title slide reading '2026年12月期 第3四半期 プレゼンテーション' (Fiscal Year Ending December 2026, Third Quarter Presentation), presented by Renesas Electronics Corporation (ルネサス エレクトロニクス株式会社) and dated October 29, 2026.
Full-bleed photographic background with a solid navy title block at upper left and a grey sub-panel for company name and date; copyright line and Renesas logo in the footer.
Introduces the deck and explains that management discloses Non-GAAP figures, derived from IFRS figures by removing non-recurring items and certain other adjustments under fixed rules, as useful for understanding the group's ongoing performance; it also notes that Renesas discloses a forecast for the next quarter instead of a full-year forecast.
Grey full-width panel with a navy title bar overlapping the left edge and two short white text paragraphs beneath.
Four accounting notes: Renesas has voluntarily applied IFRS since its FY2018 (December 2018) annual securities report; Non-GAAP figures exclude acquisition-related intangible amortization and other PPA (purchase price allocation) effects, stock-based compensation and one-off gains/losses, and also exclude results of the Timing business from February 2026 until its transfer was completed on July 1, 2026, together with the gain on that transfer; since Q1 FY2019 forecasts are given as a range with gross and operating margins based on the midpoint of the revenue range; segment revenue is reported by actual end application since Q1 FY2024, and from Q2 FY2026 the Timing business was moved from the Automotive and Industrial/Infrastructure/IoT segments to 'Other', with Q1 FY2025 to Q1 FY2026 (January 2026) restated.
Text-only slide with a bold navy heading underlined by a grey rule and four square-bulleted paragraphs, each led by a bold label.
Q3 (July–September) Non-GAAP revenue was 4,352 億円 versus a 4,300 (±75) forecast: +30.2% YoY, +7.4% QoQ and +1.2% versus the July 31 forecast (excluding FX and one-offs: +22.3% YoY, +8.6% QoQ). Gross margin 59.4% (+1.8pts YoY, +1.3pts QoQ, +1.9pts vs forecast); operating profit 1,505 億円 at a 34.6% margin (+473 YoY, +178 QoQ, +2.1pts vs forecast of 32.5%); EBITDA 1,734 億円; profit attributable to owners of the parent 1,250 億円. Nine-month revenue 12,128 億円 (+25.3% YoY), gross margin 58.9%, operating profit 4,087 億円 (33.7%), EBITDA 4,739 億円, net profit 3,412 億円. FX: ¥161/US$ and ¥185/euro in Q3. A Timing-adjusted reference block shows prior-year Q3 revenue of 3,267 億円 and adjusted YoY growth of +33.2%.
Dense financial table with navy column headers grouped by fiscal year (FY2025, FY2026) and a separate bright-blue 'Timing business adjusted' column group on the right; actual Q3 and nine-month columns shaded light blue; footnotes along the bottom.
Scorecard of company totals versus forecast and prior quarter: revenue 4,352 億円 (+1.2% vs forecast, +7.4% QoQ); gross margin 59.4% (+1.9pts vs forecast, driven by a weaker yen, better mix and lower manufacturing costs; +1.3pts QoQ from the weaker yen, mix and higher utilization); operating margin 34.6% (+2.1pts vs forecast on higher gross profit; +1.8pts QoQ, with higher gross profit partly offset by higher operating expenses). By segment, Automotive revenue was 1,895 億円 (QoQ +1.3%) with a 55.3% gross margin and 32.9% operating margin, and Industrial/Infrastructure/IoT revenue was 2,438 億円 (QoQ +12.7%) with a 62.8% gross margin and 36.2% operating margin.
Three-row grid (revenue, gross margin, operating margin) with a shaded company-total column, green plus signs for forecast and QoQ columns with triangle-bullet drivers, and two segment columns on the right with colour-coded headers.
Stacked bars for eight quarters from Q4 2024 to Q3 2026 show total revenue rising from 2,926 to 3,088, 3,246, 3,342, 3,509, 3,723, 4,053 and 4,352 億円. Automotive grew from 1,488 to 1,895 億円 and Industrial/Infrastructure/IoT (split into Industrial, Infrastructure and IoT shades) from 1,408 to 2,438 億円. Side panel: total revenue YoY +30.2% (+22.3% excluding FX and one-offs), QoQ +7.4% (+8.6%); Automotive YoY +19.3% (+13.3%), QoQ +1.3% (+3.2%); Industrial/Infrastructure/IoT YoY +46.4% (+36.5%), QoQ +12.7% (+13.6%). Footnotes note the Timing business reclassification and its exclusion from Non-GAAP revenue from February 2026.
Wide stacked column chart with legend across the top, a dashed vertical divider after 1Q25, and a right-hand text panel with vertical colour rules per segment.
Left: company inventory (accounting basis, including the Timing business) shown as DOI (days of inventory) line and stacked finished goods / work-in-process / raw materials bars from Q4 2024 to Q3 2026; Q3 result was an increase in DOI, as work-in-process rose with die-bank expansion and production growth in line with added capacity and finished goods were built to meet demand, and the Q4 outlook is a further DOI increase to prepare for demand from Q1 onward. Right: sales-channel inventory (management basis) as WOI (weeks of inventory) and long-held versus current inventory bars; Q3 WOI increased — automotive inventory was built but sell-through beat expectations, and Industrial/Infrastructure/IoT WOI was flat on strong sell-through; Q4 outlook is a WOI increase as automotive restocks and Industrial/Infrastructure/IoT continues building.
Two mirrored halves, each with a line chart on top, a stacked bar chart below and a commentary column with '3Q results' and '4Q outlook' headings; dense footnotes with DOI/WOI definitions at the bottom.
Left: front-end fab utilization (wafer-input basis, excluding former Intersil and Transphorm fabs) for total, 6-inch, 8-inch and 12-inch lines, with the total rising from roughly the 30% range in Q4 2024 to around 60% in Q3 2026 (values read from the chart; exact figures not labeled). Right: capex bars of 173, 127, 84, 178, 188, 940, 226 and 1,112 億円 from Q4 2024 to Q3 2026, with a capex-to-revenue line that spikes above 30% in Q1 2026 and Q3 2026. Footnotes explain that capex is on an investment-decision basis at budget FX rates and differs from cash-flow figures.
Two side-by-side chart panels under centred navy subheadings; multi-line chart left, bar-plus-line combo chart with dual axes right; footnotes below.
Q4 (October–December) revenue forecast midpoint is 4,540 億円 (±75), +29.4% YoY and +4.3% QoQ (+24.6% and +4.2% excluding FX and one-offs), with a 58.0% gross margin and a 32.0% operating margin at ¥157/US$ and ¥178/euro. Full-year FY2026 revenue forecast is 16,668 億円 (±75), +26.4% YoY (+19.7% ex FX/one-offs), gross margin 58.6% and operating margin 33.2%, versus FY2025 revenue of 13,185 億円. On a Timing-adjusted basis, FY2025 revenue was 12,875 億円 and the FY2026 forecast is 16,636 億円 (+29.2%). FX sensitivity for Q4: each ¥1 move changes revenue by 22 億円 and operating profit by 11 億円 for the US dollar, and by 2 and 1 億円 for the euro.
Wide forecast table with navy headers and a bright-blue Timing-adjusted block on the right; forecast columns shaded; a small FX-sensitivity table inset beneath; footnotes below.
Section break stating that the appendix contains segment information and figures on a GAAP (IFRS) financial-reporting basis as supplementary information.
Grey full-width panel with a navy 'APPENDIX' title band and one white sentence beneath, matching page 2.
Quarterly table for FY2025 Q1–Q4 and FY2026 Q1–Q3. FY2025 revenue was 13,185 億円 with a 57.6% gross margin and operating profit of 3,869 億円 (29.3%). FY2026 Q3: revenue 4,352, gross margin 59.4%, operating expenses 1,078 (24.8% of revenue) including R&D 616 (14.2%) and SG&A/other 462 (10.6%), operating profit 1,505 (34.6%), EBITDA 1,734 and net profit 1,250 億円. Nine-month totals: revenue 12,128, operating expenses 3,052 (25.2%), R&D 1,742 (14.4%), operating profit 4,087 (33.7%), EBITDA 4,739 and net profit 3,412 億円.
Full-width quarterly table with navy fiscal-year headers, indented sub-rows for R&D and SG&A, and shaded Q3 and nine-month columns.
Segment table by quarter. Q3 FY2026 revenue: Automotive 1,895 億円 (+19.3% YoY), Industrial/Infrastructure/IoT 2,438 億円 (+46.4% YoY), Other 19 億円 (-78.7% YoY after the Timing business exit). Nine-month revenue: Automotive 5,482 (+15.4%), Industrial/Infrastructure/IoT 6,560 (+41.1%), Other 293, adjustments -207. Q3 gross profit was 2,583 億円 (59.4%): Automotive 1,048 (55.3%), Industrial/Infrastructure/IoT 1,532 (62.8%) and Other 3 (14.7%). Nine-month gross profit 7,139 億円 (58.9%).
Two stacked table blocks (revenue, gross profit) sharing a navy header, with indented segment rows and shaded Q3 and nine-month columns; three footnotes on segment reclassification and adjustments.
Q3 FY2026 operating profit of 1,505 億円 (34.6%) split into Automotive 623 (32.9%, -2.4pts YoY), Industrial/Infrastructure/IoT 883 (36.2%, +8.8pts YoY) and Other -0 (-1.2%). Nine-month operating profit 4,087 (33.7%): Automotive 1,883 (34.4%), Industrial/Infrastructure/IoT 2,201 (33.6%), Other 144, adjustments -142. Q3 EBITDA 1,734 億円: Automotive 747, Industrial/Infrastructure/IoT 987; nine-month EBITDA 4,739 億円.
Same quarterly table grid as page 12 with operating profit and EBITDA blocks and indented segment rows.
Quarter-end balance sheet from March 2025 to September 2026. At end-September 2026: total assets 47,023 億円, cash and cash equivalents 6,372, inventories 2,319, goodwill 19,535, intangible assets 5,100, total liabilities 17,973, interest-bearing debt 11,475, total equity 29,050 億円. Gross D/E ratio 0.40 and net D/E 0.18; equity attributable to owners ratio 61.7%; gross leverage 1.9x and net leverage 0.8x EBITDA; average shares outstanding 1,829 million. Footnotes note that Timing-business goodwill and intangibles were reclassified to assets held for sale at end of Q2 FY2026.
Seven-column balance-sheet table with navy date headers, the latest column shaded, ratio rows below the main items and detailed definitional footnotes.
Reconciles gross profit, operating profit, net profit and EBITDA for Q3 FY2025, full-year FY2025 and Q3 FY2026. Q3 FY2026 Non-GAAP operating profit 1,505 億円 reconciles to GAAP 5,653 億円 (129.7% of revenue): recurring items -316 (PPA effects of former Intersil -32, IDT -35, Dialog -82, Altium -60, other -10; stock compensation -97) and non-recurring items +4,464, chiefly the 4,503 億円 gain on transfer of the Timing business. Net profit reconciles from 1,250 to 3,722 億円 including a -449 億円 Wolfspeed-related one-time item; EBITDA from 1,734 to 6,102 億円. FY2025 GAAP net profit was -518 億円 after a -2,376 Wolfspeed-related charge.
Wide reconciliation matrix with three period groups of four metrics each, indented adjustment rows, and Non-GAAP and GAAP totals in bold at top and bottom.
Waterfall chart from Non-GAAP operating profit of 1,505 億円 through small negative steps for former Intersil, IDT, Dialog and Altium PPA effects, other PPA, stock-compensation-related costs and other non-recurring items (labeled as recurring and non-recurring groups), then a large positive step for the gain on the Timing business transfer to reach GAAP operating profit of 5,653 億円.
Horizontal waterfall with a navy starting bar, thin floating step bars, a pale-blue jump bar with a scale-break symbol, and a mid-blue ending bar; arrows beneath group the steps.
IFRS results: Q3 revenue 4,359 億円 (+30.0% YoY, +4.2% QoQ), gross margin 59.0%, operating profit 5,653 億円 (129.7%) including a 4,503 億円 gain on the Timing business transfer, EBITDA 6,102 億円 and profit attributable to owners 3,722 億円. Nine-month revenue 12,347 億円 (+27.3%), operating profit 7,580 (61.4%), EBITDA 8,970 and net profit 5,895 億円 versus a nine-month loss of -691 億円 a year earlier. Footnotes list Wolfspeed-related valuation losses and gains by quarter (e.g. a 2,350 億円 loss in Q2 2025 and a 449 億円 loss in Q3 2026).
Results table matching page 4's format with navy headers, shaded Q3 and nine-month columns and three footnotes.
2025 highlights (Non-GAAP, at ¥150/US$ and ¥167/euro): revenue 13,185 億円, gross margin 57.6%, operating margin 29.3%, EBITDA margin 35.2%, free cash flow margin 25.1% and EPS ¥182.27. Revenue composition: Automotive about 50% (vehicle control 60%, vehicle infotainment 40%) and Industrial/Infrastructure/IoT about 50% (Industrial 30%, Infrastructure 30%, IoT 40%); by product MCU 40%, SoC 15%, analog 20%, power 20%, other 5%. A growth chart tracks revenue and margins from 2020 to 2025, and a '2035 Aspiration — 6x market cap' graphic breaks the goal into 2x scale from executing the mid-term plan and 3x valuation from closing the valuation gap and expanding the multiple.
Four-quadrant dashboard: KPI tile grid top left, segment composition blocks bottom left, bar-and-line growth chart top right, and a 2x/3x matrix diagram with lettered green and navy circles bottom right.
Closing slide with the Renesas.com address and a cautionary statement on forward-looking information, noting that results may differ materially due to economic conditions in Japan, North America, Asia and Europe, demand trends and price pressure, the company's ability to keep supplying accepted products and services, and exchange rates, particularly the US dollar to yen.
Grey full-width panel with a short white rule, the website in bold white, and a block of small white disclaimer text.
Συχνές ερωτήσεις σχετικά με αυτή τη διαφάνεια και το βασικό περιεχόμενο παρουσίασης.
It reports Renesas's results for July–September 2026: Non-GAAP revenue of 4,352 億円 (¥435.2 billion, +30.2% YoY), a 59.4% gross margin and a 34.6% operating margin, plus segment results, inventory, fab utilization, capex, Q4 and full-year guidance, Non-GAAP to GAAP reconciliations and the balance sheet.
Yes. The original is a Japanese-language earnings deck (決算説明会資料, titled 2026年12月期 第3四半期プレゼンテーション) published on TDnet, the Tokyo Stock Exchange's timely-disclosure system. The page-by-page analysis on this page is written in English, with amounts kept in the company's unit of ¥100 million (億円).
Renesas uses a calendar fiscal year. FY2026 is the fiscal year ending December 2026 (2026年12月期), running January–December 2026, so Q3 is July–September 2026.
Renesas guides one quarter ahead rather than for the full year. For Q4 (October–December 2026) it forecasts revenue of 4,540 億円 (±75) with a 58.0% gross margin and 32.0% operating margin, implying full-year FY2026 revenue of 16,668 億円 (±75).
GAAP (IFRS) operating profit of 5,653 億円 includes a 4,503 億円 gain on the transfer of the Timing business, completed July 1, 2026. Non-GAAP figures exclude that gain, the Timing business results from February 2026, PPA amortization and stock compensation, leaving 1,505 億円.
Industrial/Infrastructure/IoT grew faster: Q3 revenue was 2,438 億円, +46.4% YoY, versus Automotive at 1,895 億円, +19.3% YoY. Its operating margin was also higher at 36.2% versus 32.9%.
Yes. The page offers the original PDF and an editable PPTX converted from it, so you can reuse the table layouts, stacked bar charts and waterfall bridge as a starting point for your own earnings presentation.

Create Your Own Slides
Turn your ideas into professional presentations in seconds with 2slides AI.
Αναφερθείτε σε επαγγελματικές σχεδιάσεις, επιλέξτε το στυλ σας και δημιουργήστε σλάιντ με τέλεια απόδοση κειμένου. Τροφοδοτείται από το Nano Banana—ξεκινήστε να δημιουργείτε την παρουσίασή σας τώρα.
Ο Πράκτορας AI σας για διαφάνειες. Εξοικονομήστε χρόνο, λάμψτε πιο γρήγορα με έξυπνη δημιουργία παρουσιάσεων.


© 2026 2slides. Όλα τα δικαιώματα διατηρούνται.