
Ανήκει στη συλλογή Παραδείγματα παρουσιάσεων για επενδυτές
Marvell Investor Day 2026 — Marvell Technology's 161-slide investor day presentation (New York, October 6, 2026) positioning the company as a 'connectivity-first' AI infrastructure supplier and setting a new long-term outlook: FY28 revenue raised to $20B, FY29 custom silicon target raised to $12B+, and an FY31 revenue target of $70–90B with implied non-GAAP EPS above $30.
Γρήγορη Πλοήγηση
Ετικέτες
Κοινοποίηση διαφανειών
Marvell Investor Day 2026 — Marvell Technology's 161-slide investor day presentation (New York, October 6, 2026) positioning the company as a 'connectivity-first' AI infrastructure supplier and setting a new long-term outlook: FY28 revenue raised to $20B, FY29 custom silicon target raised to $12B+, and an FY31 revenue target of $70–90B with implied non-GAAP EPS above $30.
Λεπτομερής προβολή κάθε σελίδας διαφάνειας, συμπεριλαμβανομένης της διάταξης, βασικού περιεχομένου και οπτικών στοιχείων.
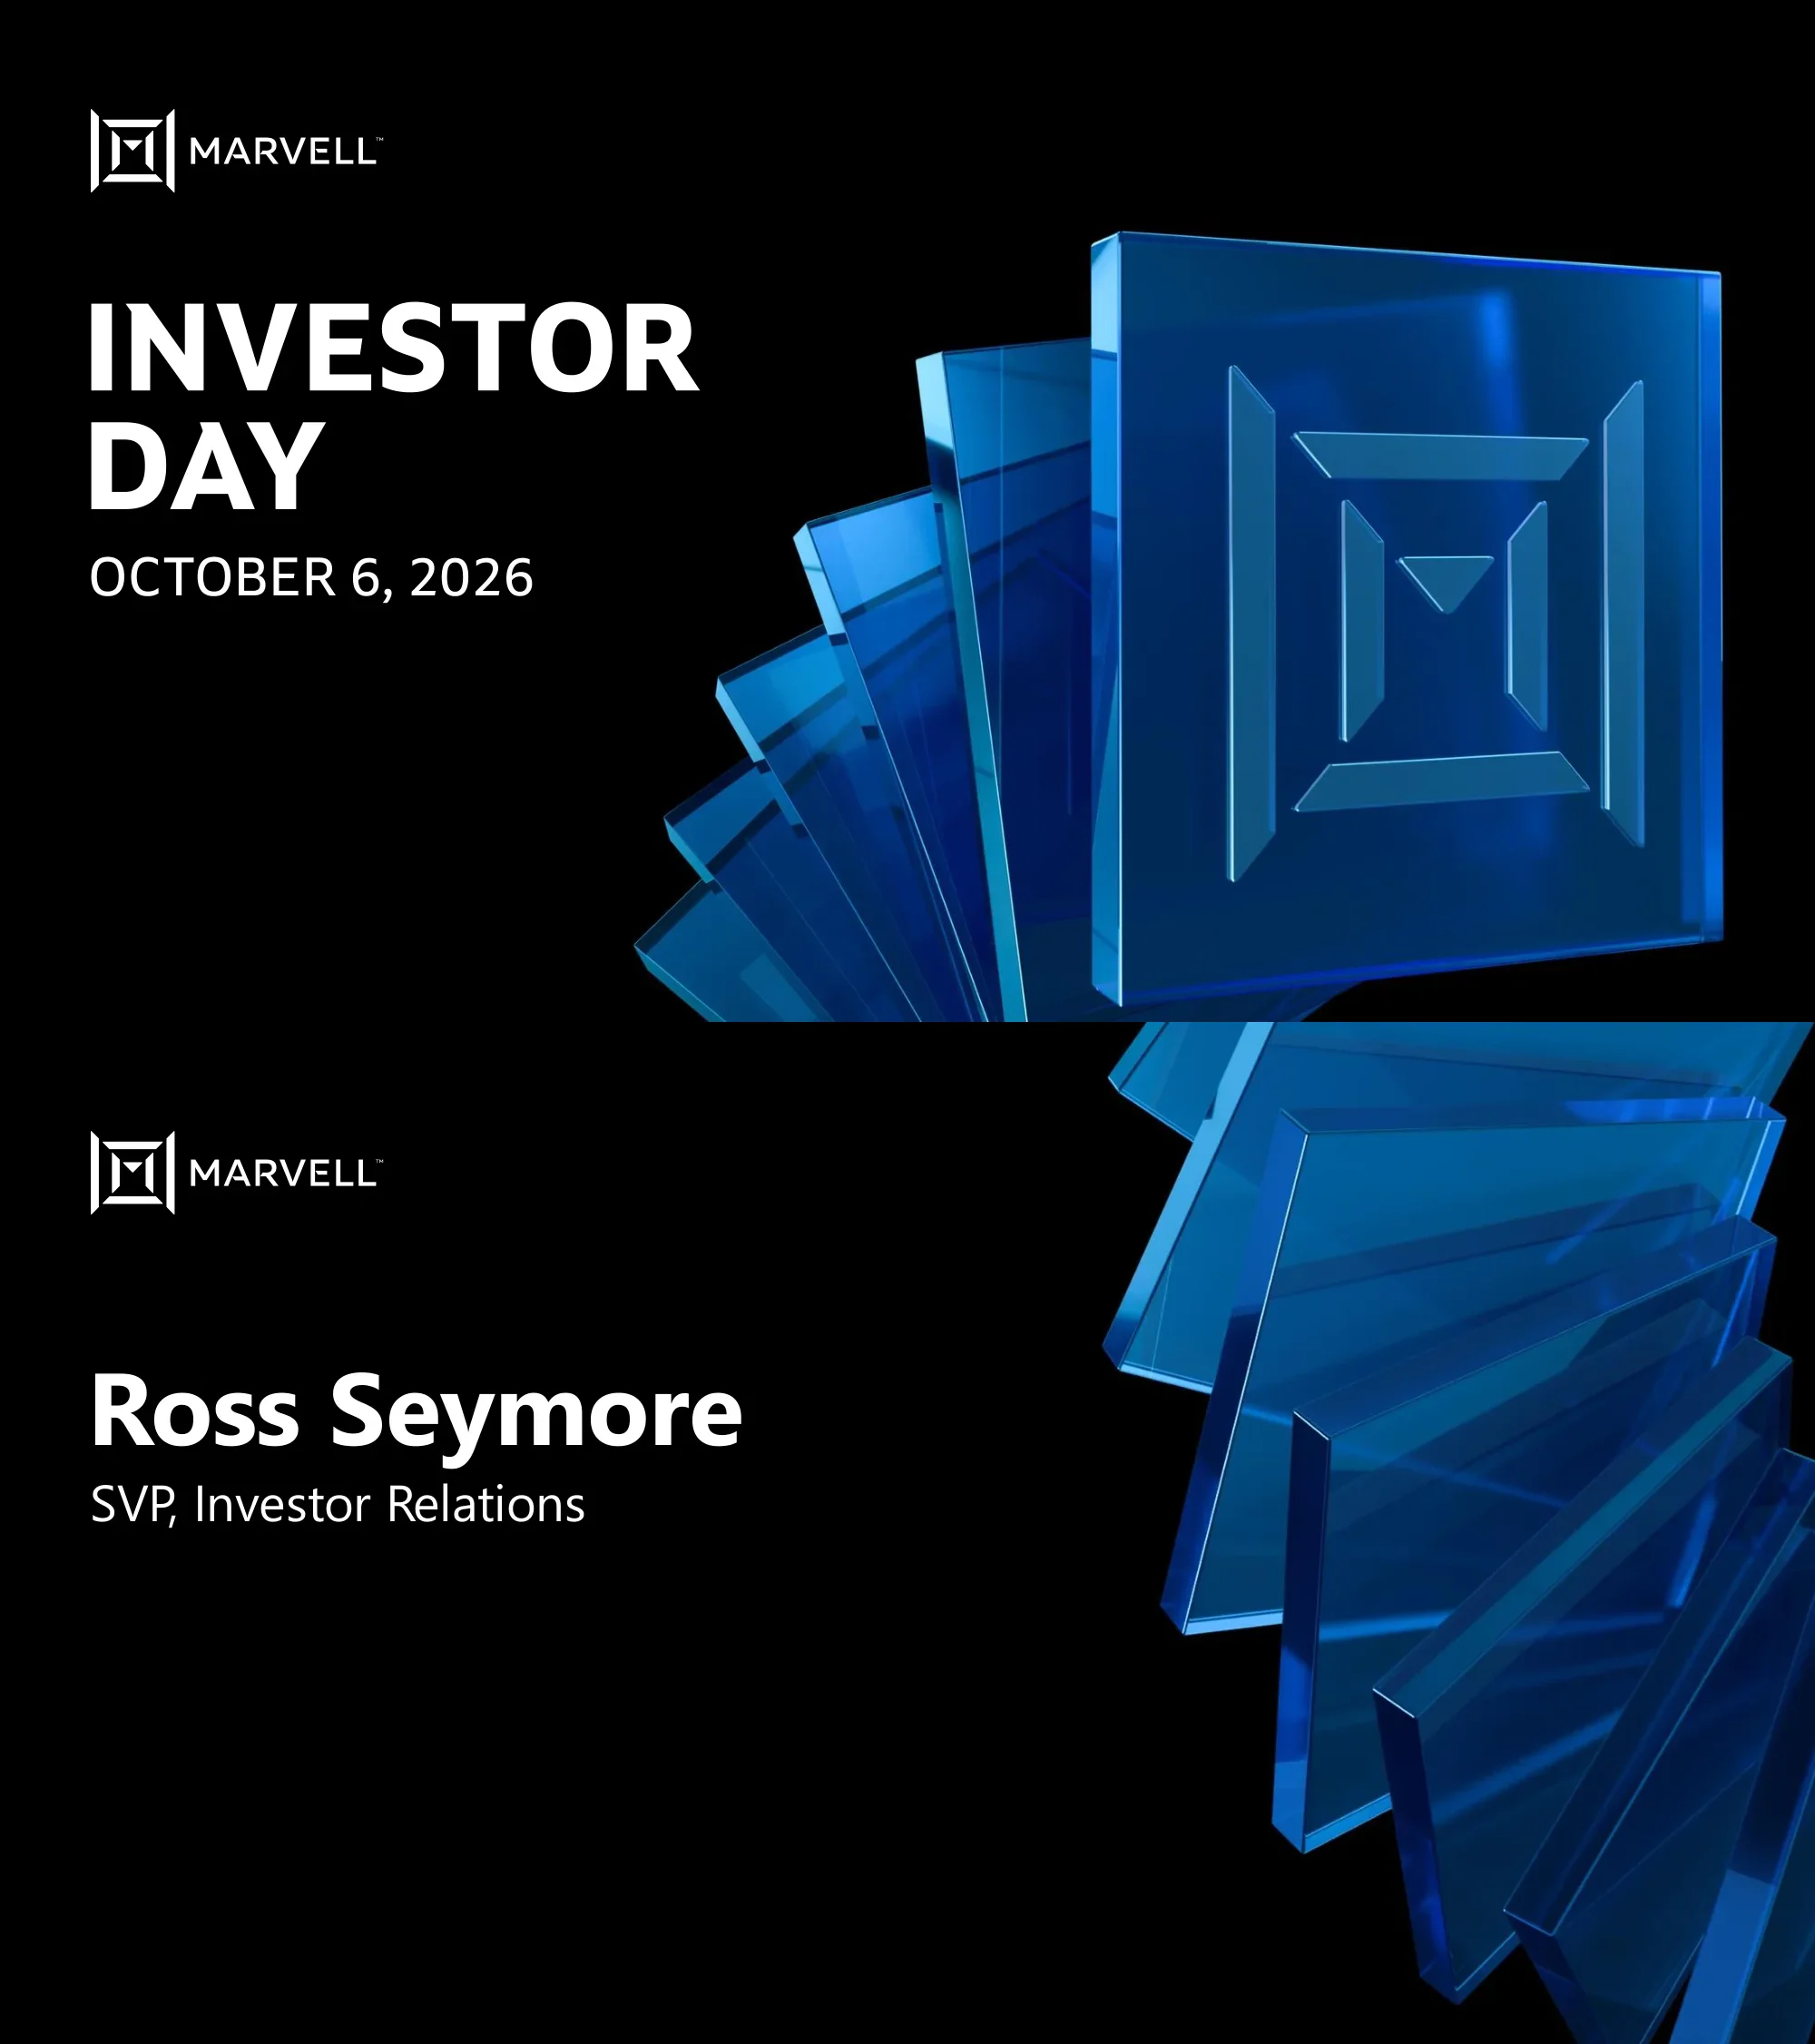
Opening title slide for Marvell Investor Day, dated October 6, 2026.
Left-aligned logo, large stacked title and date on black; 3D glass tiles fanned out on the right
Speaker introduction for Ross Seymore, SVP, Investor Relations, who opens the event.
Name and title left-aligned on black with glass tile cluster on the right
Agenda listing speakers: Matt Murphy (Chairman and CEO), Chris Koopmans (President and COO), Sandeep Bharathi (President, Data Center Group), a break, then Xi Wang, Russ Esmacher, Dave Lazovsky, Will Chu, Dan Durn (EVP and CFO), and Q&A.
Title at left with a curved column of glass tiles; right-side list of circular headshots with names and titles separated by blue rules
Explains that financials follow Marvell's fiscal calendar (FY26 = Feb 2, 2025 to Jan 31, 2026) and that revenue is reported in Data Center and Communications and Other, with Data Center split into Interconnect, Switch and Storage, and Custom.
Title with two bold subheadings and bulleted text on the left; glass tile cascade on the right edge
Standard safe-harbor disclaimer referencing risk factors in the Form 10-Q for the quarter ended August 1, 2026, filed with the SEC on August 28, 2026.
Title and two dense paragraphs on the left; glass tile cascade on the right
Disclosure that certain measures are presented on a U.S. Non-GAAP basis, are not a substitute for GAAP, and are reconciled in the Appendix.
Title with four bullet points on the left; glass tile cascade on the right
Speaker introduction for Matt Murphy, Chairman and CEO, beginning the CEO keynote.
Name and title left-aligned on black with glass tile cluster on the right
Full-bleed photo of a presenter on stage in a chandeliered ballroom in front of a MARVELL backdrop, with a projected slide titled 'Market forces' (data and bandwidth explosion, compute moving to the data, end-to-end security, power efficiency).
Full-bleed photograph with audience in foreground, stage and screen in midground
A framed older slide states the mission: 'We develop and deliver semiconductor solutions that move, store, process and secure the world's data faster and more reliably than anyone else.'
Centered framed screenshot of a prior slide over a dark blue-to-teal gradient
First in a series showing Marvell's industry forecasts over the years; the 2018 Investor Day slide on Artificial Intelligence shows cloud training/inference feeding enterprise, carrier and edge inference.
Title across top; one framed legacy slide at lower left with year label '2018' beneath, on blue gradient
Adds the 2020 slide 'Cloud: DPU market expansion' showing a shift from application-centric to data-centric workloads and a $22B data center compute TAM, with DPU applications such as SmartNIC, security and storage virtualization.
Stacked, overlapping framed slides stepping right; 2018 dimmed behind, 2020 highlighted
Adds the 2021 slide 'The era of cloud-optimized silicon', moving from software on x86 (CPU) to heterogeneous computing (CPU, GPU, FPGA) to cloud-optimized silicon (compute, storage, networking, security, electro-optics).
Stacked overlapping slide thumbnails stepping right; 2021 highlighted, earlier years dimmed
Adds the 2024 slide 'AI clusters with backend and frontend networks', showing AI server racks linked by a frontend network and a backend network in the data center.
Fourth overlapping framed slide, stepping right; 2024 highlighted
Adds the 2025 slide 'Modern XPU and XPU attach' showing XPU chiplet floorplans (HBM, SerDes, D2D, dense SRAM) with the banner 'Customization to achieve the highest performance per watt'.
Fifth overlapping framed slide at right completing the staircase timeline; 2025 highlighted
Marvell combines organic build with strategic M&A and integrates around one strategic direction: about $20B in acquisitions plus about $20B in subsequent investment equals about $40B invested in building and scaling the platform.
Three glass tiles in a row joined by plus and arrow, large tagline below, full-width gradient banner with the investment math
Reasoning models, agentic AI, mixture of experts and inference at scale drive more data movement and more diverse workloads, creating greater connectivity demands; moving data efficiently is becoming a fundamental constraint on AI system performance.
Left stack of four labeled bars flows via arrows into two glass boxes, with a full-width takeaway statement below
Four quotes from AWS (May 2026), Google Cloud (April 2026), Meta (August 2026) and Microsoft (August 2026) stress that the network is a critical path, concluding 'It's all about connectivity'.
Four equal columns with company name, highlighted quote and date, topped by a full-width gradient banner
Compares compute-first and memory-first peers using approximate revenue split bars for Company A, B and C: compute-first companies derive only a small connectivity slice, and memory-first companies are all memory.
Two side-by-side panels, each with three bars and labels
Adds a highlighted third panel for Marvell as 'Connectivity-first', whose revenue split is predominantly connectivity versus a smaller compute share, while the peer panels are greyed out.
Two greyed panels at left, bright blue Marvell panel at right with single stacked bar
FY26 total revenue of $8.2B is split 70% connectivity and 30% compute, shown as a donut across Interconnect, Switch and storage, Custom, and Comms and other.
Large panel with the Marvell revenue-split bar at left, arrow to a labeled donut chart at right
Four connection tiers by reach: scale-across (distributed DCs, up to 1,000km), scale-out (data center, up to 2km), scale-up (rack/multi-rack, up to 50m) and scale-in (package, up to 100mm); fiber optics covers the longer tiers and copper the shorter, with the copper/optics boundary shown between scale-out and scale-up.
Four tiles across a horizontal timeline with an orange divider marker, color bars for fiber and copper below, and a section tab at top right
Same four-tier distance framework; the optics/copper divider shifts to between scale-up (up to 50m) and scale-in (up to 100mm), extending the fiber optics bar across three tiers with copper limited to scale-in.
Same four tiles and timeline as the previous page, with divider moved right and fiber bar widened
Final step of the framework: the divider moves past package-level scale-in (up to 100mm) so fiber optics spans all four tiers, from 100mm to 1,000km.
Same four tiles; fiber optics bar spans the full width and the divider sits at the far right edge
Scale-out switch is proven at hyperscale (connecting AI clusters across pods, high-radix ethernet, multiple generations deployed); scale-up switch is a new opportunity (connecting accelerators within pods, every major protocol, copper to integrated optics).
Two side-by-side panels with bold headings, cyan subheadings and bullets, with a data center photo at left and a rack photo at right
Merchant products (Dense SRAM, DRAM/memory expansion with memory controllers/CXL, Flash with NAND controllers, Hard drives with HDD controllers) combine proven IP and decades of expertise into custom AI infrastructure for hyperscaler-specific designs.
Left table of four product rows, center 'Proven IP + decades of expertise' block, arrow to right panel for custom solutions
The custom opportunity is expanding around the XPU through attach products (NIC, storage, security, memory expansion, near-memory compute, inference accelerator, management co-processor); multiple strategic agreements, custom silicon now shipping to the top four hyperscalers, and XPU attach is semi-custom.
Hub-and-spoke diagram with central XPU chip at left, three key statements stacked at right
The prior FY29 custom target of $10B, representing more than 2x growth in FY29 versus FY28.
Single teal card on the left with glass diamond callout and growth multiple, empty black space at right
The FY29 custom target is raised from $10B (>2x) to $12B+ (>3x FY29 vs. FY28), with the old target dimmed beside the highlighted 'Updated' card.
Two side-by-side cards: dimmed prior target at left, bright blue updated target at right
CY30 data center CAPEX of about $3T (~35% CAGR CY25-CY30) leads to accelerated compute TAM of about $1.6T (~48% CAGR) and Marvell data center TAM of about $385B (~50% CAGR); source is industry estimates.
Three cards left to right linked by arrows, final card larger with a glass diamond
Marvell data center TAM (~$385B, ~50% CAGR) plus Comms and other TAM ($15B, ~3% CAGR) combine into a $400B Marvell total TAM in CY30 with ~45% CAGR CY25-CY30.
Dimmed two-component panel at left, arrow to large highlighted glass diamond at right
Table of CY25-CY30 TAM CAGR and CY30 TAM: Interconnect ~65% / ~$65B, Switching and storage ~40% / ~$85B, Custom ~55% / ~$235B, Comms and other ~3% / ~$15B, total ~45% / ~$400B.
Five rows plus total row with columns for TAM CAGR, growth drivers with arrows, and TAM
Total revenue grows from $8.2B in FY26 to $12B in FY27E (47% YoY) to $20B in FY28E (50% YoY at this stage).
Three-bar column chart with circular YoY bubbles between bars and large value labels
Same chart updated: FY28 growth is now 67% YoY and the $20B figure is called out as the FY28 updated revenue outlook.
Same bar chart at left with a large glass diamond callout at right
At the 2024 AI Era Event, Marvell set a FY29E data center revenue target of $15B versus $2.2B in FY24.
Two-bar chart with a rising gradient wedge, gold ribbon label at top left
At the 2025 Custom AI Day, the FY29E data center revenue target was raised to about $18B versus $2.2B in FY24.
Same two-bar chart in blue with a blue ribbon label
At Investor Day 2026, total revenue of $20B in FY28E (updated outlook) is shown next to the ~$18B data center target previously set for FY29E, with an arrow pulling the target earlier.
Bars for FY24, FY28E and FY29E with a leftward arrow between the last two
Data center revenue is shown growing from $2.2B in FY24 to about $18B in FY28E (updated outlook), a roughly 70% data center CAGR.
Two-bar chart with gradient wedge and a central CAGR bubble
Revenue outlook: FY26 $8.2B (data center $6.1B), FY28E $20B (~$18B data center, ~70% DC CAGR), FY31E $70-90B with data center $67.5-87.5B (55-70% DC CAGR) and $2.5B comms and other.
Three stacked bars (data center plus comms and other) with CAGR bubbles and an axis break on the FY31E bar
Total revenue grows from $8.2B in FY26 to a FY31E target of $70-90B, a 55-60% FY26-FY31 revenue CAGR.
Two-bar chart at left with gradient wedge; two glass diamond callouts stacked at right
By business, FY26-FY31 revenue CAGR: Interconnect 60-70% (~$37.5B), Switching and storage 40-50% (~$10B), Custom 75-85% (~$30B), Comms and other >3% (~$2.5B); total 55-60% yielding $70-90B, against TAM CAGRs of ~65%, ~40%, ~55%, ~3% and ~45%.
Table with TAM CAGR, revenue CAGR, growth drivers and implied midpoint revenue, plus a tall gradient callout for the FY31 target
Summary of investment highlights: $400B CY30 TAM forecast, $20B FY28 updated total revenue outlook, $12B+ FY29 updated custom revenue target, $70-90B FY31 total revenue outlook, and an EPS item left as an ellipsis; 'Trusted by the world's AI infrastructure leaders'.
Row of five check-marked cards across the top, bold tagline in the middle, glass tile arc along the bottom
Speaker introduction for Chris Koopmans, President and COO.
Name and title left-aligned on black with glass tile cluster on the right
Three focus areas for scaling: Customers, Team | Process | Systems, and Supply chain.
Three overlapping diamond-shaped glass tiles in a row with icons and labels
Section highlight on Customers, with the other two pillars (Team | Process | Systems, Supply chain) dimmed.
Same three diamonds with the left one illuminated
2025 Custom AI Day view of total data center CAPEX: $593B in CY25 growing to $1T in CY28 at a 20% CAGR.
Two-bar chart with gradient wedge, CAGR bubble and cyan ribbon label
Investor Day 2026 update: total DC CAPEX is $711B in CY25 (updated) and $1.2T in CY26 (updated), up 73% YoY, pulling the earlier $1T forecast forward.
Two-bar chart with YoY bubble and a left-pointing arrow
Total DC CAPEX grows from $711B in CY25 (updated) to $3.1T in CY30, a 35% CAGR.
Two-bar chart with axis break on the tall bar and a CAGR bubble
Top 10 hyperscalers account for over 60% of the $711B CY25 DC CAPEX and over 70% of the $3.1T CY30 total, growing at a 40% CAGR versus 35% overall.
Stacked two-bar chart with top-10 and all-others segments and two CAGR bubbles
Hyperscalers own the workload, data center and system architecture (data center operations, system development, workload management) while Marvell is the core IP partner (advanced node silicon and packaging, high speed analog mixed signal connectivity IP, optical connectivity system-level design), joined by 'Extreme co-design'.
Two columns (teal for hyperscalers, blue for Marvell) with three rows each, joined by a central glass puzzle tile
The customer spectrum runs from merchant to custom: off-the-shelf system, custom system with standard silicon, semi-custom silicon, and full custom silicon, with a diverse product portfolio at every customer.
Four icon columns in a gradient band above a double-ended Merchant-to-Custom arrow and a bold takeaway
Marvell cites strategic partnerships with AWS, NVIDIA and Google, described as long term, portfolio-wide and multi-generational.
Centered title, three partner logos, divider and tagline over an arc of glass slabs along the bottom
Section highlight on Team | Process | Systems, with Customers and Supply chain dimmed.
Three diamonds with the middle one illuminated
Investing ahead of the data center opportunity: Non-GAAP R&D of $1.5B against data center revenue of $2.2B in FY24, leading to about 4X data center revenue growth (based on annualized FY27 Q2 data center revenue).
Teal feature tile at left with icon and headline, metrics and arrow to a large ~4X callout at right
Talent pipeline investments: research funding across 5 countries and 14 universities, curriculum in analog design, physical design and design for test, 200+ scholarships at 50+ universities, and more than 500 internships annually with the majority converting; 'Marvell has become a premier destination for talent'.
Four columns of glass-tile icons with captions above a bold concluding statement
Introduces the Marvell Design Assistant, a proprietary in-house AI design tool, with two benefits: faster ramp to impact for new engineers (day one to full speed) and faster chip design (concept to production).
Title on top; two glass panels flanking a central blue diamond; full-width takeaway line beneath a divider.
Three-stage timeline of cloud EDA adoption: 2023 first announcement, 2024-2025 optimized end-to-end flow, 2026 broad adoption with ~80% of EDA infrastructure in the cloud.
Three vertical columns separated by thin dividers, each with a year, label, icon and glass platform.
Agenda-style tracker with three themes: Customers, Team | Process | Systems, and Supply chain; the Supply chain diamond is highlighted as the current topic.
Three overlapping glass diamonds in a row with the active one lit and the others dimmed.
Equation graphic: Relationship + Track record + Investment = Results, all feeding a Business Intelligence Platform.
Horizontal parallelogram banner split into four segments joined by plus and equals signs, with a caption below a divider.
Four pillars: building for the long term, deep customer relationships, talent pipeline, and supply chain relationships built on trust, concluding with 'World-class team ready to deliver'.
Centered title, four equal cards in a row, closing statement, and glass tiles across the bottom.
Speaker introduction for Sandeep Bharathi, President, Data Center Group.
Left-aligned logo, name and title on black; 3D glass slabs on the right edge.
The 2020 starting point across three rows: Process (fast follower, 16nm/12nm), Architecture (medium-size chips, ~200mm2) and Design (28G SerDes for Wi-Fi, storage), each pivoting to a goal such as best IP on first shuttle and SerDes building blocks for data centers.
Three horizontal bands, each with an icon, label, arrow, image and target statement; source note at bottom.
Compares 2020 with 2026: first-to-node 5nm to 3nm to 2nm to 14A with 100% A0-to-production, chips above 850mm2 (T100 Switch IC, 10+ products above 600mm2), and 400G SerDes at 2nm with a 480 Gbps demo.
Same three-row layout as the 2020 slide, with 2020 greyed out on the left and 2026 results on the right.
Chart of cost per million output tokens against performance, with an orange curve shifting to a teal one; tokenomics drivers are bandwidth, latency, power and reach/distance, and the conclusion is that AI is no longer only a silicon problem but a data center connectivity challenge.
Chart on the left with axes and a drivers list; two callout boxes with arrows on the right.
Contrasts an ideal world of infinite memory, uniform latency and high bandwidth with the real-world memory wall where XPUs are limited by HBM and DRAM.
Two columns split by a divider: ideal XPU-memory grid on left, XPU/HBM/DRAM diagrams on right, bold takeaway below.
Memory as a shared resource: memory controllers, CXL technologies, photonic interconnects and power-efficient silicon map to memory access, expander, fabric and memory on a chip; goal is rearchitecting systems to bring memory closer over scale-up fabric.
Two-column table list in the center with product renders on the right and a faded brain/chip image on the left.
Copper today limits scale-up to 1 rack and up to 144 XPUs; optical tomorrow spans racks with 1000+ XPUs and no limit; scale-up is >85% of AI data center traffic (internal company estimates).
Left-to-right transition from Copper through The limit to Optical, with data center photos at each end and a bold conclusion.
Shows a 3D integrated silicon photonics light engine and six optical technology options: MZM/TFLN, MRM, EAM, uLED, uVCSEL, and plasmonics/SiPho, each tied to a reach or density use case.
Top banner with cross-section image and labels; row of six icon cards beneath; bold takeaway.
Four shared technology pillars: photonics, advanced node and process, analog mixed signal, advanced packaging, all underpinning connectivity across every reach.
Four equal cards over a teal horizontal band with a double-headed arrow.
Old world is silicon CMOS only; new world is heterogeneous integration of CMOS, SiGe, InP, SiPho, TFLN and plasmonics co-integrated in system and package, shown as a light engine; claims fully integrated, process agnostic, foundry ready.
Left narrow panel for old world; right wide panel with a 3x2 grid of material tiles and a package render.
Three levels of data movement: chip I/O, die-to-die and complex systems, supported by 400G per lane on a leading node, 8x growth in data rate in 6 years, IP plus silicon, and end-to-end electrical and optical I/O.
Three colored panels on top, four outlined stat boxes in a row beneath, closing statement.
Package evolution from 2D with 1 die, 2D with 2 die, 2.5D and 3.5D with more than 8 die, to CPO (co-packaged optics), under the theme of full integration and co-design to scale in volume.
Five exploded package renders in a row with labels and die counts underneath.
Three checked pillars: process and packaging, IP and architecture, and system-level solutions, summarized as proven execution, deployed at scale.
Three cards with check badges, each with imagery; closing statement above glass tiles at bottom.
Closing statement for the section: Marvell is the trusted and undisputed leading solution provider.
Centered title and bold statement on black with glass tiles along the bottom.
Speaker introduction for Xi Wang, SVP and GM, Connectivity Business.
Left-aligned logo, name and title on black; glass slabs on the right edge.
Marvell as a connectivity-first company across four reaches: scale-across up to 1,000km, scale-out up to 2km, scale-up up to 50m, and scale-in up to 100mm, with products such as coherent modules, PAM DSP, ACC/NPO/CPO and optical I/O chiplet.
Four cards with distances, a connected timeline of reach categories, and product lists below each; scale-out highlighted.
Three technology columns: high-speed analog (TIA, Driver; broadband SiGe/GaAs/InP), advanced node DSP (PAM4/6/8, coherent, coherent-lite, EIC, SerDes; first to A0 production), and photonics (MZM, MRM, EAM, SiPho, uLED, uVCSEL, plasmonics).
Three color-coded columns with header bars, icons and tech lists; takeaway line below.
Explains what is inside an optical module (DSP, driver, laser, modulator, TIA, photodiodes) and three points: performance rules, dozens of specialized products every year, and expansion from pluggables to NPO and CPO.
Left: chip renders on glass plate over a block diagram; right: three stacked blue callout bars.
Product leadership (first to every generation, PAM and coherent, NPO, every speed and distance) and technology innovation (multi-foundry, GaAs/SiGe/InP, 30-40 tape-outs per year); headline: 25+ years of leadership.
Two bullet columns flanking a central TIA and Driver chip image on a teal band, with a bold summary line below.
Staircase of DSP generations: 200G (16nm, 4x50G), 400G (7nm, 4x100G), 800G (5nm, 8x100G) and 1.6T (3nm, 8x200G), each with matching TIA and Driver.
Left photo panel with pluggable and chips; right ascending glass steps with labels.
Four practices: solution defined years ahead, unique features for key hyperscalers, collaboration across the optics ecosystem, and production ramp ready from design phase.
Full-width band with left text over a blue gradient and a right data center photo with a diamond handshake icon.
Five 1.6T 3nm DSPs: Ara (foundation), Ara T (power), Ara X (robustness), Ara M (security, coming soon) and Petra (flexibility); all others shipping now.
Five equal cards in a row with chip image, description, optimization focus and status.
A 3.2T DSP solution aims to be scalable for volume deployment, robust for AI links, more power efficient and keep the pluggable form factor.
Left: 3.2T DSP chip on glass platform with arrow; right: four stacked blue bars with icons.
Marvell 3.2T optical DSP solution is being developed in two flavors: 2nm PAM DSP and 2nm Coherent-lite DSP, each with TIA and Driver.
Header banner, two side-by-side glass platforms with chip stacks, bold closing line.
Live demos: 3.2T PAM4 with an 8x400G optical module using PAM 448G SerDes, and 3.2T Coherent-lite with a 2x1.6T module, labeled Path to 3.2T and beyond.
Two demo screenshot panels side by side with a large glass diamond callout on the right.
Bandwidth staircase from 200G, 400G, 800G, 1.6T to 3.2T (2nm Coherent-lite and 2nm PAM) and 6.4T, with the claim that Marvell leads every transition.
Left photo panel with module and chips; right ascending glass steps rising to the top right.
Reprise of the four-reach connectivity portfolio with Scale-in (up to 100mm; uLED, uVCSEL, optical I/O chiplet) highlighted.
Four reach cards with timeline and product lists; Scale-in column highlighted in bright blue.
Compares today's copper I/O (CMOS SerDes, reach ~10mm) with future optical I/O chiplets using uLED and uVCSEL light sources (reach 1.5m+).
Two side-by-side panels with package renders, a transition arrow, and captions.
Section conclusion: most advanced technology, deep customer engagements, and architected to scale for AI volume; leading every hop, distance and generation.
Three check-badge cards in a row, bold statement, glass tiles at bottom.
Speaker introduction for Russ Esmacher, SVP and GM, Data Center Interconnect Business.
Left-aligned logo, name and title on black; glass slabs on the right edge.
Four-reach connectivity framework (scale-across 1,000km, scale-out 2km, scale-up 50m, scale-in 100mm) with Scale-across highlighted, under the line Leadership across the full connectivity stack.
Centered two-line title, four reach cards over a teal band, timeline and highlighted label.
Four drivers: power efficiency (boxes to pluggables), data center densification, line system density (more fiber capacity), and emerging scale-across with 15x bandwidth versus traditional DCI over up to 1,000km.
Four cards in a row, the last enlarged and brightly highlighted, with a bold takeaway.
Move from transport and DCI boxes to Marvell coherent pluggables: COLORZ 100 (2016), COLORZ 400 (2020), COLORZ 800 (2024) and COLORZ 1600 (2026).
Left grey box panel for previous generation; four connected product cards on a timeline with years.
Two AI clusters linked up to 1,000km by Marvell coherent pluggables and DSPs, delivering 15x bandwidth versus DCI and accelerating 1.6T and 3.2T adoption.
Cluster network diagrams at both edges, central large 15x callout on a glass platform, bold caption.
Coherent modules (COLORZ modules for hyperscalers) and coherent DSP (powering partner modules for the broader market).
Two equal panels, one blue and one teal, each with a product image and caption.
Anatomy of a coherent module (DSP, DAC/ADC, driver, TIA, modulator, PDs) and five strengths: largest coherent DSP team, advanced SerDes, highest speed analog, deep photonics, and high-volume manufacturability (>1M units, >15B field hours).
Top: module photo, block diagram and exploded view; bottom: five cards under a banner reading 20+ years of core competencies.
Roadmap of coherent platforms: 100G ZR (28nm SiPho), 400G ZR (7nm SiPho), 800G ZR and ZR+/MACsec (5nm and 2nm SiPho), 1.6T coherent-lite/ZR/ZR+ (2nm TFLN) and 3.2T coherent-lite/ZR/ZR+ (14A, plasmonics).
Ascending staircase of glass tiles grouped by speed, each labeled with product type, node and photonics.
COLORZ 1600 powered by the Electra DSP (industry-first 2nm 1.6T ZR/ZR+ extending links to 1,000km+) and COLORZ 800 powered by the Libra DSP (industry-first 2nm 800G ZR/ZR+ with built-in MACsec encryption).
Two panels side by side each with a pluggable render and DSP chip; bold captions below.
Live demos of 1.6T ZR/ZR+ (more bandwidth, lower power, longer reach) and 800ZR/ZR+ with MACsec (secure AI traffic, lower cost, simpler operations).
Two demo screenshot panels side by side with headline and subtitle above each.
Three claims: market leader supplying top 5 hyperscalers, first to market leveraging core technologies, and delivering at scale with >1M shipped.
Three check-badge cards, bold closing statement, glass tiles at bottom.
Speaker introduction for Dave Lazovsky, EVP and GM, Data Center Networking Business.
Left-aligned logo, name and title on black; glass slabs on the right edge.
Three product areas: cloud optics (pluggable transceivers and coherent DCI), switching (scale-out and scale-up), and integrated optics (NPO and CPO).
Three equal cards with product photos and captions on a blue-teal gradient background.
Switch bandwidth timeline from 12.8T to 400T showing Ethernet Teralynx 7, 10 and T100, with the 100T ESUN-era system (BGA/CPC/NPO/CPO for scale-out and scale-up) shown as silicon die, line card and liquid-cooled chassis.
Rows for Ethernet and ESUN with chip images above a bandwidth arrow axis; central overlay image of the 100T system.
Completed portfolio matrix: Ethernet Teralynx 7 to T400, ESUN E115/E230/E460 and UALink U115/U230/U460 across 12.8T to 400T switch bandwidth; customer deployment at scale with a portfolio extending to 200T, 400T and UAL.
Three protocol rows with chip images placed along a switch-bandwidth arrow axis; summary line at bottom.
Logical layer protocols UALink, NVLink and Ethernet/ESUN are all served by Marvell network solutions, which are protocol agnostic and tailored to each customer.
Three glass diamonds across the top connected by lines to a central box, with a bold statement below.
Four-reach connectivity framework repeated with Scale-up (rack or multi-rack, up to 50m) highlighted, under the line Leadership across the full connectivity stack.
Centered two-line title, four reach cards over a teal band, timeline and highlighted label.
Rising curve of AI stages: foundation models at scale, reasoning and inference-time compute, MoE plus long context, agentic AI and adoption at scale, each adding demands; the technology needs explode across compute, memory, scale-up networking and connectivity reach.
Upward-sloping line with four milestones and bullet lists, summary strip along the bottom.
Flow showing longer context growing the KV cache, the required KV entry missing from fast memory, forcing reload or recompute and eviction, leading to higher latency, more memory traffic and lower system efficiency.
Five-step left-to-right flow separated by arrows, each with its own heading and illustration.
Memory architectures scale with inference demand from XPU/server (direct-attach SRAM/HBM, fastest but capacity constrained), to rack (memory-semantic network, more capacity), to pod/multi-rack (larger scale-up domains); this requires a high-bandwidth, low-latency scale-up network.
Three equal cards with imagery and tiered captions, a subtitle above and a bold conclusion below.
Argues that inference-time compute and reasoning models need more memory, so the network must extend beyond the XPU package, server and rack as copper hits its reach limit and optics takes over. Optics brings higher bandwidth, lower latency, longer reach and lower power; multi-rack scale-up needs advanced optics and high-radix, single-hop switching.
Left server-rack photo and right data-center row photo joined by a glowing fiber-bundle graphic, with three teal benefit tiles on the right and a bold takeaway line at the bottom.
XPU 1 reaches memory in XPU 2 through the scale-up network, which needs at least 16 Tbps per XPU (roughly 10 x 1.6T links). Requirements are 10x bandwidth density, low latency, low power and multi-rack reach, so traditional pluggables give way to NPO and CPO.
Top diagram of two XPU+HBM chips linked by a central bandwidth callout; middle row of four requirement columns; bottom blue panel with three-way Pluggable / NPO / CPO comparison.
Portfolio table of Marvell optics for scale-up: 200G NPO with SiGe drivers/TIAs (1.6T-6.4T, now), 200G Light Engine (6.4T, now), 400G Light Engine (25.6T, 2027), MRM/OCI MSA (12.8T, 2027) and Photonic Fabric (16T-32T, 900G per fiber, 2027). Grouped into module providers, "Fast Pipe" and "Flat Pipe" light engines.
Five-column product matrix with product renders on top and Bandwidth, BW/fiber and Timing rows beneath, plus a gradient banner footer.
Full-bleed render of a Marvell 200G/400G light engine module with a bundle of blue optical fibers ending in yellow-keyed connectors.
Full-bleed blue gradient product hero with the title top-left and the module placed diagonally across the slide.
Exploded diagram of the light engine labeling Housing, FAU, Light Engine, optional DSP, CPx Connectors and Optical Connectors (Data and ELS).
Full-bleed blue background with stacked exploded components on the left and fiber leads sweeping to labeled optical connectors on the right.
Zoomed exploded view naming the internals: Photonic IC (PIC) with MZM, SiGe Drivers, SiGe TIAs, Controller and FAU beneath a Marvell-branded lid.
Full-bleed close-up render of stacked chip layers with callout labels placed around the left and right edges.
Hero render of the Photonic Fabric / OCI MSA light engine module with fiber ribbon and connectors, introducing the second light-engine family.
Full-bleed blue gradient hero with a short title top-left and the assembled module running diagonally to the upper right.
Exploded assembly of the Photonic Fabric / OCI MSA module with labels for Light Engine, FAU, Housing, CPx Connectors and Optical Connectors (Data and ELS).
Full-bleed blue background; exploded stack at center-left, fiber cables fanning to connectors at upper right, labels around the parts.
Zoomed exploded view labeling the controller, the EIC/ASIC (analog SerDes, TIA, driver integrated), the MRM or EAM modulator and the Photonic IC (PIC).
Full-bleed blue close-up of a four-layer chip stack with large callout labels on the left and right.
Near-package optics (NPO) as the copper-to-optics physical layer: lower failure blast radius, field-replaceable optics, and flexible, configurable design. Message: different priorities, different architectures, one goal of optimizing the system for each customer.
Left large rendering of an XPU package ringed by optical modules; middle stack of three colored benefit bars with icons; right-hand statement text.
Co-packaged optics (CPO) benefits: lowest power and latency, greater integration with reduced system complexity, and optimization for maximum integration at scale. Same closing message as the NPO slide: one goal, optimize the system for each customer.
Mirrors the NPO slide: left photo of a server board with glowing fiber loops, three benefit bars in the middle, statement on the right.
End-to-end diagram from XPU compute-side I/O chiplet through physical layer and protocol, the scale-up switch with I/O chiplets, and back to a second XPU. Three pillars: design for link performance, architect for rapid bring-up, operate with confidence, ending with faster time to market and lower risk.
Horizontal block diagram in a white-outlined frame with bidirectional arrows, three cyan-headed captions below and a bold takeaway line.
Marvell Photonic Fabric Memory Module and Photonic Fabric Memory Appliance deliver high-bandwidth, low-latency access to shared memory across the scale-up domain.
Module render at upper left, a zoomed photo inset at center connected by a teal wedge to an appliance chassis at lower right, with a blue banner statement bottom-left.
Summary of three opportunities: scale-out switching growing to more than $1B in FY28 on a multi-billion annual trajectory; scale-up switching with strong customer traction and additional multi-billion annually; scale-up optics with significant Marvell content and a revenue opportunity substantially greater than scale-up switching.
Three check-badged columns across the top, divider line, large centered tagline, and a fan of glass tiles along the bottom.
Speaker introduction for Will Chu, EVP and GM of the Custom Cloud Solutions Business, opening the custom silicon section.
Left-aligned name and title under the Marvell logo on a black field, with stacked blue glass panes on the right.
Custom Cloud Solutions built on Marvell core IP (a grid of 15 IP icons) feeds two product categories: XPU and XPU attach.
Left glass card holding the Marvell logo and icon grid, with an arrow pointing to two stacked diamond-shaped glass tiles labeled XPU and XPU attach.
XPU generations grow from 1-2 die and 4-6 HBM (N), to 4-8 die, 12 HBM and 2-4 copper I/O (N+1), to 8+ die, 12+ HBM and 4+ optical I/O (N+2). Marvell critical technologies include SerDes, die-to-die, advanced packaging, custom SRAM, custom HBM, PIVR, 3D DRAM, NPO, CPO and NVLink Fusion.
Three-column generation timeline with stacked-chip renders, a cyan technology banner row beneath, and a bold takeaway line.
Traditional data centers use standard/merchant products around a CPU (NIC, memory, security, management). AI data centers use custom/semi-custom products around an XPU: NIC, storage, memory expansion, security, near-memory compute, inference accelerator and management co-processor.
Side-by-side before/after panels with an arrow between them: hub-and-spoke block diagrams, with a bold statement beneath.
Three columns: traditional data centers use foundational NICs and SmartNICs with I/O speeds under 100G (Marvell OCTEON SmartNICs); AI needs specific I/O speed and bandwidth, optimized data paths, custom protocols and optimized CPUs; Marvell answers with a Custom NIC.
Three equal columns (Traditional, AI challenges, Marvell) with bullet lists and a product photo each, highlighted blue Marvell column, and a bold takeaway line.
Traditional data centers were CPU-bound with direct-attach memory and an early CXL effort; AI brings inference and KV cache workloads that are memory-bound and latency-sensitive amid a memory shortage. Marvell offers Structera X and Structera A plus Custom Memory Expander.
Same three-column template: Traditional, AI challenges, Marvell, with chip shots and an add-in card in the highlighted column.
Traditional storage used merchant SSD controllers and accelerators; AI needs multi-generation firmware/software control, multi-vendor NAND flexibility and storage offload performance. Marvell offers flash-agnostic controllers and AI-optimized storage accelerators such as Bravera SC6 and a Storage Accelerator.
Three-column comparison template with an SSD board photo at left and two chip renders in the highlighted Marvell column.
Traditional BMCs manage ~150 sensors and 100s of KB/day with minimal performance; AI servers have more than 1500 sensors, 100s of MB/day and ~1000X more performance needs. Marvell responds with a Semi-Custom Processor for AI infrastructure management.
Three-column template with a 1U server render, a rack-row render and the Marvell Semi-Custom Processor chip in the highlighted column.
Inference architectures are evolving and XPUs need offloading via specialized co-processors attached to them. Marvell contributes SerDes, die-to-die, custom SRAM and advanced packaging, and is positioned to win in this new XPU attach market.
Two-panel layout: left bullets under Next-gen AI challenges, right highlighted panel with an exploded chip stack and four IP labels.
Marvell custom opportunity is framed as a product of five multipliers: more customers, more XPUs, more attach categories, higher attach rate and higher ASPs, summarized as building a balanced portfolio.
Horizontal equation of five blue tiles with multiplication signs leading to a green result tile, tagline below, glass-tile fan at the bottom.
Adding XPU attach to the growing XPU business brings greater diversity; custom revenue forecast updated to $12B+ in FY29 and $30B+ in FY31 at the midpoint target, based on design win diversity.
Three check-badged cards over a divider, a bold closing statement and the glass-tile fan along the bottom.
Speaker introduction for Dan Durn, EVP and CFO, opening the financial section.
Left-aligned name and title under the Marvell logo on black, with stacked blue glass panes at right.
Revenue grew at a 23% CAGR versus the 15-20% target set in FY21; operating income expanded at a 32% CAGR; capital allocation was >$8B organic investment, ~$11B M&A and $4B returned to shareholders. Headline: exceeded targets while adding capabilities.
Three tall glass cards (two blue, one green) with icons, large stat figures and captions, a takeaway line and a footnote.
Recap of the day: ~$400B TAM growing ~45% CAGR CY25-CY30, technology leadership in DSP and optical, analog mixed signal and silicon and packaging, and a $70-90B revenue opportunity at 55-60% CAGR FY26-FY31.
Three-column panel on a teal gradient band: Market opportunity, Technology leadership, Revenue opportunity, with a closing tagline.
Outlook for revenue (55-60% five-year CAGR FY26-FY31, growing faster than the market), earnings (faster than revenue via operating leverage at scale) and cash flow (strong and rising, funding growth and shareholder returns).
Three glass tiles with icons labeled Revenue, Earnings, Cash flow, explanatory captions below and a bold takeaway line.
Total revenue grows from $8.2B in FY26 to $70-90B in FY31 (55-60% CAGR); data center grows at ~65% CAGR while comms and other grows at more than 3%.
Left two-bar stacked chart (FY26 vs FY31) with a CAGR circle and legend; right gradient panel with two big stats.
Three data center engines: Interconnect (~65% FY26-FY31 revenue CAGR at midpoint, ~$65B TAM in FY31), Switching and storage (~45%, ~$85B TAM) and Custom (~80%, ~$235B TAM).
Three equal gradient cards with icons, large CAGR numbers and TAM figures, with a bold tagline and footnote.
Gross margin is influenced by product mix with growth in custom; operating margin increases with scale as OpEx rises at about half the percentage rate of revenue growth. Earnings compound faster than revenue.
Two wide cards side by side on a blue-teal gradient with icons, plus a closing statement.
Three priorities: organic growth (talent, IP and supply to fund the roadmap), strategic M&A (proven track record of acquiring technology and teams) and returning capital (>50% of free cash flow on average over time), all while maintaining a strong balance sheet.
Three columns with colored headings, icons above glass diamond platforms, vertical dividers and a closing line.
FY31 target model: revenue $70-90B, gross margin 56-59%, operating margin 44-46%, tax rate 15%, free cash flow >36%, with implied EPS above $30.
Left five-row metric table with gradient header, right large glass diamond tile showing >$30 with caption FY31 implied EPS.
Five proof points: $400B CY30 TAM forecast, $20B FY28 updated total revenue target, $12B+ FY29 updated custom revenue target, $70-90B FY31 total revenue target and >$30 FY31 implied Non-GAAP EPS. Tagline: trusted by the world's AI infrastructure leaders.
Row of five check-badged cards with big figures, a divider, bold tagline and glass-tile fan at the bottom.
Closing slide repeating the Marvell INVESTOR DAY, OCTOBER 6, 2026 title branding.
Left-aligned logo, large title and date on black, with a fan of blue glass panes carrying the embossed Marvell emblem at right.
Section divider introducing the glossary of technical terms.
Black background with a bold left-aligned title and a curved array of glass panes in the lower right.
Two-column glossary defining abbreviations such as ACC, AEC, BMC, CPO, CXL, DSP, ESUN, HBM, KV cache, MRM, MZM, NPO, OCI, SerDes, SiPho, TFLN and TIA.
Dense two-column bullet list of acronym: expansion pairs on black.
Section divider for appendices on reconciliations from GAAP to Non-GAAP.
Black background with bold title, subtitle, and an arc of blue glass panes at lower right.
Full-page disclosure text explaining what Non-GAAP measures exclude, the Non-GAAP tax rate (11.0% for Q2 FY27), how management uses the measures, their limitations, and that forward reconciliations after Q3 FY27 are not provided.
Full-width small-print paragraphs with one four-item bullet list under a large title.
Table for Q2'26, Q1'27 and Q2'27: GAAP gross profit $1,010.6M, $1,260.8M and $1,455.6M reconciles to Non-GAAP gross profit of $1,191.4M, $1,423.8M and $1,614.0M after stock-based comp, intangible amortization and restructuring items.
Three-period table with blue header and grey-highlighted latest column, plus a footnote.
GAAP gross margin of 50.4%, 52.1% and 53.1% reconciles to Non-GAAP gross margin of 59.4%, 58.9% and 58.9% across Q2'26, Q1'27 and Q2'27.
Three-period percentage table with blue header and highlighted latest column, plus a footnote.
GAAP operating expenses of $720.5M, $921.4M and $995.9M reconcile to Non-GAAP operating expenses of $492.6M, $576.9M and $610.8M after special items such as stock-based comp of $(310.3)M in Q2'27.
Three-period table with parenthetical negatives, highlighted latest column and two footnotes.
GAAP operating income of $290.1M, $339.4M and $459.7M reconciles to Non-GAAP figures of $698.8M, $846.9M and $1,003.2M for Q2'26, Q1'27 and Q2'27 (the last row is labeled operating expenses on the slide).
Three-period table with highlighted Q2'27 column and footnotes.
GAAP operating margin of 14.5%, 14.0% and 16.8% reconciles to Non-GAAP operating margin of 34.8%, 35.0% and 36.6% for Q2'26, Q1'27 and Q2'27.
Percentage reconciliation table with highlighted latest column and two footnotes.
GAAP interest and other loss, net of $(56.4)M, $(256.1)M and $(81.4)M reconciles to Non-GAAP $(48.2)M, $(40.1)M and $(30.3)M, mainly via contingent consideration fair-value changes of $250.7M in Q1'27 and $52.0M in Q2'27.
Compact three-period table with two-line title, highlighted latest column and a footnote.
GAAP net income of $194.8M, $34.5M and $308.0M reconciles to Non-GAAP net income of $585.5M, $718.0M and $865.9M after pre-tax special items of $416.9M, $723.5M and $594.6M and tax adjustments.
Long ten-row reconciliation table with highlighted Q2'27 column.
Footnotes (a)-(c) defining restructuring items, other costs and the Non-GAAP income tax rate (11.0% for the 2026 periods, 10.0% for 2025).
Text-only continuation page with three lettered footnotes under the title.
Diluted shares of 870.4M, 893.3M and 921.2M; GAAP diluted EPS of $0.22, $0.04 and $0.33 versus Non-GAAP diluted EPS of $0.67, $0.80 and $0.94 for Q2'26, Q1'27 and Q2'27.
Two stacked tables (share counts, then per-share amounts) with a highlighted latest column.
Q3'27 outlook: net revenue $3,150M +/- 5%; GAAP gross margin 52.9%-53.9% reconciles to Non-GAAP 57.5%-58.5% after ~0.8% stock-based comp and ~3.9% amortization.
Single-column outlook table with blue header and grey value cells on the left half of the slide.
Q3'27 GAAP operating expenses of ~$1,015M less SBC 285, amortization 72, restructuring 1 and other 2 give Non-GAAP operating expenses of ~$655M.
Single-column outlook table with blue header and grey value cells.
Q3'27 GAAP diluted EPS of $0.53 +/- $0.05 reconciles to Non-GAAP diluted EPS of $1.10 +/- $0.05 via SBC 0.34, amortization 0.21, tax effects (0.03) and other 0.05.
Single-column outlook table with blue header and grey value cells.
Final closing slide with MARVELL logo, INVESTOR DAY and OCTOBER 6, 2026 over the glass-pane emblem artwork.
Left-aligned logo, large title and date on black, with a fan of blue glass panes carrying the embossed Marvell emblem at right.
Συχνές ερωτήσεις σχετικά με αυτή τη διαφάνεια και το βασικό περιεχόμενο παρουσίασης.
It is the 161-slide deck Marvell Technology presented at its Investor Day in New York on October 6, 2026. It covers the CEO's strategy, the operating plan, deep dives on connectivity, data center interconnect, data center networking and custom cloud solutions, and the CFO's long-term financial model, plus key terms and GAAP-to-non-GAAP reconciliations.
The deck raises the FY28 total revenue outlook to $20B, raises the FY29 custom revenue target to $12B+, and sets an FY31 total revenue target of $70–90B (a 55–60% FY26–FY31 CAGR) with an FY31 implied non-GAAP EPS above $30. The long-term model targets 56–59% gross margin, 44–46% operating margin and free cash flow above 36% of revenue.
Marvell sizes its total TAM at about $400B in CY30, growing roughly 45% a year from CY25. That splits into roughly $235B custom, $85B switching and storage, $65B interconnect and $15B comms and other, set against data center CAPEX of about $3T by CY30.
Ross Seymore (SVP, Investor Relations) opens, followed by Matt Murphy (Chairman and CEO), Chris Koopmans (President and COO), Sandeep Bharathi (President, Data Center Group), Xi Wang (Connectivity), Russ Esmacher (Data Center Interconnect), Dave Lazovsky (Data Center Networking), Will Chu (Custom Cloud Solutions) and Dan Durn (EVP and CFO).
Yes. The gallery page provides the original PDF and a PPTX converted from it, so you can study the layouts or adapt individual slides. Because the PPTX is converted from the PDF, some complex graphics may come through as images rather than native editable shapes.
It is a strong reference for structure: a short legal and agenda front section, a CEO vision section, operating and business-unit deep dives each opened by a speaker slide, a CFO financial model, a recap 'Why invest' slide, and an appendix of reconciliations. Swap in your own figures and keep the big-number callouts and before/updated target reveals.
A dark theme throughout: black backgrounds, translucent blue glass 3D renders on title and speaker slides, white sans-serif headlines, blue accent highlights, and large single-figure callouts for key metrics. Technical slides use layered reach diagrams and simple bar charts on the same dark canvas.
Yes. Slides 147–160 reconcile GAAP to non-GAAP gross profit, gross margin, operating expenses, operating income and margin, interest and other loss, net income and diluted EPS for Q2'26, Q1'27 and Q2'27, plus the Q3 FY27 outlook (revenue $3,150M +/- 5%, non-GAAP EPS $1.10 +/- $0.05).
Official event page with the presentation PDF and webcast

Create Your Own Slides
Turn your ideas into professional presentations in seconds with 2slides AI.
Αναφερθείτε σε επαγγελματικές σχεδιάσεις, επιλέξτε το στυλ σας και δημιουργήστε σλάιντ με τέλεια απόδοση κειμένου. Τροφοδοτείται από το Nano Banana—ξεκινήστε να δημιουργείτε την παρουσίασή σας τώρα.
Ο Πράκτορας AI σας για διαφάνειες. Εξοικονομήστε χρόνο, λάμψτε πιο γρήγορα με έξυπνη δημιουργία παρουσιάσεων.




© 2026 2slides. Όλα τα δικαιώματα διατηρούνται.