
Ανήκει στη συλλογή Παραδείγματα παρουσιάσεων για επενδυτές
Mapletree Pan Asia Commercial Trust (MPACT) 2Q & 1H FY26/27 financial results presentation, lodged with SGX (Singapore Exchange) via SGXNET on 30 October 2026. It reports 2Q distribution per unit (DPU) of 1.94 Singapore cents (-3.5% yoy) and 1H DPU of 3.90 cents, net property income (NPI) of S$153.5 million (S$ = Singapore dollars) in 2Q (-6.3%), finance expenses down 10.1% in 2Q, aggregate leverage of 38.1%, committed occupancy of 85.6% and VivoCity 1H rental reversion of +15.0%. Mapletree's financial year runs April to March, so FY26/27 is 1 April 2026 to 31 March 2027; 2Q FY26/27 covers July to September 2026 and 1H covers April to September 2026.
Χρησιμοποιεί το εξώφυλλο αυτής της παρουσίασης ως πρότυπο στυλ για διαφάνειες με το δικό σας περιεχόμενο. Ή επιλέξτε οποιαδήποτε σελίδα παρακάτω για να χρησιμοποιήσετε τη διάταξή της ως αναφορά.
Γρήγορη Πλοήγηση
Ετικέτες
Κοινοποίηση διαφανειών
Mapletree Pan Asia Commercial Trust (MPACT) 2Q & 1H FY26/27 financial results presentation, lodged with SGX (Singapore Exchange) via SGXNET on 30 October 2026. It reports 2Q distribution per unit (DPU) of 1.94 Singapore cents (-3.5% yoy) and 1H DPU of 3.90 cents, net property income (NPI) of S$153.5 million (S$ = Singapore dollars) in 2Q (-6.3%), finance expenses down 10.1% in 2Q, aggregate leverage of 38.1%, committed occupancy of 85.6% and VivoCity 1H rental reversion of +15.0%. Mapletree's financial year runs April to March, so FY26/27 is 1 April 2026 to 31 March 2027; 2Q FY26/27 covers July to September 2026 and 1H covers April to September 2026.
Λεπτομερής προβολή κάθε σελίδας διαφάνειας, συμπεριλαμβανομένης της διάταξης, βασικού περιεχομένου και οπτικών στοιχείων.
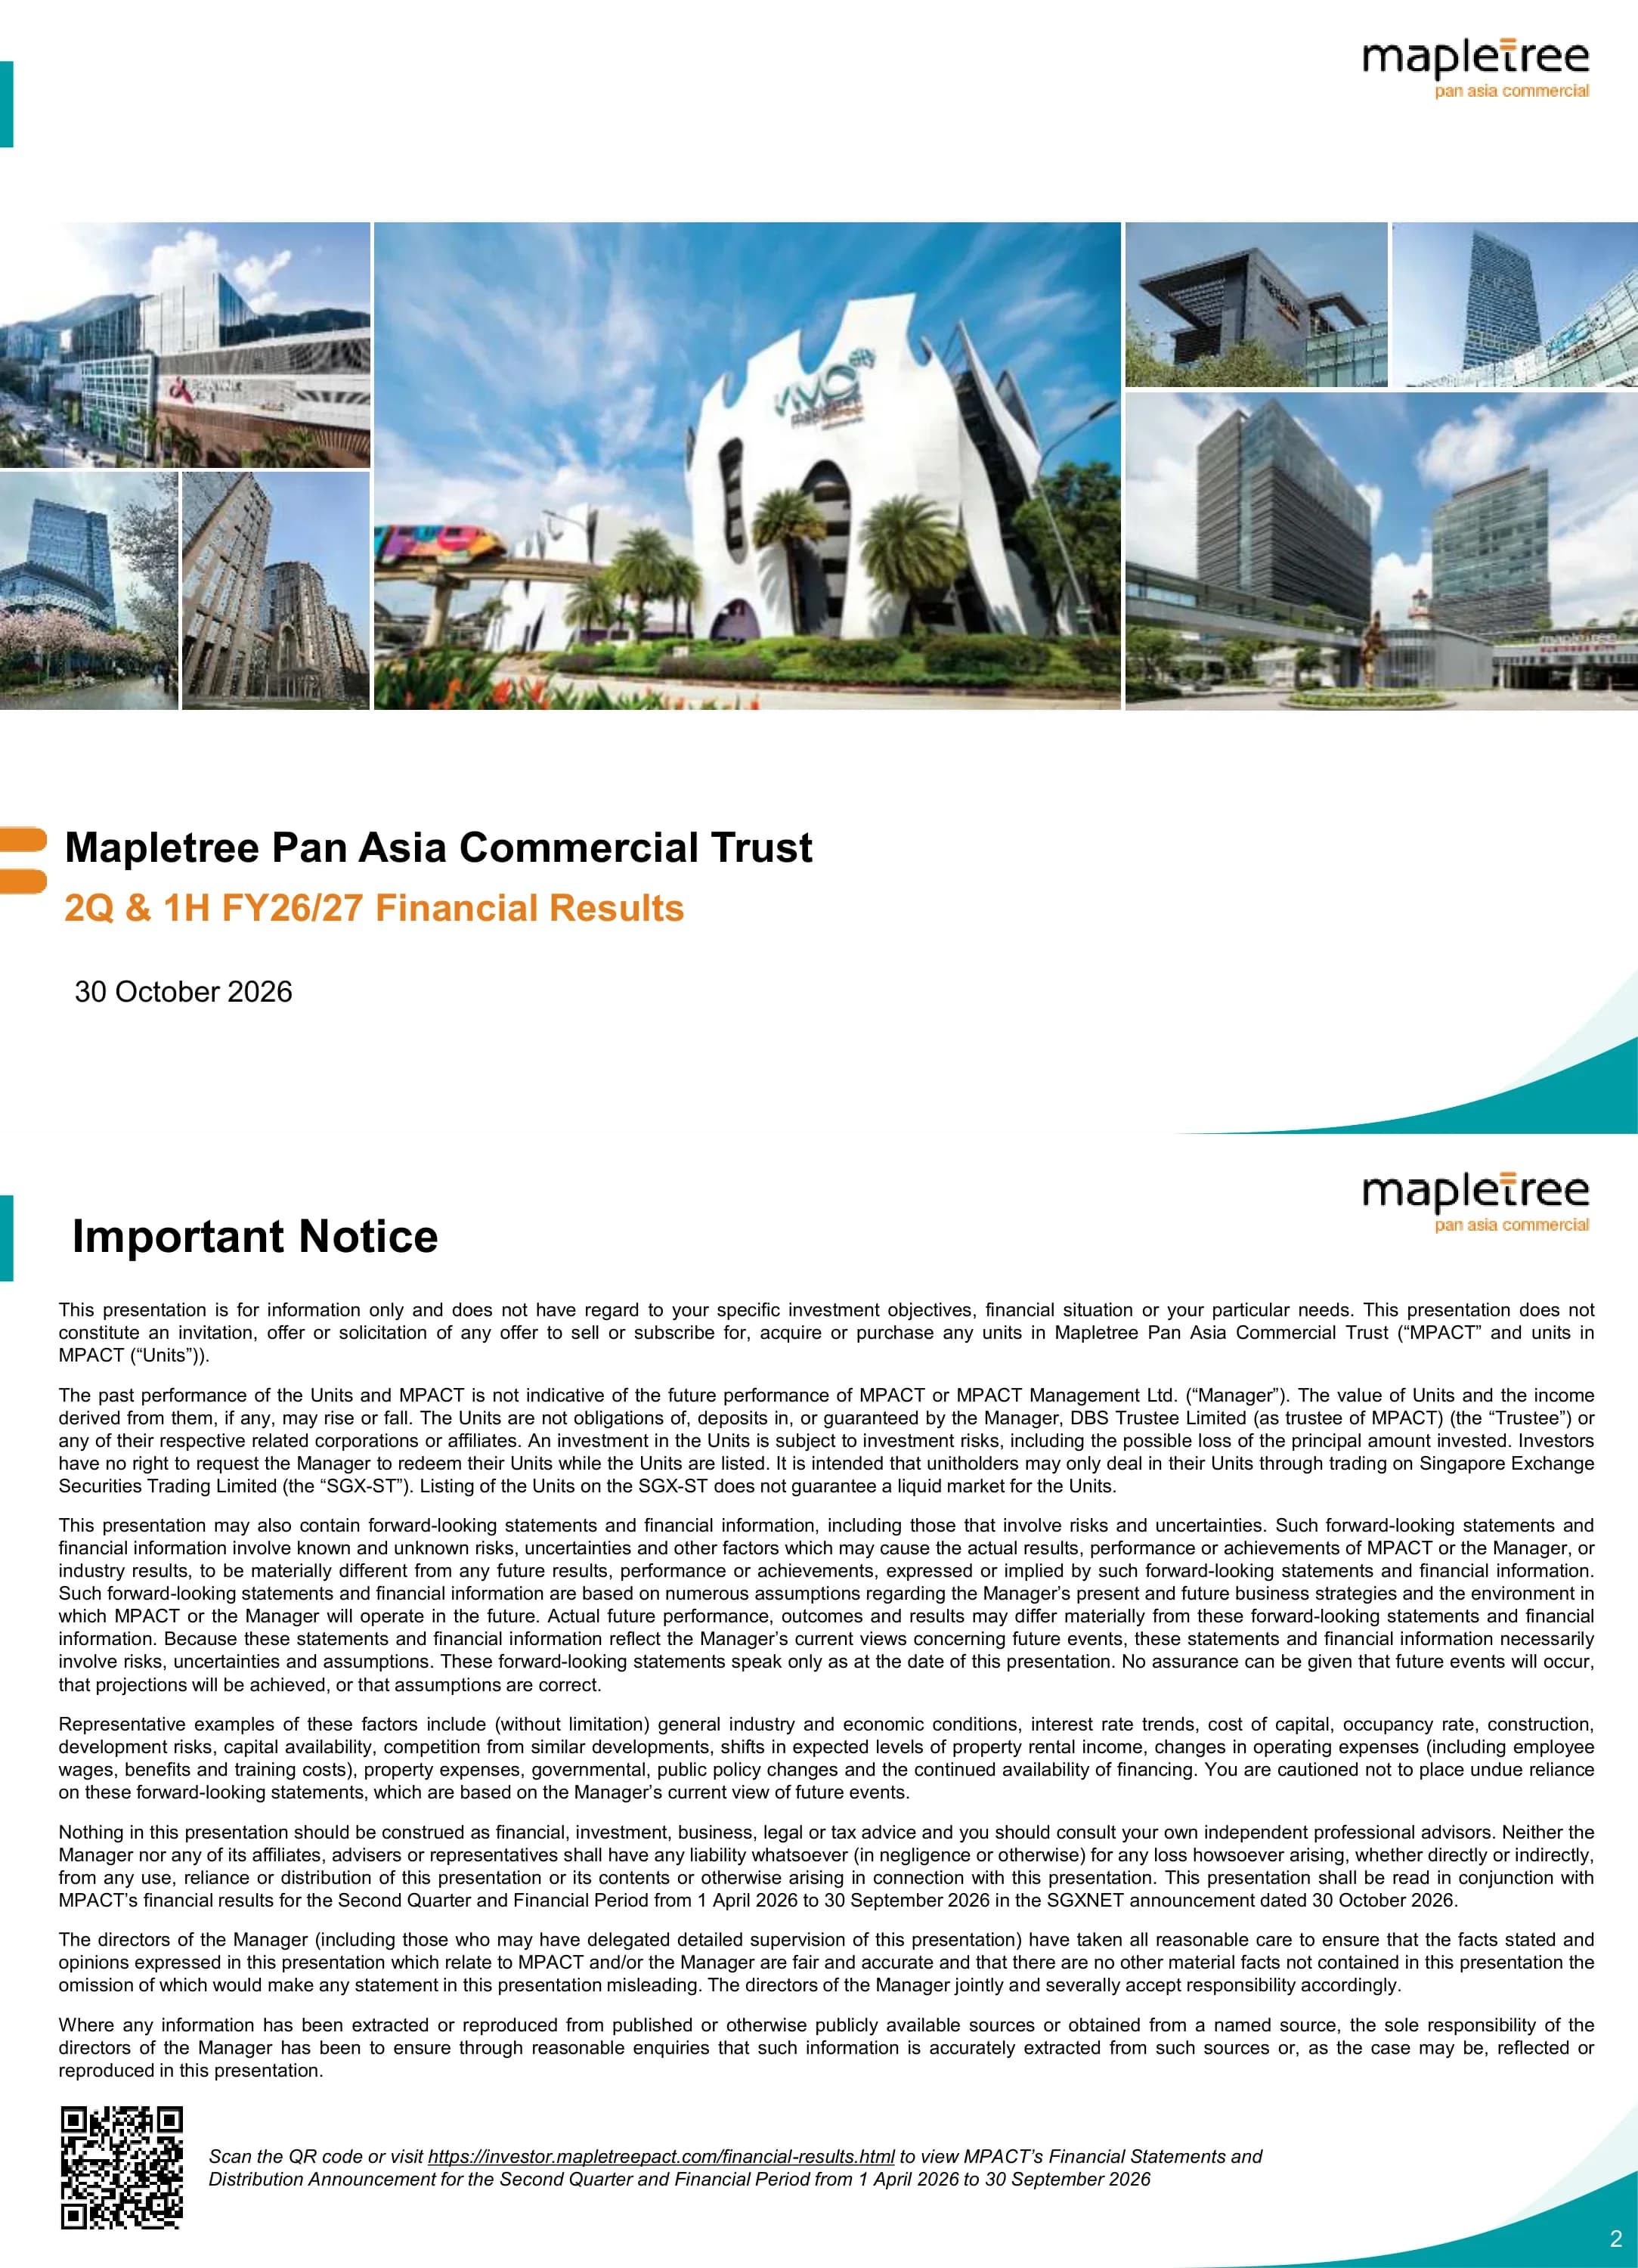
Title slide for Mapletree Pan Asia Commercial Trust, 2Q & 1H FY26/27 Financial Results, dated 30 October 2026.
Full-bleed collage of property photos (VivoCity centre, Festival Walk, Mapletree Business City, Japan and China towers) with title block and logo overlay.
Disclaimer stating units are not obligations of the Manager (MPACT Management Ltd.) or DBS Trustee and trade on the SGX-ST. It tells readers to read the deck with the SGXNET announcement of 30 October 2026 for the period 1 April to 30 September 2026, with a QR code to investor.mapletreepact.com/financial-results.html.
Text-heavy legal disclaimer in dense paragraphs with a QR code to the investor relations page.
Agenda listing Key Highlights (p4), Financial Performance (p7), Portfolio Highlights (p17), Commitment to Sustainability (p30), Outlook (p33), Appendix 1 Market Information (p36) and Appendix 2 Other Asset Information (p55).
Numbered section list with page references beside decorative maple-leaf artwork.
Divider introducing the Key Highlights section, illustrated with the VivoCity 20 Years installation photo.
Full-bleed photograph with section title overlay.
KPI tiles show 2Q DPU of 1.94 Singapore cents, NAV per unit of S$1.73, aggregate leverage of 38.1% and weighted all-in cost of debt of 2.95% p.a. Also shown are AUM of S$15.3bn across 15 commercial properties in five gateway markets (including 50% of The Pinnacle Gangnam), committed occupancy of 85.6%, WALE of 2.3 years and rental reversion of +3.5%.
Grid of large-number KPI tiles with short labels under each figure.
Finance expenses fell 10.1% in 2Q and 14.4% in 1H on lower rates and debt reduction from FY25/26 divestment proceeds, while DPU of 1.94 cents (2Q) and 3.90 cents (1H) were lower yoy. Leverage was 38.1% with ICR of 3.3x, occupancy rose 1.2pp qoq to 85.6%, VivoCity NPI rose 5.0% in 2Q and 6.9% in 1H with 1H reversion of +15.0%, and MPACT was named a GRESB 2026 Sector Leader.
Bulleted text slide grouped by theme (capital management, occupancy, VivoCity, Festival Walk, sustainability).
Divider introducing the Financial Performance section with a glass fish sculpture at Mapletree Business City.
Full-bleed photograph with section title overlay.
Gross revenue was S$207,483k vs S$218,486k (-5.0%), NPI S$153,543k vs S$163,904k (-6.3%), finance expenses S$42,558k vs S$47,350k (-10.1%), distributable amount S$103,074k vs S$106,205k (-2.9%) and DPU 1.94 vs 2.01 cents (-3.5%). Drivers include the FJM non-renewal, China macro, Hong Kong retail and the divested TSI, ASY and Festival Walk Tower, with Singapore revenue +0.3%.
Financial table with teal header and variance column, plus a commentary panel on the drivers.
On a comparable basis gross revenue moved from S$216.9m to S$210.5m and NPI from S$162.9m to S$155.8m. VivoCity grew (revenue 62.3 to 66.0, NPI 46.4 to 48.8) while China (18.6 to 15.5) and Japan (14.4 to 11.2) revenue declined; core assets contributed 58% of revenue and 60% of NPI.
Two stacked bar charts (revenue and NPI) comparing the two periods, with segment labels and a callout on core assets.
1H gross revenue was S$413,945k vs S$437,102k (-5.3%), NPI S$308,317k vs S$329,894k (-6.5%), finance expenses S$83,434k vs S$97,448k (-14.4%), distributable amount S$207,276k vs S$212,974k (-2.7%) and DPU 3.90 vs 4.02 cents (-3.0%). Singapore revenue grew 1.2%, while constant-currency revenue fell 4.9% and NPI 6.4%.
Financial table with teal header and variance column, with commentary notes below.
1H gross revenue moved from S$433.4m to S$419.9m and NPI from S$327.5m to S$312.8m on a comparable basis, with VivoCity revenue up 7.5% and NPI up 6.9%. By market, revenue was Singapore 66%, Hong Kong 19%, China 8%, Japan 5% and Korea 1%; core assets were 58% of revenue and 59% of NPI.
Stacked bar charts for revenue and NPI plus market-share donut or percentage breakdown.
At 30 September 2026, investment properties were S$15,021,114k, total assets S$15,389,737k, net borrowings S$5,772,164k and net assets S$9,172,344k, with perpetual securities down to nil after the S$250m redemption. NAV per unit was S$1.73 on 5,291,445k units, and a S$200m fixed-rate note was issued in June 2026.
Two-column balance sheet table (30 Sep 2026 vs 31 Mar 2026) with teal header and footnotes.
Gross debt was S$5,913.4m at 30 Sep 2026, aggregate leverage 38.1% (37.7% at 30 Jun 2026; 37.6% a year ago), ICR 3.3x, cost of debt 2.95% (3.23% a year ago), fixed-rate share 71.8% and term to maturity 3.2 years. Moody's rating is Baa2 (negative) throughout and debt/NAV is 64.5%.
Three-period comparison table with teal header (30 Sep 26, 30 Jun 26, 30 Sep 25).
Gross debt is S$5.9bn with about S$0.6bn liquidity; ICR is 3.3x, 3.0x if EBITDA falls 10% and 2.5x if rates rise 100bps. Debt by currency is SGD 61%, HKD 16%, JPY 13%, RMB 7% and KRW 2%, and maturities run from S$256m in FY26/27 to S$400m in FY33/34 (peak S$1,323m in FY29/30).
Multi-panel slide with currency pie charts, AUM by geography and a debt maturity bar chart.
72% of debt is fixed and 28% floating (SGD 15, HKD 5, JPY 4, RMB 3, KRW 1), and a 50bps rate change equals 0.14 cents of DPU p.a. About 94% of distributable income is in SGD or hedged (SGD 80, hedged 15, unhedged 6).
Two donut charts (debt mix and income currency exposure) with sensitivity callout.
Distribution for 1 July to 30 September 2026 is 1.94 cents per unit, with notice on 30 October, cum date 5 November, ex-date 6 November 2026 at 9am, record date 10 November at 5pm and payment on 16 December 2026.
Compact table of distribution period, rate and key dates in teal and orange.
Divider introducing the Portfolio Highlights section with a Mapletree Business City photo.
Full-bleed photograph with section title overlay.
Committed occupancy was 85.6% with rental reversion of 3.5% and 479,613 sq ft of retail plus 1,734,792 sq ft of office/business park space renewed or re-let, for 74.0% tenant retention. VivoCity tenant sales rose 4.1% and traffic 1.1%; Festival Walk sales rose 3.9% and traffic 6.7%.
Summary KPI panels for portfolio, VivoCity and Festival Walk.
Portfolio committed occupancy was 85.6% vs 84.4% at 30 Jun 2026 and 88.9% a year ago. MBC reached 95.4%, VivoCity 100%, Festival Walk 99.9%, China 84.5% and Japan 57.5% (impacted by FJM), with The Pinnacle Gangnam at 99.9%.
Occupancy table by asset with three period columns and notes on BOAHF and mTower.
Across 231 leases covering 1,292.5k sq ft, retention was 74.0% and reversion +3.5%. VivoCity achieved +15.0% (83 leases), Pinnacle +32.7%, MBC +1.4%, Japan +2.4%, while Festival Walk was -15.6% and China -29.9%.
Table of leases, retention, area and reversion per asset with total row, teal header.
Portfolio WALE is 2.3 years (1.9 years on a commencement basis), with retail at 1.9 and office/business park at 2.7 years. By gross rental income, retail/office expiries are 4.9%/7.2% in FY26/27, 16.8%/9.7% in FY27/28 and 4.7%/13.5% in FY30/31 and beyond.
Clustered bar chart of expiry by year split by retail and office, with WALE figures.
Four panels cover Singapore (95.4% occupancy, retention 81.0%/81.6%, reversion 1.4%/5.5%), China (84.5%, -29.9% reversion), Japan (about 6% of AUM, 57.5% occupancy, 2.4% reversion) and Korea (99.9%, 32.7% reversion).
Four-panel layout, one per market, each with occupancy, retention, reversion and lease-expiry metrics.
VivoCity had 100% occupancy, retention of 73.3% and reversion of +15.0%, while Festival Walk had 99.9% occupancy, retention of 56.7% and reversion of -15.6%.
Two-panel comparison of VivoCity and Festival Walk with metric tiles.
1H traffic rose from 21.9m to 22.1m (+1.1%) and tenant sales from S$519.1m to S$540.5m (+4.1%); 2Q tenant sales were S$273.7m vs S$264.9m. Circle Line Stage 6 opened on 12 July 2026 and HarbourFront Centre closed on 27 July 2026.
Paired bar charts for traffic and sales by quarter with event notes.
New tenants include Bake it Babe, Bee Cheng Hiang, Mister Mobile and Tissot, while Burberry beauty boutique, MUJI, PUMA and Typo have been rejuvenated.
Photo grid of storefronts labelled new and rejuvenated.
Highlights include the Sanrio Characters Moonlit Garden x TANGS Mid-Autumn Fair 2026 (25 August to 27 September) and Sky Park lanterns, supported by press coverage.
Event photo collage with press clipping montage.
1H traffic rose from 15.6m to 16.6m (+6.7%), with 2Q traffic up 10.3% (8.0m to 8.8m). Tenant sales grew from HK$1,696.4m to HK$1,761.9m (+3.9%) and 2Q sales were HK$898.3m (+3.7%); space reconfiguration was completed in July 2026.
Paired bar charts for traffic and sales with reconfiguration note.
New and remixed tenants shown include ICBC, So Gor Beef Brisket, Asics and Go Wild.
Photo grid of storefronts with tenant labels.
Events include the Winnie the Pooh 100th pop-up, the Beware of Love press conference, Toei Animation 70th, Kalos Blocks x Coca-Cola and a Nintendo Switch 2 Yoshi event.
Event photo collage with captions.
Divider introducing the sustainability section with a Mapletree Business City garden photo.
Full-bleed photograph with section title overlay.
Four pillars (Resilient & Sustainable Business, Climate Change, Social Value in Workplace & Community, High Ethical Standards) map 12 material topics to the UN SDGs. Targets include 60% of occupied area under green leases by 2030, 100% green-certified portfolio, 78.5% Scope 1+2 carbon intensity reduction by 2035 vs FY23/24 and 50% renewable electricity by 2030.
Four-pillar framework diagram with material topics, SDG icons and a targets panel.
A Net Zero by 2050 roadmap runs from foundation and stakeholder engagement to decarbonisation levers and compensation. MPACT earned 2026 GRESB Global Sector Leader (Listed, Diversified Office/Retail), Regional Sector Leader Asia, an improved Five-Star rating and Public Disclosure Level A.
Roadmap timeline above award badges and community photo strip.
Divider introducing the Outlook section with a Mapletree Business City photo.
Full-bleed photograph with section title overlay.
The environment is shaped by geopolitical tensions, higher energy costs and rising interest rates. Singapore is 61% of AUM and 68% of NPI, with VivoCity AEIs and MBC lease commencements from 3Q FY26/27, while overseas the focus is occupancy, Festival Walk remixing and portfolio optimisation in core markets.
Bulleted outlook text grouped into operating environment, Singapore, overseas and capital management.
Closing slide with investor relations contacts Teng Li Yeng and Cassandra Seet of Investor Relations & Sustainability.
Thank-you message with contact block above a property photo strip.
Divider for Appendix 1 Market Information, showing the Festival Walk ice rink (Glacier).
Full-bleed photograph with section title overlay.
Per Colliers (27 Oct 2026), Orchard rent was S$38.10 psf/month (+0.3% qoq) at 92.8% occupancy and suburban rent S$21.00 (-0.1%) at 95.3%. 3Q 2026 GDP grew 1.1% qoq and 5.4% yoy, the 2026 forecast was upgraded to 4.5-5.5%, and about 1.4m sq ft of new retail supply is due from rest-2026 to 2028.
Left-hand statistics and commentary with a map of VivoCity and the Greater Southern Waterfront on the right.
Planned retail supply table for 2026-2028 includes Bukit V (173.4k sq ft, 2027), Newport Tower (222.0k, 2027), Golden Mile Redevelopment (114.4k, 2027), One Sophia (82.7k, 2028) and Parktown Tampines (80.9k, 2028).
Multi-column supply table listing project, area and completion year with teal header.
Monthly retail sales from Jul-22 to Aug-26 range roughly S$3.1bn to S$4.4bn with an online share of about 12.6% to 19.5%. In Aug-26, sales were S$3.8bn and online share 18.2%.
Combination bar and line chart with sales bars and online share line.
Arrivals were 19.1m in 2019, 2.7m in 2020, 0.3m in 2021, 6.3m in 2022, 13.6m in 2023, 16.5m in 2024, 16.9m in 2025 and 12.7m in 9M 2026. Arrivals fell 1.8% yoy for Jul-Sep and 1.7% for 9M.
Annual bar chart with growth callouts.
Islandwide office rent was S$7.03 psf/month (+1.9% qoq) with 89.0% occupancy (-0.2pp) in 2Q 2026, CBD at S$12.23 and City Fringe at S$8.24. About 2.7m sq ft of new supply is due to 2028, with demand from tech and non-bank financials.
Statistics and commentary panel beside a map of office districts.
Projects listed include Solitaire On Cecil (197.0k sq ft, 2026), Newport Tower (220.0k, 2027), The Skywaters (745.0k, 2028), Clifford Centre (345.0k, 2028) and One Comcentre (809.0k, 2028).
Supply table of project, area and year with teal header.
Central Region business park rent was S$4.50 psf/month (-4.3% qoq) with 89.0% occupancy (+3.7pp) in 2Q 2026, and no known new supply for 2026-2028. Mapletree Business City is positioned as a Grade A integrated hub.
Statistics panel, supply table with dashes and a business park cluster map.
Kowloon East retail rent was HK$255 psf/month (+0.4% qoq) with 85.9% occupancy; Hong Kong 2Q 2026 GDP grew 4.3% yoy with the full-year forecast raised to 3.5-4.5%. Visitors rose 12% in Jan-Sep, retail sales rose 5.1% in Jul-Aug, and about 1.0m sq ft of new supply is due in rest-2026.
Statistics and commentary with a map showing Festival Walk's link to Kowloon Tong MTR and its 830 car parks.
Supply includes XRL Terminus retail (602.8k sq ft, 2026), The KEyPoint (300.0k, 2026), Lee Garden Eight (107.6k, 2026), 35 Clear Water Bay Road (575.9k, 2028) and NKIL 6649 Kai Tak (160.3k, 2028).
Supply table of project, area and year with teal header.
Monthly sales from Jul-22 to Aug-26 range about HK$28bn to HK$37bn, peaking at HK$37.3bn in Jan-26, with online share of about 6% to 15%. Aug-26 sales were HK$32.1bn and online share 8.7%.
Combination bar and line chart of monthly sales and online share.
Arrivals were 55,913k in 2019, 34,003k in 2023, 44,514k in 2024, 49,895k in 2025 and 40,704k in 9M 2026 (mainland 31,900k). Jul-Sep arrivals rose 9.0% to 14.0m and 9M rose 11.6%.
Annual bar chart with growth callouts and mainland share.
Lufthansa Grade A rent was RMB179.2 psm/month (-6.9% qoq) with 72.7% occupancy, while Beijing overall occupancy was 80.3% and rents fell 4.1% qoq. China 3Q GDP grew 4.5%, and about 0.7m sqm of supply is due to 2028; Gateway Plaza sits in the Lufthansa district.
Statistics and commentary beside a Beijing district map.
Supply in thousand sqm includes Maoyuan Yao Zone (38.0, 4Q26), Chaoyang Station hub (68.0, 4Q27), Indigo Phase II (106.9, 2027), Digital Financial Technology Demonstration Park (213.3, 2027) and Dajia Life Building (117.2, 3Q28).
Supply table of project, area and completion with teal header.
Zhangjiang rent was RMB3.40 psm/day (-0.5% qoq) with 67.3% occupancy (+1.2pp), while overall Shanghai business park occupancy was 70.5% in 3Q 2026 and rents fell 5.6% yoy. About 2.8m sqm of supply is due to 2028, mainly Jinqiao (47%) and Zhangjiang (41%), with Sandhill Plaza located at Zhangjiang Science City.
Statistics and commentary beside a map of core and emerging business parks.
A table of about 27 projects includes Shanghai Riverfront Harbor B-3-10 (155.0k sqm, 4Q26), Zhangjiang Middle Zone Plot 41-13 (275.5k, 2027) and Golden Valley WK14-4 Qingtian (390.0k, 2028).
Long supply table of project, area and completion with teal header.
Tokyo 18 wards rent was JPY21,623 per tsubo/month (+1.2% qoq) with 96.8% occupancy, and Chiba rent was JPY12,742 (+3.1%) at 91.2%. Makuhari vacancies will take longer to backfill; supply includes Osaki Core, World Trade Center Building, TORANOGATE (36,000 tsubo, 4Q27) and Torch Tower (108,000 tsubo, 1Q28).
Statistics and commentary with a supply table beside a Tokyo area map.
GBD rent was KRW145,898 per pyeong/day (+3.9% qoq) with 98.0% occupancy, and Seoul overall occupancy was 95.9%. Korea 3Q GDP grew 3.4% yoy; about 0.5m pyeong of supply is due to 2028, and The Pinnacle Gangnam is a 20-storey freehold office with 181 parking lots.
Statistics and commentary with Seoul district map and asset description.
A table of about 19 projects from 4Q26 to 4Q28 is mostly CBD at 0.01-0.07 million pyeong, with KDIC Seocho (GBD) at 0.11 in 1Q28 and Sewoon 3-8,9,10 at 0.07 in 2Q28.
Long supply table of project, district, area and completion with teal header.
Divider for Appendix 2 Other Asset Information, showing the Festival Walk atrium.
Full-bleed photograph with section title overlay.
As at 31 March 2026, the top ten tenants contribute 21.4% of gross rental income excluding undisclosed names, led by Google Asia Pacific (6.2%), BMW (3.3%) and Merrill Lynch Global Services (2.0%). Others include TaSTe, Hewlett-Packard Japan, IMDA, HSBC, Mapletree Investments and NTUC FairPrice (1.4%).
Ranked horizontal bar chart or table of ten tenants with percentage of GRI.
By gross rental income at 31 March 2026, F&B is 17.2%, IT services & consultancy 14.3%, fashion 7.8%, banking & financial 6.2% and department store/supermarket 5.3%. Remaining categories run from 4.6% (beauty & health) to 2.0% (consumer goods), with others at 6.9%.
Horizontal bar chart of trade categories ranked by share of GRI.
At 31 March 2026 Singapore was valued at S$9,291.0m (+S$278.0m, +3.1%), overseas at S$5,920.1m (-9.2%, of which valuation -S$301.7m and forex -S$301.1m), and the total at S$15,211.1m (-2.1%). Excluding forex the total change was -S$23.7m (-0.2%).
Comparison table of valuations versus 31 March 2025 with three callout boxes.
VivoCity was valued at S$4,062.0m (+5.4%, S$3,752 psf, cap rate 4.40%), MBC I at S$2,372.0m (+0.9%), MBC II at S$1,670.0m (+0.4%), mTower at S$827.0m (+4.2%) and BOAHF at S$360.0m (+2.9%), totalling S$9,291.0m (+3.1%).
Table of valuation, change and cap rate per Singapore asset with a note on new valuers.
Festival Walk was HK$20,700m (-4.9% local; S$3,387.1m, cap 4.30%), Gateway Plaza RMB5,290m (-8.5%), Sandhill Plaza RMB2,070m (-4.7%), Japan JPY117,620m (-2.1% local, S$944.9m) and The Pinnacle Gangnam KRW258,050m (+2.4%, S$221.0m for 50%). The overseas total was S$5,920.1m.
Table of local-currency value, change, S$ value and cap rate per overseas asset.
VivoCity is a retail asset at 1 HarbourFront Walk on a 99-year lease from 1997, with 1,082,644 sq ft, 2,183 car park lots and a valuation of S$4,062.0m. MBC I (S$2,372.0m) and MBC II (S$1,670.0m) total 2,885,678 sq ft with 2,001 lots and tenants such as Google, IMDA, Samsung and SAP.
Asset fact-sheet panels with photo, key details table and tenant list.
mTower at 460 Alexandra Road has 523,582 sq ft, a Green Mark GoldPLUS rating and a valuation of S$827.0m. BOAHF at 2 HarbourFront Place has 215,963 sq ft, a LEED Gold rating, a valuation of S$360.0m and Merrill Lynch as a tenant.
Two asset fact-sheet panels with photo, details and tenant list.
Festival Walk (588,890 sq ft, HK$20,700m, 830 lots, lease to 2047), Gateway Plaza Beijing (1,145,896 sq ft, RMB5,290m), Sandhill Plaza Shanghai (683,115 sq ft, RMB2,070m) and The Pinnacle Gangnam (478,461 sq ft, KRW258,050m, S$221.0m for 50%) are shown, all acquired in 2022.
Four asset fact-sheet panels with photo, key facts and tenant list.
Freehold assets acquired in 2022 include HP Japan HQ Building (457,426 sq ft, JPY40,900m, S$328.6m), IXINAL Monzen-nakacho (73,753 sq ft, JPY8,540m) and Omori Prime Building (73,168 sq ft, JPY7,670m).
Three asset fact-sheet panels with photo and key facts.
Higashi-nihonbashi 1-chome (27,996 sq ft, JPY2,800m), mBAY POINT Makuhari (923,077 sq ft, JPY33,000m, S$265.1m), Fujitsu Makuhari Building (329,023 sq ft after Fujitsu left, JPY9,910m, S$79.6m) and Makuhari Bay Tower (402,444 sq ft, JPY14,800m, S$118.9m) complete the asset listing.
Four asset fact-sheet panels with photo and key facts.
Συχνές ερωτήσεις σχετικά με αυτή τη διαφάνεια και το βασικό περιεχόμενο παρουσίασης.
Mapletree's financial year runs from April to March, so FY26/27 is 1 April 2026 to 31 March 2027. The deck covers 2Q FY26/27 (July to September 2026) and 1H FY26/27 (April to September 2026), with comparisons to the same periods a year earlier.
It was lodged with SGX (Singapore Exchange) via SGXNET on 30 October 2026, alongside the financial statements and distribution announcement for the period 1 April to 30 September 2026. The Important Notice slide also points to the investor relations page at investor.mapletreepact.com/financial-results.html.
Under SGX's half-yearly reporting regime, Singapore issuers' 1Q and 3Q releases are business updates, while the 2Q and 4Q (half-year and full-year) releases carry full financial statements. This is a full 2Q & 1H results deck, with an income statement, balance sheet, capital management and distribution details.
2Q DPU was 1.94 Singapore cents (-3.5% yoy) and 1H DPU was 3.90 cents (-3.0%). For the 1 July to 30 September 2026 distribution, the ex-date is 6 November 2026 and payment is on 16 December 2026 (record date 10 November).
Overseas headwinds weighed on income: the non-renewal of the Fujitsu Makuhari Building (FJM) in Japan, China macro conditions and Hong Kong retail, plus the divestments of TSI, ASY and Festival Walk Tower and a weaker yen. These were partly offset by VivoCity (2Q NPI +5.0%, 1H reversion +15.0%) and finance expenses falling 10.1% in 2Q.
The deck covers Key Highlights, Financial Performance, Portfolio Highlights, Sustainability, Outlook, then Appendix 1 (market information for Singapore, Hong Kong, Beijing, Shanghai, Greater Tokyo and Seoul) and Appendix 2 (tenants, trade mix, valuations and asset fact sheets). Its structure of KPI tiles, comparison tables, stacked bar charts, supply tables and photo dividers works well as a template for REIT or real-estate results presentations. A downloadable PPTX conversion and the PDF are both available.
Aggregate leverage was 38.1%, gross debt S$5,913.4m, interest coverage ratio 3.3x, weighted all-in cost of debt 2.95% p.a., about 72% of debt fixed-rate and term to maturity 3.2 years. Moody's rating is Baa2 (negative), and the S$250m of perpetual securities was redeemed.
Official investor relations page referenced on the deck's Important Notice slide, hosting the financial statements and distribution announcement.

Create Your Own Slides
Turn your ideas into professional presentations in seconds with 2slides AI.
Αναφερθείτε σε επαγγελματικές σχεδιάσεις, επιλέξτε το στυλ σας και δημιουργήστε σλάιντ με τέλεια απόδοση κειμένου. Τροφοδοτείται από το Nano Banana—ξεκινήστε να δημιουργείτε την παρουσίασή σας τώρα.
Ο Πράκτορας AI σας για διαφάνειες. Εξοικονομήστε χρόνο, λάμψτε πιο γρήγορα με έξυπνη δημιουργία παρουσιάσεων.


© 2026 2slides. Όλα τα δικαιώματα διατηρούνται.