
Ανήκει στη συλλογή Παραδείγματα παρουσιάσεων για επενδυτές · Παραδείγματα παρουσιάσεων για επενδυτές από την Ιαπωνία
KDDI's earnings presentation for the first half of its fiscal year ending March 2027 (FY2026, April–September 2026), dated November 6, 2026 and presented by President and CEO Hiromichi Matsuda. This is a Japanese-language deck (2027年3月期 2Q決算) whose original was published on TDnet, the Tokyo Stock Exchange's Timely Disclosure network. KDDI, the operator of the au, UQ mobile and povo mobile brands and a Nikkei 225 constituent, reports H1 revenue of ¥3,052.8 billion (30,528 in units of ¥100 million (億円), +4.7% YoY), adjusted operating profit of 6,331 億円 (+13.9%) and adjusted net income attributable to owners of 3,900 億円 (+13.6%), all running ahead of the initial full-year plan. The deck walks through the Telecom Core, Personal Growth and Business Growth segments, mobile KPIs (smartphone IDs, churn, ARPU), the AI-era data center strategy built around Telehouse London and the Osaka Sakai AI factory, drone and robotics initiatives, group governance and cybersecurity reforms, and progress on the 'Power-to-Connect 2028' medium-term plan. Figures are kept in the company's own units: ¥100 million (億円) unless a slide says otherwise.
Χρησιμοποιεί το εξώφυλλο αυτής της παρουσίασης ως πρότυπο στυλ για διαφάνειες με το δικό σας περιεχόμενο. Ή επιλέξτε οποιαδήποτε σελίδα παρακάτω για να χρησιμοποιήσετε τη διάταξή της ως αναφορά.
Γρήγορη Πλοήγηση
Ετικέτες
Κοινοποίηση διαφανειών
KDDI's earnings presentation for the first half of its fiscal year ending March 2027 (FY2026, April–September 2026), dated November 6, 2026 and presented by President and CEO Hiromichi Matsuda. This is a Japanese-language deck (2027年3月期 2Q決算) whose original was published on TDnet, the Tokyo Stock Exchange's Timely Disclosure network. KDDI, the operator of the au, UQ mobile and povo mobile brands and a Nikkei 225 constituent, reports H1 revenue of ¥3,052.8 billion (30,528 in units of ¥100 million (億円), +4.7% YoY), adjusted operating profit of 6,331 億円 (+13.9%) and adjusted net income attributable to owners of 3,900 億円 (+13.6%), all running ahead of the initial full-year plan. The deck walks through the Telecom Core, Personal Growth and Business Growth segments, mobile KPIs (smartphone IDs, churn, ARPU), the AI-era data center strategy built around Telehouse London and the Osaka Sakai AI factory, drone and robotics initiatives, group governance and cybersecurity reforms, and progress on the 'Power-to-Connect 2028' medium-term plan. Figures are kept in the company's own units: ¥100 million (億円) unless a slide says otherwise.
Λεπτομερής προβολή κάθε σελίδας διαφάνειας, συμπεριλαμβανομένης της διάταξης, βασικού περιεχομένου και οπτικών στοιχείων.
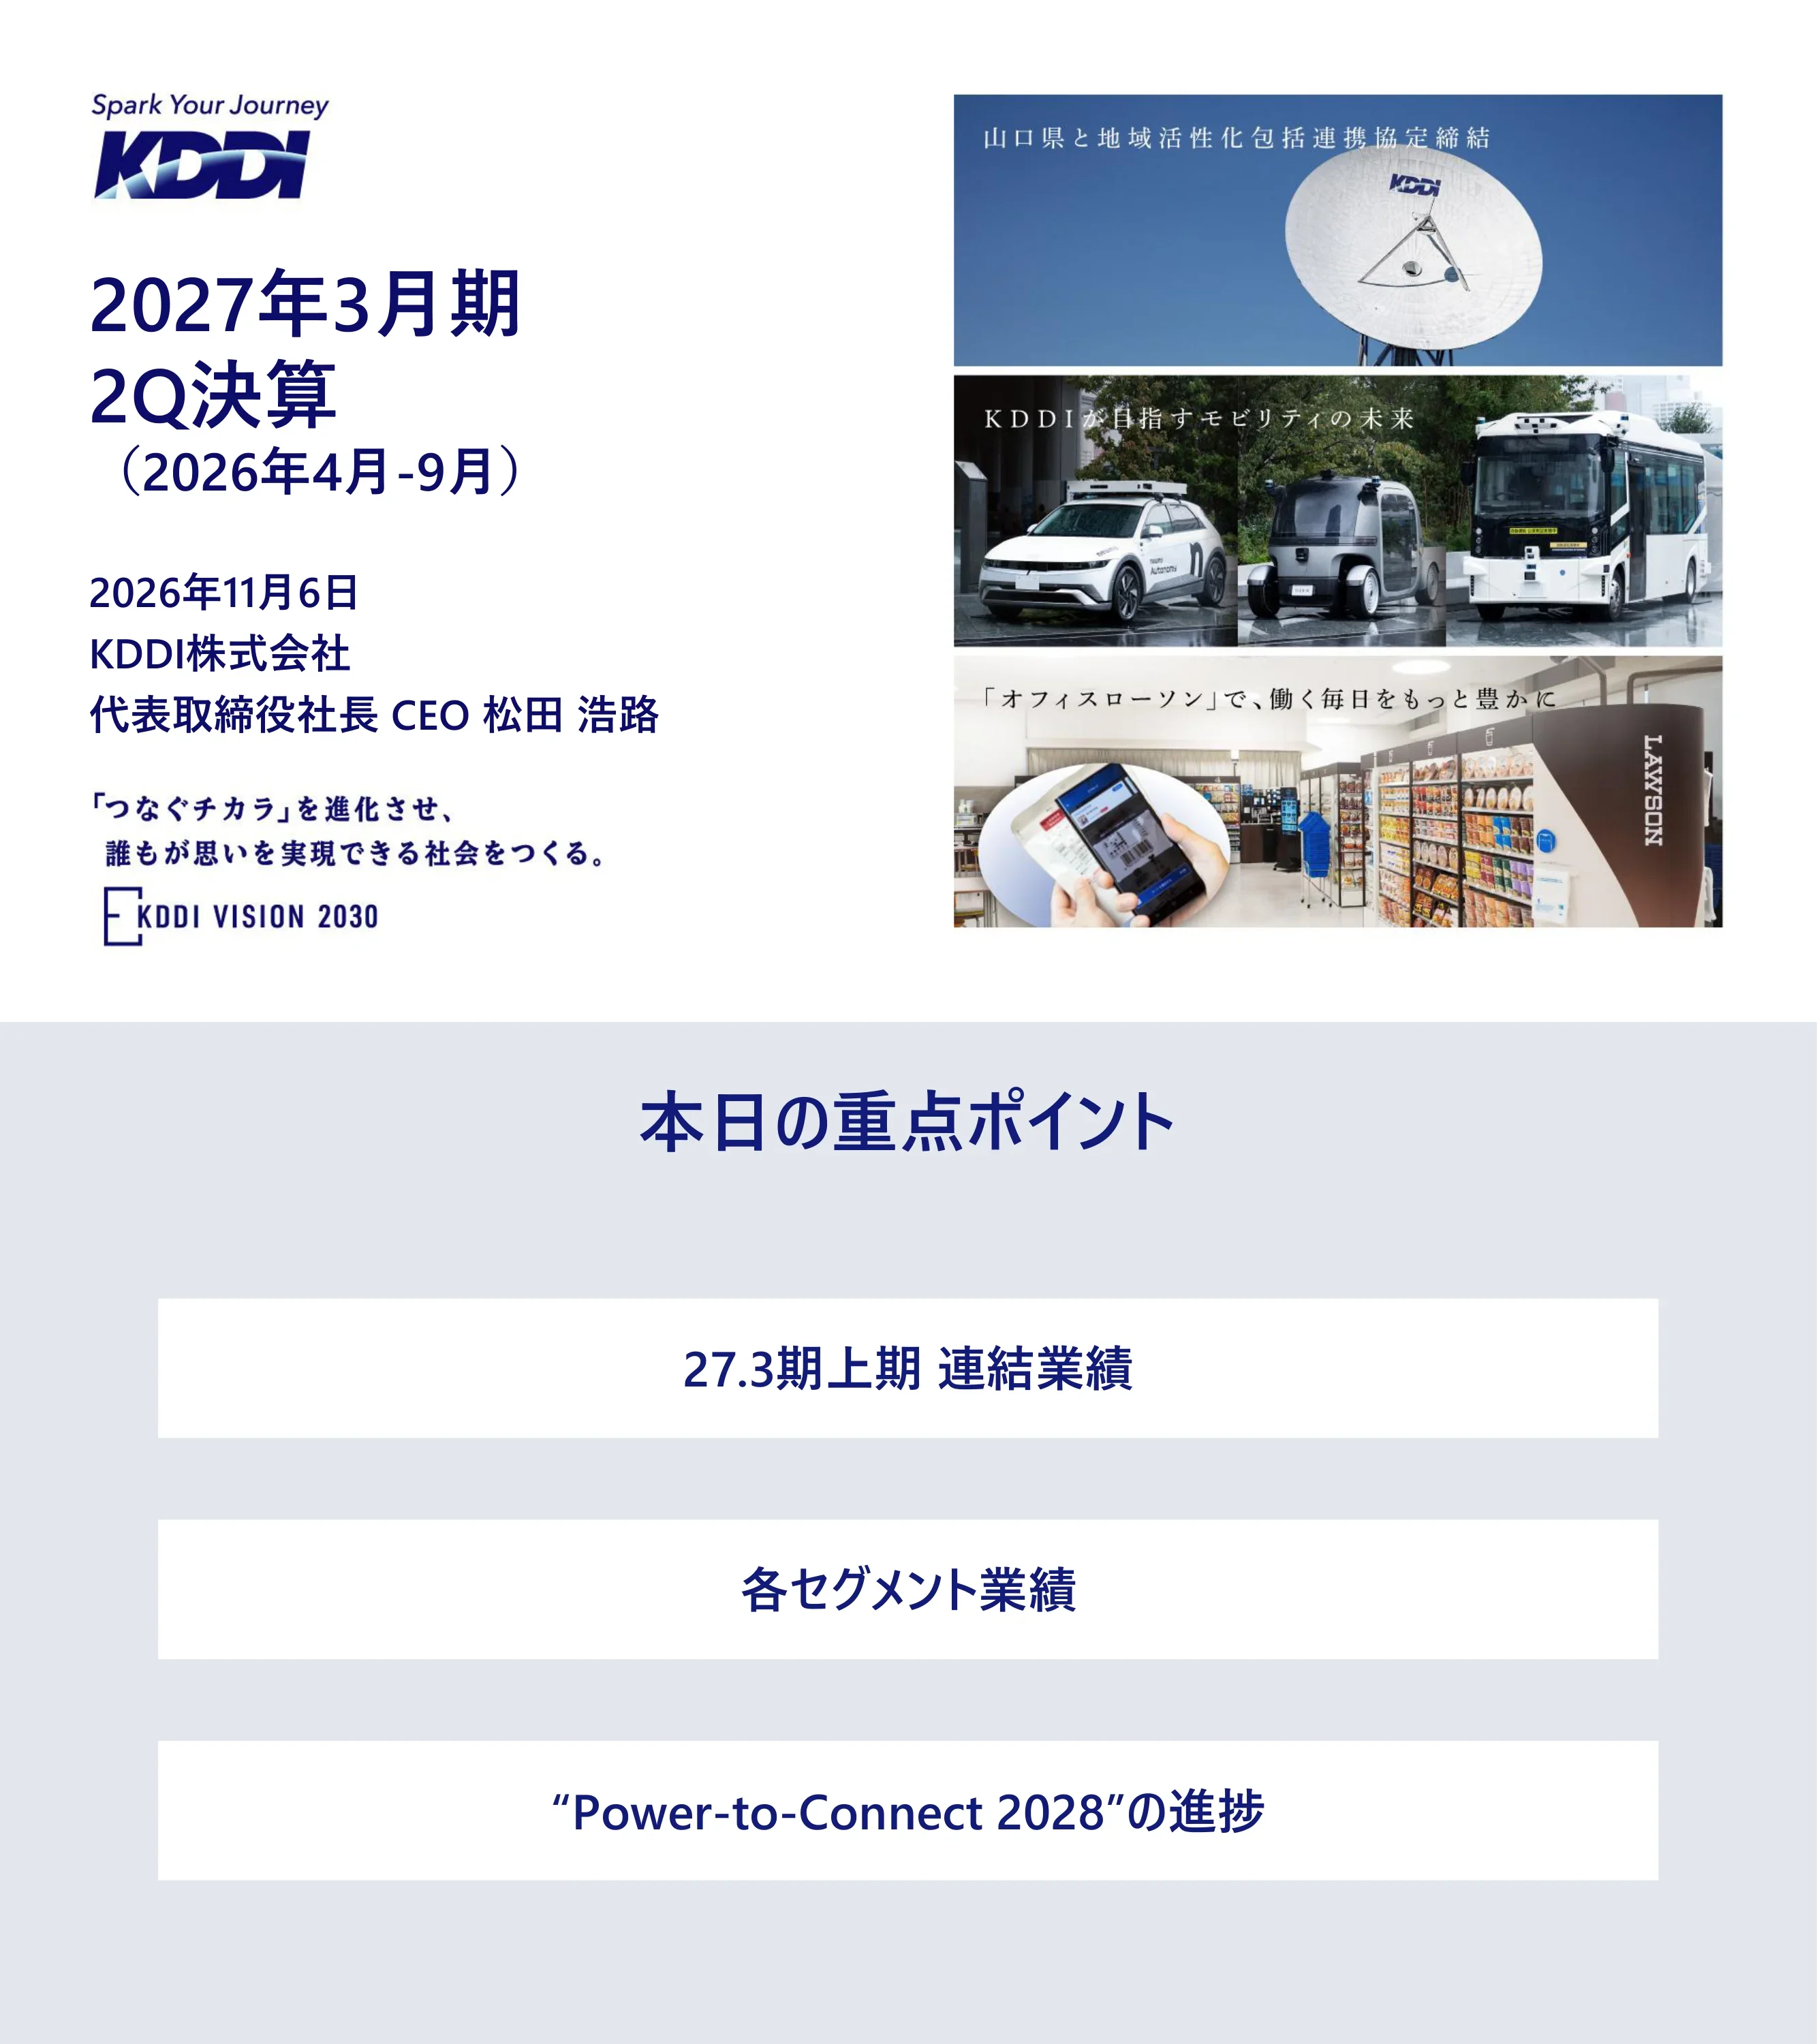
Title slide reading '2027年3月期 2Q決算 (2026年4月-9月)' — results for the second quarter (first half) of the fiscal year ending March 2027 — dated November 6, 2026, from KDDI Corporation, presented by Representative Director, President and CEO Hiromichi Matsuda. Carries the 'Spark Your Journey' tagline, the KDDI VISION 2030 mark and the corporate purpose of evolving 'the power to connect' to build a society where anyone can realize their aspirations.
Split layout: left half holds logo, large navy title, date and presenter; right half stacks three photo panels with Japanese captions.
Agenda listing the three topics of the presentation: (1) consolidated results for the first half of FY3/27, (2) results by segment, and (3) progress on the 'Power-to-Connect 2028' medium-term management plan.
Centered heading above three full-width white bars on a pale grey background, one per agenda item.
Section break introducing the consolidated results for the first half of the fiscal year ending March 2027.
Single centered navy title on a plain pale background.
Three bar-pair charts in ¥100 million (億円) compare H1 FY3/26 with H1 FY3/27. Revenue rose from 29,160 to 30,528 (+4.7% YoY), reaching 47.6% of the full-year forecast announced in May 2026. Adjusted operating profit rose from 5,557 to 6,331 (+13.9%), 52.3% progress. Adjusted net income attributable to owners of the parent rose from 3,434 to 3,900 (+13.6%), 53.4% progress. A footnote defines adjusted profit as excluding non-recurring items and one-off gains and losses from portfolio review.
Three equal columns, each with a dark header, a red-outlined YoY box and a grey-versus-purple bar pair with a rising arrow and a progress-rate callout.
Stacked bars in 億円. Telecom Core revenue rose from 21,341 to 22,010 (+3.1%), with mobile telecom revenue up from 9,521 to 9,856 (+3.5%). Personal Growth rose from 5,588 to 6,053 (+8.3%): finance 1,833 → 2,149 (+17.2%), energy 2,099 → 2,076 (down 1.1%), device-related 1,128 → 1,226 (+8.8%) and Ponta Pass 430 → 449 (+4.5%). Business Growth rose from 3,003 to 3,309 (+10.2%): AI integration and cybersecurity 804 → 953 (+18.6%), Connected 442 → 493 (+11.5%), data centers (overseas connectivity DC) 488 → 577 (+18.2%) and AI-BPO 1,174 → 1,247 (+6.2%).
Three-column segment comparison; each column has a header, YoY box and two stacked bars with dashed connector lines and per-component growth rates.
Waterfall from 5,557 億円 in H1 FY3/26 to 6,331 億円 in H1 FY3/27, an increase of 774 (+13.9%). Telecom Core contributed +624 (+16.7%), split into +280 from mobile telecom revenue (management-accounting basis) and +343 from non-mobile items, attributed to mobile growth and cost-structure reform. Personal Growth added +41 (+3.7%) despite one-off effects in finance and energy; Business Growth added +63 (+18.8%) with profit growth across areas; Other added +46. A note states that profits from this page onward are on an adjusted basis.
Horizontal waterfall chart with start and end bars, floating increment blocks, a dashed box grouping the Telecom Core sub-drivers, and a double-headed arrow showing the total change.
Section break introducing the Telecom Core segment review.
Single centered navy title on a plain pale background.
Explains that sustainable mobile growth and cost-structure reform, pursued as an industry pioneer, are bearing fruit. Left: organic growth in mobile telecom revenue of +335 億円 YoY in H1, with a portion attributed to the effect of a service revision and the remainder organic, and continued growth expected in H2; drivers are more IDs from lower churn, an improved brand mix between au and UQ mobile, and more subscribers on higher-tier plans. Right: profit outside mobile telecom revenue rose +343 億円, driven by LTV-focused cost control plus an accounting change linked to the sales-strategy review (lower amortization of contract costs, partly offset by one-time charges for short-term cancellers).
Two halves joined by a plus sign: left bar chart with three driver cards, right bar chart with two explanation cards; red emphasis text on the reform effect.
Smartphone units in operation rose from 32.93 million (3,293 万) in September 2025 to 33.00 million, 33.23 million, 33.30 million and 33.34 million in September 2026, up 420,000 YoY. Smartphone churn by quarter: 1.21% (FY3/26 2Q), 1.23% (3Q), 1.48% (4Q), 1.17% (FY3/27 1Q) and 1.18% (2Q), an improvement of 0.03 points YoY. Right-hand panels show a declining trend in au/UQ mobile short-term churn (cancellations within one year of a new contract, excluding MNP) as high-LTV initiatives progress, and a declining povo churn rate as 'toppings' suit diverse customers; these two charts carry no axis values.
Left half combines a bar chart (IDs) with a line chart (churn); right half is a bordered panel holding two small unlabeled trend line charts with red downward arrows.
Mobile ARPU rose from ¥4,350 in FY3/26 2Q to ¥4,420 in FY3/27 2Q, up ¥70 (+1.6%). Supporting panels show continued net migration from UQ mobile to au across July, August and September 2026 (bar heights only), and combined subscribers to the 'au Value Link Plan' and UQ mobile 'Komi-Komi Plan Value' exceeding 4 million as of end-September 2026, up from September 2025. Customer touchpoints and sales capability are being strengthened through 'AI × human warmth', illustrated by AI sales support and AI role-play training.
Left column with an ARPU bar pair; right bordered panel split into brand-migration bars, plan-penetration bars with logos, and two photos.
KDDI evolves services it introduced ahead of the industry. Fixed plus mobile: following the 2012 'au Smart Value' bundle, KDDI is launching 'au Hikari Plus', described as Japan's first service that automatically switches a customer from a mobile line to fiber when the fiber line is activated, shortening the wait to go online and improving disaster resilience, aimed at boosting sign-ups and lowering churn. Satellite: after a 2021 business tie-up, 'au Starlink Direct' in 2025 and overseas roaming in 2026, KDDI signed a 'Starlink Mobile V2' service agreement with SpaceX, described as an Asian first, targeting high-speed data and voice in out-of-coverage areas within 2027 (as of November 2026 only some app data works on supported devices and voice is not yet supported).
Two side-by-side panels, each with a header badge ('Japan first', 'Asia first'), a timeline arrow ending in 'NEW', and a detail box below.
Network reliability is presented as the foundation of value-based competition. KDDI cites the most Opensignal awards for five consecutive rounds (Oct 2024, Apr and Oct 2025, Apr and Oct 2026, among Japan's four MNOs). In congested parts of Yokohama and Fukuoka, the 'packet stall' rate fell by about 30% from October. Corporate mobile MNP net additions were about 1.5 times the prior year in H1, with a general contractor (Company A) cited as a customer that valued call quality and Starlink Direct. povo net additions rose about 30% in October 2026 versus September (Oct 1–25 vs prior month).
Left feature block with an advertising visual; three narrow right columns with headers, big red figures and small bar charts.
KDDI uses AI throughout area-quality optimization. 'Create': AI-driven development of applications that automate base-station provisioning and radio emission, developed more than three times faster than before. 'Polish': AI optimizes base stations according to congestion, improving uplink speed during congestion by 60% (per an October 14, 2026 company topic on distributed AI). 'Protect': a recovery-support AI agent identifies fault causes in one-tenth of the time or less (operational since February 19, 2026).
Three equal columns, each with a dark header, a photo overlaid with a purple caption band, and a bold result line beneath.
Section break introducing the Personal Growth and Business Growth segments.
Single centered navy title on a plain pale background.
Operating profit bridge in 億円 from 1,108 to 1,149 (+41, +3.7%): device-related +96 and Ponta Pass/Lawson/other +73 performed well, while finance (au Financial Holdings, adjusted basis) fell 73 mainly on valuation losses and energy fell 56 on lower power demand and timing effects. Key KPIs: Ponta Pass members +190,000 QoQ; Lawson business profit +7.7% YoY (March–August 2026); personal deposit balance 1.3x YoY; au PAY Gold Card members 1.3x and card transaction value 1.3x YoY; au Denki and related contracts +30,000 QoQ.
Left two-thirds waterfall chart with labelled drivers; right third holds three rounded KPI cards (Ponta Pass/Lawson, finance, energy).
Finance: the YoY profit decline continues through 3Q as the deposit-loan balance normalizes, with a return to profit growth expected in 4Q; levers are mortgage rate revisions following higher interest rates, a stronger Gold Card push (auto-charge settings and upgrades) and more 'Mane-katsu' sign-ups. Device-related: rising handset prices are framed as an opportunity; churn of the repair and compensation service has fallen from H1 FY3/26 through H1 FY3/27, and a new 'breakdown and loss support × Ponta Pass' offer adds a reward when no claim is made, including a 'Tsugi-Toku' ticket worth up to ¥22,000 back at the next handset change.
Two halves with dark headers: left has a conceptual 3Q/4Q bar chart and three initiative cards; right has a churn trend line and a promotional panel marked 'New'.
AI integration revenue grew about 29% YoY in H1 and is leading Business Growth. Cloud infrastructure is expanding well, with cloud platform sales up more than 30% YoY via KDDI iret's multi-cloud offering. AI development sales rose about 20% YoY; more than 50 KDDI sales staff joined KDDI iret to increase deal origination, and the number of AI development projects roughly tripled between March 2026 and September 2026.
Left bar pair without values; right conceptual chart plotting unit price against customer base, layering integration/maintenance services on top of the KDDI iret cloud base, with two result boxes.
Overseas connectivity data center revenue rose from 488 to 577 億円 and EBITDA from 214 to 257 億円, with adjusted EBITDA up 20.1% YoY and a margin of 44.5%. About 60% of new orders in H1 (by MW) are for AI inference. In London, KDDI plans to open a sixth building through FY3/28 and to double power-receiving capacity from FY3/29 onward: the existing campus has 78 MVA on 27,178 m² (excluding building six) and a newly acquired adjacent site adds 65 MVA on 29,000 m², next to a campus described as having the world's No.1 connectivity (PeeringDB, October 2026).
Left grouped bar chart (revenue and EBITDA) plus a dashed box with a pie chart; right timeline banner above an annotated aerial photo of the London campus.
Section opener and framework diagram for the medium-term plan. 'AI labor power' contributes to customers' business growth through use cases such as inspection monitoring, product sorting, customer inquiries and robotaxis, powered by Physical Intelligence. 'AI life power' transforms customers' lives and experiences through life consultation, deals and entertainment, health support and local information, powered by Lifestyle Intelligence. Both rest on customer data, the 'digital belt', social implementation capability and company/partner data.
Large title above a symmetrical double-headed arrow split into blue and pink halves, icon tiles inside, upward arrows from a grey foundation platform.
KDDI differentiates by layering value on top of facilities (land, buildings and power). The connectivity type, run under the Telehouse brand, serves AI and network operators with locations close to cities and connectivity ranked No.1 among telecom operators (Structure Research 2025). The AI factory type, exemplified by the Osaka Sakai DC, serves AI service providers and enterprise users with proximity to where AI is used, sovereignty and AI compute resources (GPU/cloud). The model aims for high profitability and low churn per MW plus efficient deployment near demand.
Two stacked-block columns sharing a facility base, a vertical 'value layering' arrow on the left, and a large purple circle summarizing the economics on the right.
Partners gather at Sakai to run a field-driven improvement cycle with two engines: 'run it in Sakai, learn in Sakai'. The model training and R&D engine uses abundant compute for virtual simulation and a network environment that can emulate distributed AI processing, with KDDI introducing next-generation 'Rubin' GPUs among the first adopters. The data collection and social implementation engine runs drones, autonomous driving and robots in the field. New company ELYZA Robotics will handle everything from R&D to deployment, with FY30 targets of ¥30 billion (300億円) in R&D investment, more than 300 physical-AI specialists and over 1,000 robots deployed.
Two bordered panels on a faded aerial photo background, linked by circular arrows labelled with the learning loop.
KDDI continues technology investment and partnerships to bring drones into society. Inspection: a capital tie-up with Skydio (May 2024) for AI drones that fly autonomously in the dark and at night, used for an emergency survey after heavy rain in Ishikawa Prefecture in August 2026, with a medium-term goal of 1,000 drone ports through public-private collaboration. Delivery (new): a strategic partnership with Wing signed October 2026, citing more than 1 million deliveries, with delivery service to start during FY3/28. Coverage: drones based at Lawson convenience stores (Happy Lawson Town Ikeda Fushiodai) and, newly, Japan Post offices under consideration (Suzu Post Office, Ishikawa), enabling remote-piloted AI drones to dispatch from the nearest point as 'Drone as a Service'.
Two halves with dark headers; left has two partner cards (Skydio, Wing) with photos and red targets; right shows Lawson and Japan Post logos over photos and a faint map of Japan.
As a 'first mover', KDDI aims to lead a virtuous cycle in the telecom industry: high-quality networks and high-value services (au Starlink Direct, au 5G Fast Lane) support pricing that matches the value delivered (au Value Link Plan, service revision in August 2025), which strengthens the multi-brand strategy, cash flow and the economic zone (better brand mix, more higher-tier plans, lower churn, sustained net additions), funding infrastructure investment and partnering for the next cycle. Core competences: technology discernment, partnering and a spirit of delivering on commitments.
Circular flow of four purple ellipses connected by grey arrows, with a core-competence box on the left and example labels around the cycle.
KDDI has refreshed how it evaluates investments to strengthen deal sourcing and execution. Before: promotion was split by investment type (business divisions handing to the M&A department for corporate investments, a separate startup-collaboration unit for startup investments), which prioritized feasibility and resulted in few, small deals. After: business divisions, the M&A promotion department and the startup collaboration department source deals jointly, pooling strengths and specialists, with the M&A department handling execution; the goal is more and better-quality sourced deals.
Before/after comparison: left grey process grid with an issues row, right purple panel with overlapping circles (Venn) and a 'reinforcement point' row.
KDDI is building an organization where misconduct is less likely through both 'dry' measures (rules and mechanisms) and 'wet' measures (mutual trust). Dry: rules and mechanisms were built and are in operation in H1 FY3/27; next steps are stronger monitoring, business portfolio review and a review of how seconded executives are used, with an improvement status report to be submitted in December. Wet: promoting trust between KDDI and group companies to raise employees' sense of belonging and build self-deterrence against misconduct; business unit heads held sessions with 79 group companies (April–October), and an engagement-sharing meeting in September gathered 45 people from 23 group companies.
Left dashed box for 'dry' timeline; center stack of three cascading purple bars with arrows; right two photo-backed cards for engagement events.
Drawing on lessons from an incident, KDDI has set up processes for immediate response: it will suspend services to address vulnerabilities without hesitation as a management decision, and assumes intrusion will happen so it can detect early and contain damage. Prevention and defense: cyber-threat observation and analysis, vulnerability diagnosis using frontier AI, and segmentation between servers (microsegmentation). Detection: stronger detection (EDR) to spot suspicious behavior quickly and AI-SOC monitoring. Recovery and neutralization: isolated, tamper-proof backups for early restoration and phishing countermeasures (better mail filtering) to prevent secondary damage.
Red-outlined commitment box with two checkmarks above a three-step process flow (prevent, detect, recover) of purple-headed columns with bullet lists.
Results and KPIs are progressing well, and KDDI is strengthening preparation for further medium-term growth. Progress: (1) double-digit growth led by Telecom Core and Business Growth; (2) revenue related to Rakuten roaming expected to materialize from H2 FY3/27 onward. Toward medium-term organic growth of 5% + α, these gains will be used for future growth: stabilizing the Telecom Core earnings structure (measures to encourage long-term use, channel strengthening to expand customer touchpoints), upfront investment to strengthen growth businesses, and responding to external changes. The gap between IFRS figures and adjusted profit is mainly non-cash, and future cash generation is growing steadily.
Two bordered boxes with dark headers connected by a large grey arrow, with a footnote paragraph under the left box.
Four-row recap. H1 consolidated results: revenue and profit rose in every segment, led by Telecom Core, ahead of the initial plan. Segments: mobile growth and cost reform are paying off with KPIs on track; Personal Growth profit was driven by device-related businesses while finance and energy declined but key KPIs were solid; Business Growth increased profit in five areas, with AI integration and connectivity DC steady. Power-to-Connect 2028: Osaka Sakai is positioned as the launch base for AI implementation, the growth-investment structure has been refreshed, and group governance and cybersecurity efforts are advancing. Medium-term: the FY3/27 interim dividend per share is ¥42, up 5.0% YoY, with the year-end decision to be judged at fiscal year-end.
Full-width two-column table with dark category cells on the left and bulleted statements on the right.
Section break introducing supplementary financial material.
Single centered navy title on a plain pale background.
Waterfall in 億円 for adjusted net income attributable to owners of the parent: from 3,434 in H1 FY3/26, adjusted operating profit added +774, interest expense (pre-tax) reduced it by 97 and other items by 210, ending at 3,900 in H1 FY3/27, an increase of 466.
Horizontal waterfall with grey start bar, purple gain block, grey decline blocks and navy end bar, plus a total-change arrow.
Balance sheets in billions of yen, IFRS. KDDI excluding au Financial Holdings (consolidated less auFH): total assets ¥9.84 trillion, including property, plant and equipment, intangibles and right-of-use assets 4,481.6, goodwill 508.8, trade and other receivables 2,195.6, cash 230.9 and other 2,427.6; liabilities and equity include interest-bearing debt 3,551.2, trade and other payables 404.2, other liabilities 734.3 and equity 5,154.9. au Financial Holdings (consolidated): total assets ¥9.00 trillion, with cash 657.8, securities 785.6, loans 6,230.6 and other 1,327.8; borrowings 1,454.1, deposits 6,181.1, other 993.0 and equity 373.7.
Two side-by-side block (treemap-style) balance sheets, assets in red tones and liabilities/equity in purple and grey, with totals underneath.
Reconciliation table in 億円. Operating profit: IFRS 5,550 (H1 FY3/26) and 5,593 (H1 FY3/27), +43; adjustments in H1 FY3/27 are AEON impairment +557, menu impairment +127, Kakaku.com remeasurement gain +0 and other +55, totalling +738 (vs +7 a year earlier), giving adjusted operating profit of 5,557 and 6,331 (+774). Net income attributable to owners: IFRS 3,599 and 3,633 (+34); adjustments AEON +471, menu +99, Kakaku.com remeasurement gain −349 and other +48 (vs −164 a year earlier), totalling +268, giving adjusted figures of 3,434 and 3,900 (+466). Adjustments are mainly non-cash; if the Kakaku.com sale is completed in H2, the net income adjustment for the year is expected to be roughly flat.
Full-width table with a dark two-level header (operating profit and net income, each with prior year, current year and YoY), shaded IFRS and adjusted rows, and a two-line note below.
Thirteen transactions in H1 are expected to generate about ¥150 billion (約1,500億円) of cash (including sales not yet completed, based on the latest proposed amounts as of November 6, 2026). Major divestments: Lifenet Insurance (April 2026, life insurance), Loco Partners (June 2026, travel), Gunosy (August 2026, news and game media), Kakaku.com (timing undecided; internet media, sale decided in May 2026) and menu (food delivery, service ended September 30, 2026 and liquidation in progress). Eight further transactions include sales of cross-shareholdings.
Headline statement above a three-column table (company, timing, notes) with a note line beneath.
Detailed tracker. Rules: group-wide standards for purchasing and credit management introduced at all target companies (July) and the KDDI Code of Conduct revised (July). Mechanisms: financial-statement review meetings held four times (July–October); a new group finance review meeting held seven times since launch (September–October); a group governance reinforcement council met five times and decided anti-complacency measures (September); an AI credit-screening system and a financial-data anomaly detection tool went live (August). Dialogue: visits to top management of 13 key strategic subsidiaries (April–July), 'dialogue sessions' with 52 group company heads (June–July), business-unit-head sessions with 79 companies (April–October) and an engagement-sharing meeting with 45 people from 23 companies (September). Training: fraud-risk education reached 100% completion among all employees (September). Next: stronger monitoring, portfolio review, review of seconded executives, further group-wide rollout and a governance enhancement month; the long-term aim is passing on lessons and building autonomous deterrence.
Matrix table with row groups (dry: rules and mechanisms; wet: dialogue and training) and columns for initiative, progress and next steps, plus a dark banner at the bottom.
Closing slide with the KDDI logo and 'Spark Your Journey' tagline, and a disclaimer stating that performance targets, subscriber targets, forecasts, strategies and other non-historical statements are based on information currently available and are subject to uncertainties such as domestic and overseas conditions, the economy, competition, laws and regulations, government actions and the success of new services, so actual results may differ materially.
Centered logo in the upper half and a navy-bordered disclaimer text box in the lower half.
Συχνές ερωτήσεις σχετικά με αυτή τη διαφάνεια και το βασικό περιεχόμενο παρουσίασης.
The original slides are in Japanese. It is KDDI's earnings presentation material (決算説明会資料) for the second quarter of the fiscal year ending March 2027, and it was published on TDnet, the Tokyo Stock Exchange's Timely Disclosure network run by Japan Exchange Group. The descriptions on this page are English summaries of each slide.
KDDI's fiscal year runs from April to March. The fiscal year ending March 2027 is FY2026, so the first half covered here is April to September 2026. The deck itself labels it '27.3期上期' (first half of the period ending March 2027), and the presentation is dated November 6, 2026.
Revenue was 30,528 in units of ¥100 million (億円), up 4.7% YoY. Adjusted operating profit was 6,331 億円, up 13.9%, and adjusted net income attributable to owners was 3,900 億円, up 13.6%. Progress against the full-year forecast announced in May 2026 was 47.6%, 52.3% and 53.4% respectively.
Most charts use ¥100 million (億円), so 6,331 means ¥633.1 billion. The balance sheet on slide 31 uses billions of yen (十億円), and mobile ARPU on slide 10 is in plain yen per month (¥4,420). This page keeps the units the company uses.
Smartphone IDs reached 33.34 million at the end of September 2026, up 420,000 YoY. Smartphone churn was 1.18% in 2Q, 0.03 points better than a year earlier. Mobile ARPU rose ¥70 (+1.6%) to ¥4,420, and subscribers to the higher-tier au Value Link and UQ mobile Komi-Komi Plan Value plans exceeded 4 million.
KDDI excludes non-recurring items and one-off portfolio effects. In H1 FY3/27 those were mainly an AEON-related impairment (+557 億円 at operating level), a menu impairment (+127) and a Kakaku.com remeasurement gain (−349 at net income level). IFRS operating profit was 5,593 億円 against adjusted operating profit of 6,331 億円. The company says the adjustments are mostly non-cash.
Overseas connectivity data center revenue grew from 488 to 577 億円 with a 44.5% adjusted EBITDA margin, and about 60% of new orders are for AI inference. KDDI plans to expand its London Telehouse campus, adding a 65 MVA site next to the existing 78 MVA campus. The Osaka Sakai data center is positioned as an AI factory with next-generation Rubin GPUs, and a new company, ELYZA Robotics, targets 1,000 or more robots by FY30.
Yes. The page offers the original PDF and an editable PPTX converted from it. Because the source is Japanese, the slide text in the PPTX is Japanese. You can reuse the waterfall, segment-breakdown and KPI layouts as templates for your own results presentation.
Original Japanese-language presentation filed on the Tokyo Stock Exchange's Timely Disclosure network.

Create Your Own Slides
Turn your ideas into professional presentations in seconds with 2slides AI.
Αναφερθείτε σε επαγγελματικές σχεδιάσεις, επιλέξτε το στυλ σας και δημιουργήστε σλάιντ με τέλεια απόδοση κειμένου. Τροφοδοτείται από το Nano Banana—ξεκινήστε να δημιουργείτε την παρουσίασή σας τώρα.
Ο Πράκτορας AI σας για διαφάνειες. Εξοικονομήστε χρόνο, λάμψτε πιο γρήγορα με έξυπνη δημιουργία παρουσιάσεων.


© 2026 2slides. Όλα τα δικαιώματα διατηρούνται.