
Ανήκει στη συλλογή Παραδείγματα παρουσιάσεων για επενδυτές · Παραδείγματα παρουσιάσεων για επενδυτές από την Αυστραλία
Greatland Resources Investor Presentation November 2026 is the 46-slide corporate presentation that Greatland Resources Limited (ASX: GGP, AIM: GGP) lodged with the ASX as 'Corporate Presentation - November 2026'. It presents Greatland as a leading Australian gold-copper producer in Western Australia's Paterson Province, built on the operating Telfer mine and processing plant and the Havieron development project. All '$' figures in the deck are Australian dollars (A$) unless stated. Headline numbers: September 2026 quarter production of 70.1koz gold and 2.9kt copper at an AISC of $2,925/oz; FY27 guidance of 260-300koz gold at $2,900-3,330/oz AISC; $1,314m cash with nil debt and $1,789m total liquidity at 30 September 2026; a Group Mineral Resource of 14.9Moz Au and 644kt Cu and an Ore Reserve of 5.0Moz Au and 196kt Cu; and a Havieron Feasibility Study showing a 17+ year mine life, 266koz a year at steady state and a $1,610/oz steady-state AISC, with a post-tax NPV(5%) of $2.9 billion at a A$4,500/oz long-term gold price.
Χρησιμοποιεί το εξώφυλλο αυτής της παρουσίασης ως πρότυπο στυλ για διαφάνειες με το δικό σας περιεχόμενο. Ή επιλέξτε οποιαδήποτε σελίδα παρακάτω για να χρησιμοποιήσετε τη διάταξή της ως αναφορά.
Γρήγορη Πλοήγηση
Ετικέτες
Κοινοποίηση διαφανειών
Greatland Resources Investor Presentation November 2026 is the 46-slide corporate presentation that Greatland Resources Limited (ASX: GGP, AIM: GGP) lodged with the ASX as 'Corporate Presentation - November 2026'. It presents Greatland as a leading Australian gold-copper producer in Western Australia's Paterson Province, built on the operating Telfer mine and processing plant and the Havieron development project. All '$' figures in the deck are Australian dollars (A$) unless stated. Headline numbers: September 2026 quarter production of 70.1koz gold and 2.9kt copper at an AISC of $2,925/oz; FY27 guidance of 260-300koz gold at $2,900-3,330/oz AISC; $1,314m cash with nil debt and $1,789m total liquidity at 30 September 2026; a Group Mineral Resource of 14.9Moz Au and 644kt Cu and an Ore Reserve of 5.0Moz Au and 196kt Cu; and a Havieron Feasibility Study showing a 17+ year mine life, 266koz a year at steady state and a $1,610/oz steady-state AISC, with a post-tax NPV(5%) of $2.9 billion at a A$4,500/oz long-term gold price.
Λεπτομερής προβολή κάθε σελίδας διαφάνειας, συμπεριλαμβανομένης της διάταξης, βασικού περιεχομένου και οπτικών στοιχείων.
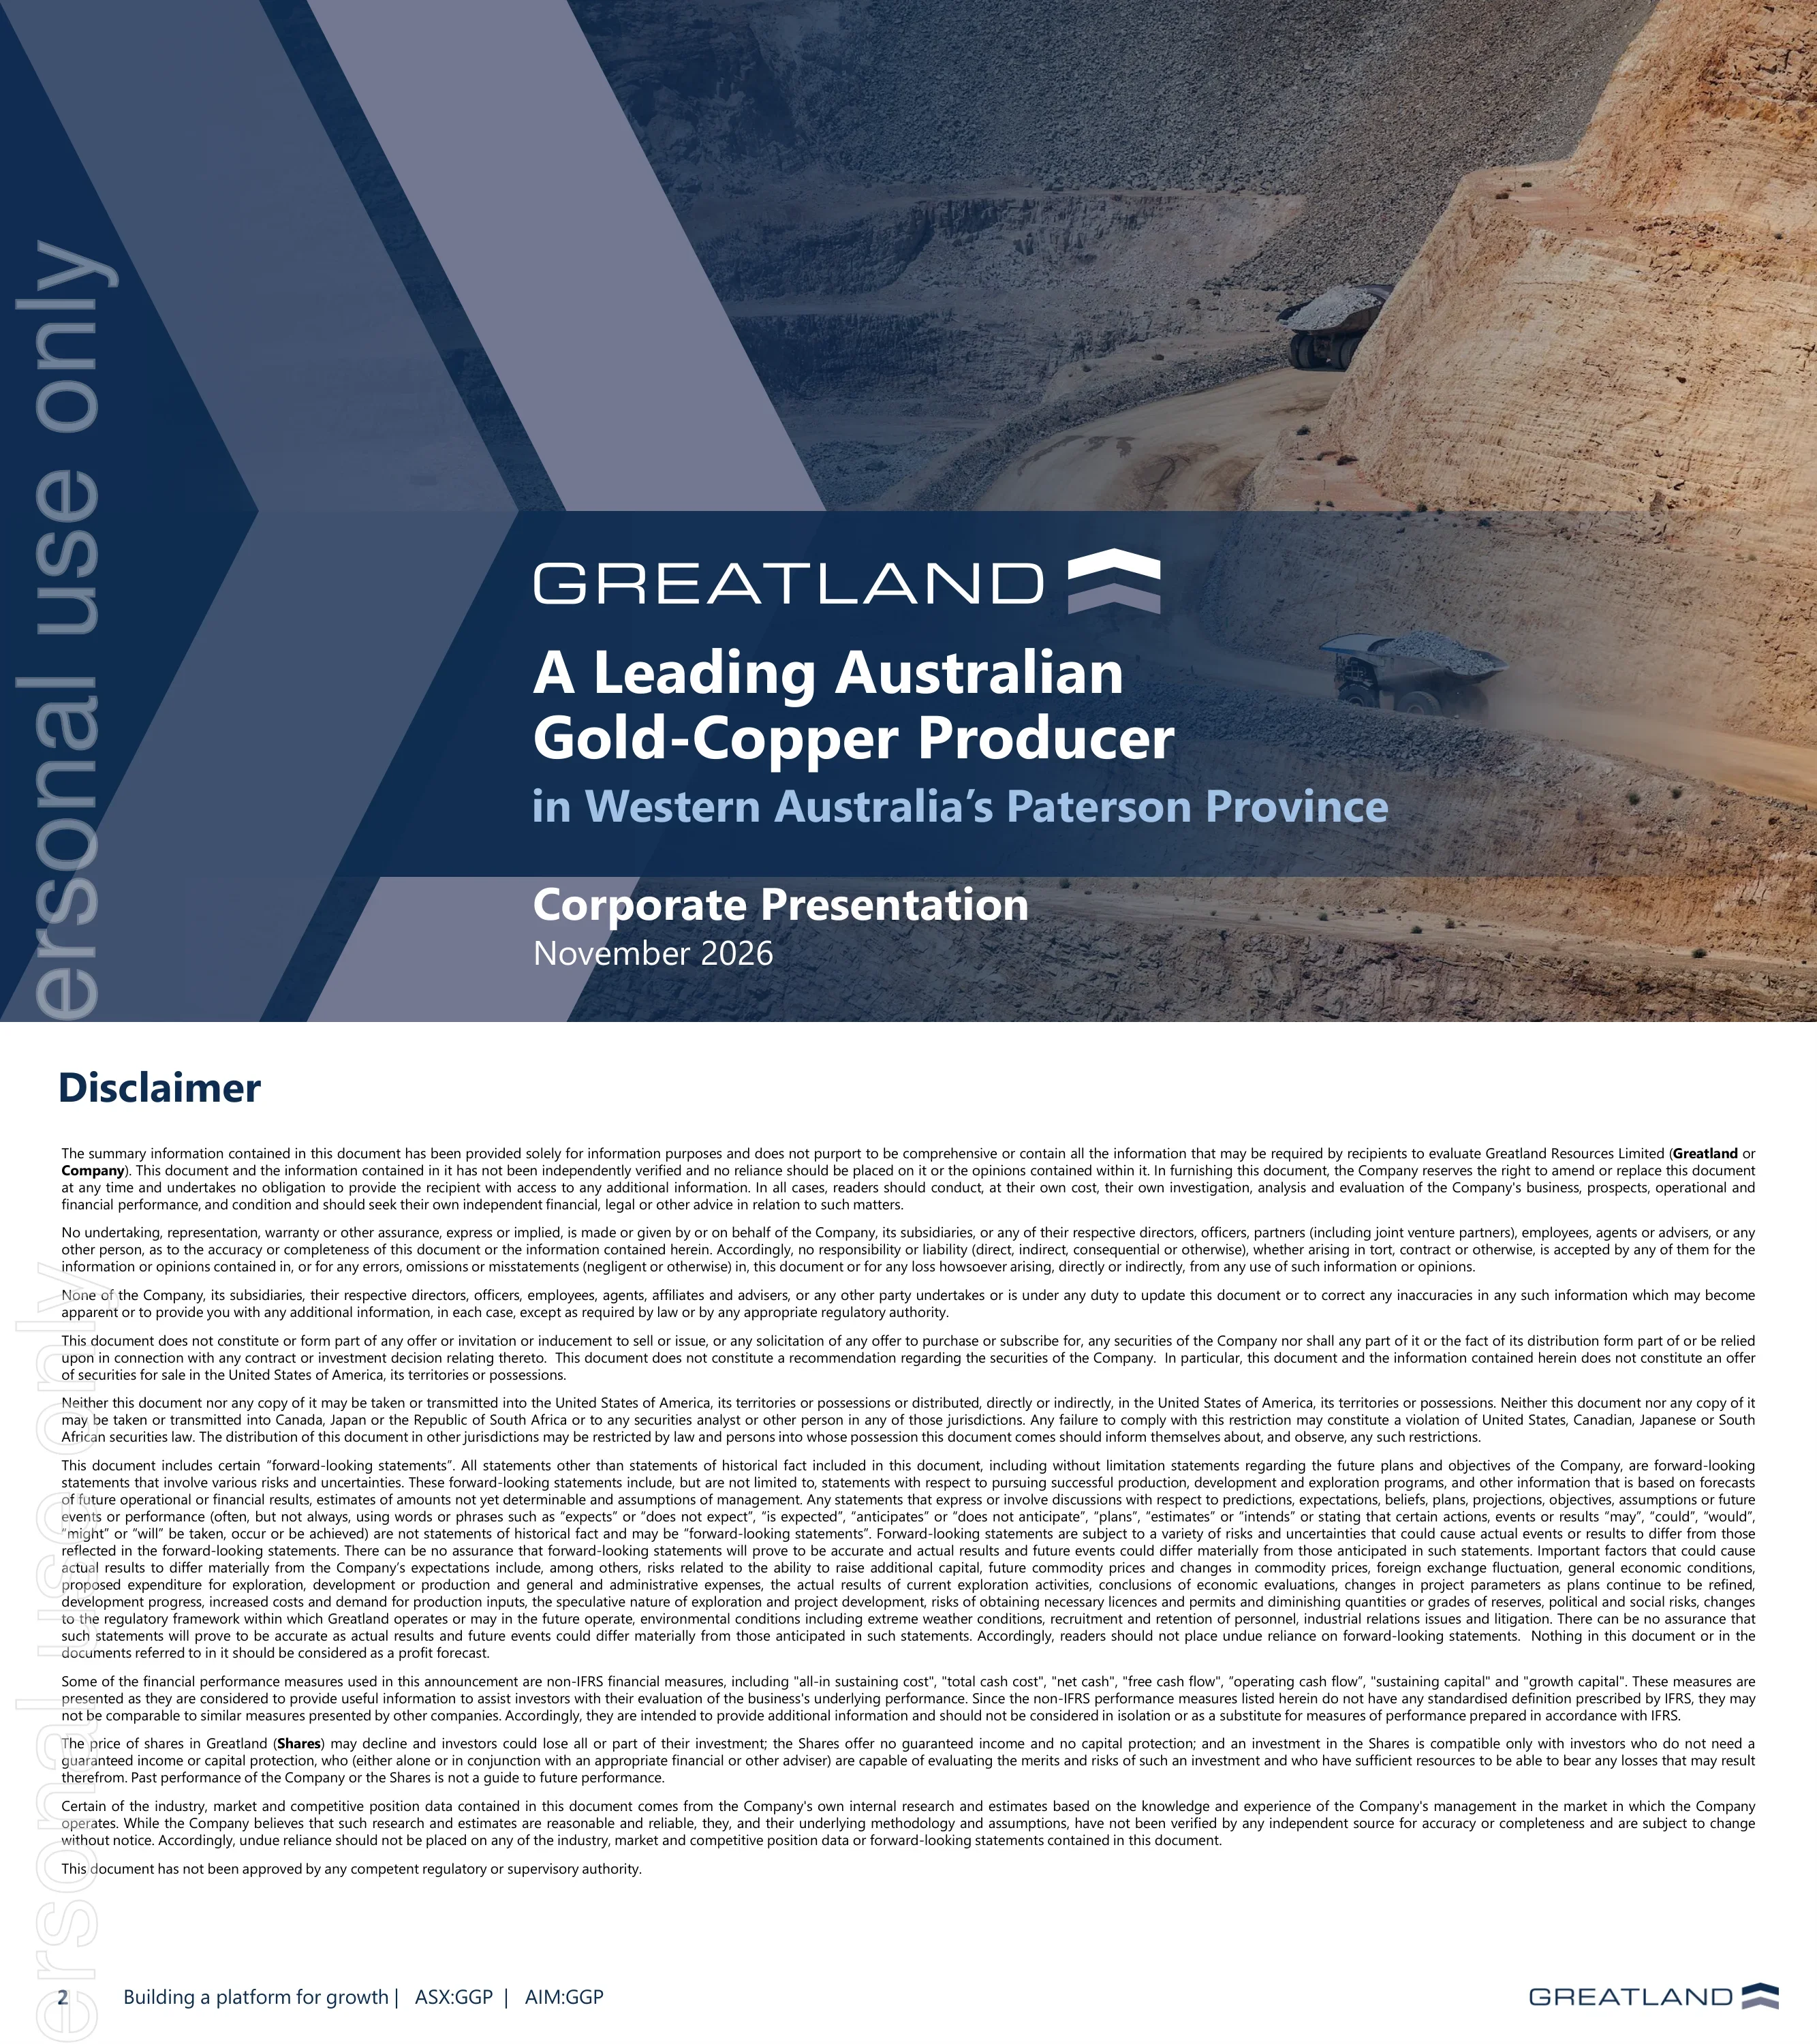
Title slide for Greatland's Corporate Presentation, November 2026, positioning the company as a leading Australian gold-copper producer in Western Australia's Paterson Province. Like every page, it carries the ASX 'for personal use only' watermark down the left edge (partly cut off).
Full-bleed open pit photograph with haul trucks, overlaid by navy and grey chevron shapes on the left and a translucent navy band holding the Greatland wordmark, title, subtitle and date.
Standard legal disclaimer: information is a summary and not independently verified; no offer of securities, especially in the United States; distribution restrictions for Canada, Japan and South Africa; forward-looking statements and their risks; use of non-IFRS measures such as all-in sustaining cost, net cash, free cash flow and growth capital; and the risk that share value may fall. Notes that the document has not been approved by any regulator.
Single dense full-width text block of justified paragraphs under a bold title, with the standard footer (page number, 'Building a platform for growth | ASX:GGP | AIM:GGP' and Greatland logo).
Explains that Havieron Feasibility Study (FS) data come from the 1 December 2025 ASX announcement and that the FS life-of-mine Production Target is underpinned by about 80% Probable Ore Reserves, 2% Indicated, 13% Inferred Mineral Resources and 5% Exploration Target, with only about 8% Inferred and 3% Exploration Target in the first eight years. Includes the cautionary statement on Inferred Resources, ASX Listing Rule 5.23 cross-references to the source announcements (Pinnacles exploration results, Telfer, Havieron and O'Callaghans resources and reserves), and states the presentation is dated 6 November 2026 and authorised by Managing Director Shaun Day.
Text-only page with blue sub-headings (Production Target - Havieron, ASX Listing Rule 5.23, Presentation) and a bulleted list of hyperlinked source announcements.
Section break introducing the company overview section.
Chevron-shaped photo panel of the illuminated Telfer processing plant at dusk on the left, solid navy field with large white section title on the right.
One-page snapshot. Greatland owns the Telfer mine and the nearby Havieron project in WA. September 2026 quarter: 70.1koz gold plus 2.9kt copper at $2,925/oz AISC, record open pit total material movement and record ore mined from open pit and underground. On track for FY27 guidance of 260-300koz Au, $2,900-3,330 AISC, $315-335m Telfer growth capital, $365-435m Havieron project spend and $70-80m drilling. Group Resource 14.9Moz Au and 644kt Cu; Reserve 5.0Moz Au and 196kt Cu. $1,314m cash and nil debt after September-quarter operating cash flow of $289m and a $25m cash build, giving $1,789m liquidity. A footnote states all '$' values are Australian dollars.
Six text blocks in a two-column grid separated by thin rules, each with a line icon, set over a darkened mine photo; a light-blue map of Western Australia on the right marks Port Hedland, Perth, Telfer mine and Havieron in the Paterson region.
Telfer, acquired by Greatland in December 2024, is described as an iconic WA gold-copper mine: established large-scale open pit and underground contract mining; 20Mtpa combined nominal processing capacity across dual 10Mtpa trains; produces gold doré and copper-gold concentrate with more than 15Moz cumulative production; 215km of drilling planned in FY27; Mineral Resource of 7.9Moz Au and 369kt Cu (31 December 2025) and Ore Reserve of 1.8Moz Au and 68kt Cu (31 March 2026). Banner: 3rd largest gold-copper processing infrastructure in Australia.
Ten-tile mosaic alternating navy text tiles (Mining, Processing, Production, Growth, Mineral Resource/Ore Reserve) with operational photographs, plus a grey banner along the bottom.
Havieron highlights from the 1 December 2025 Feasibility Study: initial mine life of 17+ years including 9 years of steady state; 3rd largest underground reserve in Australia; steady-state average AISC of $1,610/oz under the Havieron standalone scenario, with potential to fall if Telfer is extended and co-processed; life-of-mine production of 4.0Moz AuEq; ore processed through the Telfer mill, enabling a 'Telfer Hub' strategy; pre-production capex of $1,065m (mid-2025 base date) funded from $1,314m cash, a $475m debt facility and ongoing cash flows. Footnotes define AuEq (A$4,500/oz Au, A$15,747/t Cu, recoveries 86.6% Au and 84.4% Cu).
Same tile mosaic as the Telfer slide: navy text tiles (Long life, Lowest quartile cost, Large scale, Existing infrastructure, Funding) interleaved with underground and site photos, with a block of six footnotes below.
Capitalisation table at 5 November 2026: share price $10.83, 675m shares, market capitalisation $7.3bn, cash $1,314m, debt nil, net cash $1,314m, undrawn corporate debt facility $475m and total available liquidity $1,789m. 90-day average trading: ASX volume 1.75 (unit not shown on the slide) and value $19.2m; AIM volume 1.93m and value £11.2m. Top shareholders pie: Wyloo 18%, with Van Eck, State Street, BlackRock, Vinva and Vanguard each between 2% and 5%, and Other 64%. Broker coverage logos include Barrenjoey, Macquarie, Stifel, J.P. Morgan, Argonaut, Citi, Canaccord Genuity, UBS, RBC, Goldman Sachs, Global Mining Research, Bank of America and Jarden.
Left half holds a striped capitalisation table, an ASX vs AIM liquidity mini-table with exchange logos, a shareholder pie chart with legend and a grid of broker logos; the right half is a full-height photo of a conveyor and stockpiles.
Greatland joined the ASX in June 2025 and is now a substantial mid-cap Australian gold producer. A bar chart ranks ASX-listed gold companies by market capitalisation (A$bn, 5 November 2026): from Catalyst at 1.1 up to Ramelius at 7.1, Greatland at 7.3 (highlighted), then Perseus 8.4, Genesis 8.6, Evolution 26.9 and Northern Star 36.9 (the last two with broken axes).
Full-width vertical bar chart under a navy header bar, with company logos along the x-axis and Greatland's bar shaded light blue.
Two peer charts against ASX100 gold producers excluding Newmont. Six-year production and AISC CAGR: Greatland shows +9% production CAGR and -1% AISC CAGR, versus peers ranging from Regis (-6% production) to Capricorn (+16%). EV/FY27 EBITDA: Greatland 5.9x versus Regis 3.4x, Westgold 4.0x, Genesis 6.6x, Perseus 7.2x, Ramelius 7.8x, Evolution 7.9x, Northern Star 8.3x and Capricorn 10.5x. Data from S&P Visible Alpha and Cap IQ at 5 November 2026.
Two side-by-side horizontal bar charts under navy header bars: a diverging paired-bar chart on the left and a sorted single-series bar chart on the right, with Greatland highlighted in light blue.
Section break introducing the Telfer operating asset section.
Chevron-framed close-up photo of a grinding mill shell with bolts on the left, navy field with large white title on the right.
Bar chart of nominal processing capacity (Mtpa) for 29 Australian gold and gold-copper plants: Boddington 40.0, Cadia 32.0, Telfer 20.0, KCGM 13.0, Prominent Hill 10.0, down to Kanowna Belle 2.0. A call-out box notes Telfer is the only operating plant in the Paterson region, has two 10Mtpa trains with configuration flexibility, achieved a highest annual throughput of 23Mtpa in 2018, and can support the Telfer mine plan, Havieron and future regional opportunities.
Full-width descending vertical bar chart with rotated site names and owner logos beneath, a highlighted Telfer bar, and a rounded call-out box floating over the right side.
Scatter plot of FY26 processing cost (A$/t) against mill throughput (Mtpa) for ASX-listed Australian gold mines. Telfer sits alone at about 19 Mtpa and $17/t, versus a peer average of A$37/t; peers range from Bellevue (about $77/t at 1.2Mtpa) to KCGM (about $45/t at 10.3Mtpa). Subtitle: Telfer is the largest and lowest-cost processing facility among ASX-listed Australian gold mines.
Single scatter chart with labelled dots, a dashed horizontal average line and the Greatland logo next to the Telfer point.
Four charts contrasting prior ownership with Greatland ownership (from 4 December 2024). Gold recovery rose from 78.7% (FY21) to 88.6% (September 2025 quarter) and was 85.1% in the September 2026 quarter, with copper recovery at 82.5%. Safety: 12-month moving TRIFR fell from a peak of 14.1 (December 2024) to 3.7 (September 2026). Production and margin: quarterly gold production of roughly 70-91koz, with realised price rising from about A$2,770/oz (September 2022) to a peak of A$6,773/oz (March 2026) and A$5,980/oz in September 2026, while AISC was A$2,925/oz in the latest quarter. Open pit total material movement rose 79% from 4.4Mt (March 2025) to 7.9Mt (September 2026), with ore at 4.2Mt.
Four-quadrant dashboard: line chart (recovery), column chart (TRIFR), combo column-and-line chart with dual axis (production, price, AISC) and stacked column chart (ore and waste), each with a shaded 'prior ownership period' zone.
Telfer growth capital guidance of $315-335m to extend and grow Telfer. A matrix shows when five investment areas deliver benefit across FY27, FY28, FY29 and FY30+: additional purchase and refurbishment of open pit fleet; underground growth development including West Dome Underground early works; paste infrastructure and power station upgrades; underground project studies (West Dome Underground and Vertical Stockwork Corridor); and TSF8 Stage 4 and Stage 5 tailings lifts.
Heat-map style table: rows with icons and investment descriptions, columns by fiscal year, cells shaded light blue (partial benefit) or dark blue (substantial benefit), with a legend at bottom right.
Two waterfall charts. Group Resource grew from 7.6Moz Au at acquisition (December 2024: Telfer 0.6, Havieron 7.0) by +2.6Moz (March 2025 MRE) and +4.8Moz (March 2026 MRE) to 14.9Moz today (Telfer 7.9, Havieron 7.0), a 96% increase in 16 months. Group Ore Reserve grew from 2.4Moz at acquisition by +0.7Moz (April 2025 initial Telfer reserve), +0.9Moz (December 2025 Havieron FS) and +1.1Moz (June 2026 update) to 5.0Moz (Telfer 1.8, Havieron 3.3), a 108% increase, which the slide describes as 15 months post-acquisition.
Two stacked horizontal-band waterfall charts with prior-ownership shading, floating increment bars, stacked end bars and a right-hand annotation of percentage uplift.
A West Dome long section shows that converting Inferred resources within the reserve shell, currently treated as waste, could add 42% more gold, alongside 3D views of the West Dome Underground December 2025 resource. Ore Reserve table: Telfer total 118.7Mt at 0.46g/t Au and 0.06% Cu for 1.8Moz and 68kt Cu; Havieron 38.5Mt at 2.63g/t and 0.33% for 3.3Moz and 128kt; Group 157.2Mt at 0.99g/t for 5.0Moz and 196kt Cu. Mineral Resource table: Havieron 131Mt at 1.65g/t for 7.0Moz and 275kt Cu; Telfer total 417Mt at 0.59g/t for 7.9Moz and 369kt Cu (West Dome Open Pit 4.9Moz, Main Dome UG 0.8Moz, VSC 1.3Moz, West Dome UG 0.6Moz, stockpiles 0.3Moz); Group 549Mt at 0.84g/t for 14.9Moz and 644kt Cu.
Top row of three technical images (long section and two 3D orebody models); bottom row of two dense navy-and-white data tables (Ore Reserve left, Mineral Resource right).
3D schematic of Telfer targets: (1) West Dome Open Pit, aiming to expand the Stage 7 cutback and potentially extend Stage 2; (2) West Dome Underground, with a maiden resource area of 8Mt at 2.3g/t Au and 0.44% Cu for 0.6Moz and 35kt Cu (study underway); (3) Main Dome Underground targets including A-Reefs, M-Reefs, Rey, LLU, ESC and Kylo. Also shows the VSC resource area (38Mt at 1.1g/t Au and 0.33% Cu for 1.3Moz and 125kt Cu) and the Pinnacles discovery hole WRC14503A: 58.7m at 6.5g/t Au and 0.1% Cu from 1,754m, including 37.0m at 9.98g/t Au. Bar chart of drilling by year: 98km (FY21), 80, 104, 94, 112, 231km (FY26) and 215km planned for FY27 (73km completed).
Large 3D mine model with numbered targets and boxed callouts occupying most of the slide; numbered target descriptions in the top-right; a small drilling-by-year column chart in the bottom-right.
Section break introducing the Havieron development project section.
Chevron-framed photo of the Havieron box-cut decline portal under a blue sky, navy field with white title.
Feasibility Study physicals. Life of mine: 50.3Mt ore mined over 17+ years at 2.52g/t Au and 0.30% Cu (2.84g/t AuEq), producing 3.53Moz Au and 130kt Cu. Steady state: 3.9Mtpa over 9 years at 2.47g/t Au and 0.29% Cu (2.77g/t AuEq), producing 266koz Au and 9.6kt Cu a year. Ore Reserve 38.5Mt (+55%) containing 3.3Moz Au (+36% versus the March 2022 estimate), described as the 3rd largest Australian underground gold reserve. One footnote quotes a LOM copper recovery of 84.0% while the AuEq footnote uses 84.4%.
Four labelled rows (Ore Mined, Grade Processed, Metal Produced, Ore Reserve) with icons on the left and slanted light-blue parallelogram data boxes under two gold column headers (LOM and Steady State), over a dark photo background.
Feasibility Study economics under the conservative 'Havieron Standalone' operating cost model (no Telfer life extension). At a A$4,500/oz long-term gold price: post-tax unlevered free cash flow $5.4 billion, NPV(5%) $2.9 billion, IRR 22.5%, payback 4.2 years. At A$6,250/oz gold: free cash flow $9.6 billion, NPV $5.4 billion, IRR 31.5%, payback 3.2 years. Base case uses consensus gold prices to FY31 then A$4,500/oz, and copper at US$5/lb (A$15,747/t).
Two-column comparison of four metrics (rows) under two gold price-case headers, using the same slanted parallelogram boxes over a dark photo background.
Left chart: Australian undeveloped gold projects by resource (Moz AuEq) with grade markers: Hemi 13.2Moz at 1.4g/t, Havieron 8.0Moz at 1.9g/t AuEq, Bullabulling 6.2Moz, Rebecca-Roe 3.2Moz, down to Tower Hill 1.6Moz. Right chart: nominal processing plant throughput, with Telfer's 20.0Mtpa third after Boddington (40.0) and Cadia (32.0). An arrow links Havieron to Telfer to show the pairing.
Two horizontal bar charts side by side under navy header boxes, with yellow diamond grade markers on the left chart, owner logos beside each bar, and a light-blue arrow connecting the highlighted Havieron and Telfer rows.
Australia's largest underground gold mine reserve outside a major, estimated at a conservative A$2,500/oz gold price. Columns show Moz AuEq for Australian underground reserves: Cadia 24.7 (axis break), Tanami 5.1, Havieron 3.7 (2.98g/t AuEq), KCGM Underground 3.4, St Ives 3.0, Granny Smith 2.6, Cowal 1.7, Fosterville 1.7, Beta Hunt 1.6, Never Never 1.6 (7.32g/t), through to Carosue Dam 0.4. Yellow diamonds plot grade on a right-hand axis.
Wide combo chart: dark columns for contained ounces with Havieron in light blue, yellow diamond markers for grade on a secondary axis, rotated site names and owner logos along the bottom.
Havieron would use about 70% of Train 1 (about 7Mtpa, or 35% of the 20Mtpa total) because it needs a finer grind, leaving about 13Mtpa for Telfer feed. FS standalone costs per tonne are much higher than Telfer's FY26 actuals: processing $36.64/t vs $16.95/t, site services $10.50/t vs $5.73/t, sustaining $9.70/t vs $5.42/t. If a Telfer Hub is achieved, Havieron's AISC could be lower through fixed-cost dilution, consolidated site activities and shared sustaining costs (shown with $$$, $$, $ indicators). The slide states the financial outcomes of this scenario are not presented.
Top band: explanatory text on the left and a split pie illustrating the Train 1 and Train 2 split (7Mtpa Havieron vs 13Mtpa Telfer). Bottom band: three pairs of comparison columns under navy headers, each with a dashed explanatory box and dollar-sign intensity markers.
Sub-level open stoping with paste backfill, 50m sub-levels and average stopes of about 100kt across 12 independent mining sequences. Main decline is about 75% complete (2,129m done, 781m remaining as at 1 December 2025); conveyor decline development to start from three underground positions. Ore is trucked during ramp-up, then conveyed via an underground crusher and materials handling system allowing up to 4.5Mtpa. A 3-year ramp-up is followed by a 9-year steady state averaging 3.9Mtpa, and a 17+ year LOM of 50.3Mt at 2.52g/t Au and 0.30% Cu for 3.53Moz Au and 130kt Cu.
Left: long-section schematic of declines, ventilation raises, transfers and the blue mining-inventory stopes below the Permian/basement contact, with a legend. Right: five navy label boxes (Development, Mining Method, Ore Haulage, Ramp-up & Steady State, Production) each paired with a bulleted panel.
Havieron development is expected to be fully funded from cash, Telfer cash flow and the A$475 million corporate debt facility. (1) Cash $1,314m and nil borrowings at 30 September 2026. (2) Telfer generated a $1.2B cash build in 21 months; quarter-end cash rose from $145m (31 December 2024) to $398m, $575m, $750m, $948m, $1,208m, $1,289m and $1,314m (30 September 2026). (3) Syndicated facilities with five Tier-1 banks (ANZ, ING, HSBC, Westpac, NAB): $250m 5-year RCF Facility A, $225m 7-year RCF Facility B and a $25m contingent instrument facility. Ticks note greater flexibility than project finance, tenor up to 7 years, facilities right-sized to $500m from $775m, attractive pricing and no mandatory hedging.
Three numbered navy panels: cash position (top left), a waterfall-style column chart of quarter-end cash and quarterly build (bottom left), and a large corporate debt panel (right) with bank logos and five tick-box benefit cards.
O'Callaghans is a 100%-owned polymetallic skarn deposit (tungsten, copper, zinc, lead) about 10km south of Telfer, roughly 300m below surface, with a mineralised layer up to 60m thick. Described as globally significant and the most significant tungsten deposit in Australia by scale and grade, sitting within Greatland's approved mining lease; a 2014 Newcrest pre-feasibility study showed a viable long-life underground operation. 2025 Mineral Resource: 70Mt at 0.35% WO3 for 246kt WO3, plus 207kt copper, 371kt zinc and 182kt lead. A bubble chart compares global tungsten deposits by grade and contained WO3; the note cites source material on 'slide 47', although the deck has 46 slides (the sources are on slide 46).
Left column of three navy label boxes (Deposit overview, Global significance, Strategic positioning) with beige text panels; right side has a resource table above a bubble chart of tungsten deposits.
Five catalysts across H1 and H2 FY27: (1) Drilling - more Pinnacles and West Dome UG results, and 3 surface rigs testing the more than 1km WDU-Pinnacles trend from January 2027; (2) Resource - Telfer MRE update covering West Dome UG (10-15km of new drilling), West Dome OP cutbacks and Main Dome OP; (3) Studies - West Dome Underground 'Phase 1' study for a new high-grade underground mine and a Vertical Stockwork Corridor sub-level cave restart study; (4) Reserves - possible maiden West Dome UG and VSC reserves, and converting 42% more gold from Inferred material in the West Dome OP pit shell; (5) O'Callaghans - strategic review with all options open, including spin-out/IPO, partial or full divestment, or JV/partnership. Timing is indicative only.
Timeline arrows for H1 and H2 FY27 across the top, five numbered column headers below, each with a bulleted text column, over a faded plant photograph.
Summary of the investment case in five pillars: Production - Telfer is a top 10 Australian gold-copper asset with significant life-extension opportunity; Mine life - Havieron expected to become a leading long-life, low-cost gold-copper mine alongside Telfer; Infrastructure - leveraging Telfer's regionally significant processing plant; Funding - available liquidity of $1.8b including $1.3b cash; Growth - lifting high-grade underground output via Havieron and West Dome Underground and continuing the record drill program.
Five equal navy cards with white line icons and headings arranged in a row over an open pit photograph.
Closing contact slide with info@greatland.com.au, the greatland.com.au website and X and LinkedIn icons. The text layer also contains a stray image caption that is not visible on the slide.
Mirror of the cover design: chevron graphics on the left, translucent navy band with logo and contact details over a wide photo of the Telfer plant and conveyors.
Executive team: Shaun Day (Managing Director, ex-CFO of Northern Star), Nick Strong (COO), Otto Richter (CTO), Monique Connolly (CFO, ex-ConocoPhillips and Santos), Rowan Krasnoff (Chief Development Officer, ex-Fortescue), Damien Stephens (Group Geologist), Matt Kwan (General Counsel), Ben Secrett (Company Secretary and Head of Sustainability) and Andrew Bowler (Head of Investor Relations, ex-Macquarie analyst). Board: Mark Barnaba (Non-Executive Chairman; Deputy Chairman of Fortescue, Chairman of AirTrunk, former RBA board member), Elizabeth Gaines (Deputy Chair, former Fortescue CEO), Jimmy Wilson (ex-BHP), Paul Hallam (ex-Fortescue and Newcrest), Alex Borrelli and Yasmin Broughton.
Split slide: navy left half lists executives with headshots, names, titles and two bullets each; white right half lists board members in the same format.
Two tables of technical leaders with prior roles and years of experience: Nick Strong (COO, 25+), Otto Richter (CTO, 25+, former Telfer planning manager), Mark Benson (GM Telfer, 25+), Shaun McLoughney (Havieron UG Manager, 30+), Damien Stephens (Group Geologist, 25+), Michael Thomson (Principal Geologist, 25+), David Fielder (Havieron Project Manager, 20+) and Chris Pyke (Project Manager, 30+). Prior employers include Northern Star, Rio Tinto, Newcrest, Resolute, Primero, Sandfire and Creasy Group.
Two side-by-side four-row tables with photo, name, Greatland position, prior roles and years of experience columns, under a navy banner subtitle.
FY27 guidance from the June 2026 quarterly: gold production 260-300koz Au, modestly second-half weighted, with a 15-day plant maintenance shutdown completed in the September quarter; AISC $2,900-3,330/oz, with Q1 FY27 slightly better than plan. Growth capex: Telfer $315-335m (fleet renewal, underground development, power and paste plant upgrades, WDU and VSC studies, tailings capacity into FY29) and Havieron $365-435m (pre-production phase, first gold about 2.5 years from construction start). Exploration and resource development $70-80m.
Five guidance blocks over a dark mine photo: two top blocks (Gold Production, AISC) with icons, and three bottom blocks (Telfer, Havieron, Exploration) under a 'Growth Capex' heading, each with a rule, a large figure and an italic note.
Pre-production capex of A$1,065m (mid-CY25 estimate) delivers a single-decline trucking operation: underground development and infrastructure 43%, surface infrastructure and utilities 22%, plant 19% and indirects 16%; components include mining 234, mining infrastructure and ventilation 218, processing plant and tailings 203, contingency 105, haul road 89, utilities 90, owner's cost 68 and non-mining infrastructure 57 (A$m). It includes a combined 14.5% contingency and growth allowance. Expansion capex of A$673m delivers a second decline with conveyor haulage: 86% underground (360 mining infrastructure and 218 mining), 6% surface and 8% indirects.
Two donut-in-ring charts side by side: an inner pie of component values (A$m) and an outer ring showing category percentages, with a shared legend and a highlighted callout box.
Cost curve of ASX-listed Australian gold mines (FY26 actual AISC against cumulative production). Steady-state Havieron (266koz a year at A$1,610/oz) would sit at the lowest-cost end of the curve, and Telfer's FY26 actual AISC is A$2,179/oz; the curve rises to about A$3,500/oz at about 4,600koz cumulative production. Tropicana is shown on a 30% attributable basis.
Single wide step-style cost curve with grey peer blocks and Havieron and Telfer highlighted in light blue with labels and Greatland chevron marks.
Havieron annual profile from pre-production years PP0-PP2 through year 17. Mining chart: ore and waste tonnes ramping to about 4.0-4.7Mt in years 4-11, with ore-mined grade mostly 2.3-3.0g/t Au, truck haulage switching to conveyor haulage, and pre-production versus expansion capital periods marked. Production chart: gold output of roughly 250-290koz a year in the steady state (years 4-12, averaging 266koz) at an average standalone AISC of A$1,610/oz, declining after year 12. Callouts note upside from residual resources outside the mine plan; these cross-reference 'slide 36' and 'slide 37' (the residual-resource slide is 37).
Two stacked full-width combo charts (Mining and Production) under navy banner headers, each with a shaded steady-state window, haulage icons on the bars and a dual axis.
Significant Mineral Resources remain outside the FS life-of-mine inventory. An ounces-per-vertical-metre (OPVM, AuEq) profile by level is set beside a 3D orebody model showing the Ore Reserve, mining inventory outside reserve, and Indicated and Inferred resources. Residual resource table: Indicated 15Mt at 1.30g/t Au and 0.19% Cu (0.62Moz, 29kt Cu); Inferred 72Mt at 0.87g/t and 0.13% (2.03Moz, 93kt); total 87Mt at 0.95g/t and 0.14% for 2.6Moz Au and 122kt Cu.
Left: horizontal OPVM bar profile with green total-resource curve beside a coloured 3D block model; right: a navy-headed residual resource table and two legends.
Tenement map of the Paterson region showing Greatland's 100% holdings, the Greatland-Rio Tinto Paterson South JV and neighbouring holders (Cyprium, Rio Tinto, Antipa, Encounter, Rincon) around Telfer, Havieron, O'Callaghans, Minyari, Nifty, Winu and others, with a 60km radius ring. Key points: an exploration portfolio of more than 2,000km² within 60km of Telfer; Telfer is the only operating process plant in the Paterson, supporting a 'hub and spoke' strategy; and 2 x 10Mtpa processing capacity.
Large tenement map with legend and scale on the left; three tick-marked label boxes with explanatory text on the right.
Full JORC 2012 tables. Mineral Resource: Havieron 131Mt at 1.65g/t Au and 0.21% Cu (7.0Moz, 275kt); Telfer 417Mt at 0.59g/t and 0.09% (7.9Moz, 369kt); Greatland total 549Mt at 0.84g/t and 0.12% (14.9Moz Au, 644kt Cu), split Measured 2.7Mt, Indicated 232Mt (8.1Moz) and Inferred 314Mt (6.8Moz). Ore Reserve: Telfer 118.7Mt at 0.46g/t (1.8Moz, 68kt), Havieron 38.5Mt at 2.63g/t (3.3Moz, 128kt), Group 157.2Mt at 0.99g/t (5.0Moz, 196kt). Footnotes give reporting dates and cut-off price assumptions (for example A$4,200/oz Au for the Telfer MRE and A$2,500/oz for the Havieron reserve); the small print is summarised here rather than reproduced.
Two dense full-width data tables (Table 1 Mineral Resource, Table 2 Ore Reserve) with navy headers and a long block of small-print footnotes.
Source table for the processing-capacity comparison: 29 plants with owner, milling capacity and source document, from Boddington (Newmont, 40.0Mtpa) and Cadia (Newmont, 32.0Mtpa) through Telfer (Greatland, 20.0Mtpa) and KCGM (Northern Star, 13.0Mtpa) to Kanowna Belle (Northern Star, 2.0Mtpa).
Single four-column table (Asset, Company, Milling Capacity, Source) with a navy header and the Telfer row highlighted.
Source table for the FY26 processing cost comparison: company, site, processing cost (A$/t), throughput (Mtpa), total processing cost (A$m) and source ASX quarterly. Greatland's Telfer: A$16.9/t, 19.2Mtpa, A$325.3m. Peers include KCGM (A$44.8/t, 10.3Mtpa), Cowal (A$23.5/t, 7.8Mtpa), Duketon (A$28.6/t, 8.1Mtpa) and Bellevue (A$76.7/t, 1.2Mtpa).
Single six-column table with navy header, Telfer row highlighted.
Source table for undeveloped projects: tonnes, gold grade, contained gold, contained copper, total AuEq ounces and grade, with source announcement. Hemi (Northern Star) 295.4Mt at 1.4g/t for 13.2Moz; Havieron (Greatland) 131.0Mt at 1.7g/t, 7.0Moz Au and 275kt Cu for 8.0Moz AuEq at 1.9g/t; Bullabulling 6.2Moz; Rebecca-Roe 3.2Moz; Minyari 3.0Moz AuEq (implied); and others down to Tower Hill 1.6Moz.
Dense nine-column table with navy header, Havieron row highlighted, AuEq columns in bold.
Source table for the underground reserve comparison: Cadia (Newmont) 1,052Mt, 14.1Moz Au and 3,100kt Cu for 24.7Moz AuEq at 0.73g/t; Tanami 5.1Moz at 5.31g/t; Havieron 39Mt at 2.6g/t, 3.3Moz Au and 128kt Cu for 3.7Moz AuEq at 2.98g/t; KCGM 3.4Moz; St Ives 3.0Moz; Granny Smith 2.6Moz at 6.48g/t, through to Carosue Dam 0.4Moz. Sources are ASX, NYSE and JSE announcements.
Dense eight-column table with navy header and Havieron row highlighted.
Source table for the cost curve: Kalgoorlie (Northern Star) 848koz at A$2,579/oz; Yandal 436koz at A$3,198/oz; Telfer FY26 actual 329koz at A$2,179/oz; Cowal 297koz at A$2,253/oz; Havieron (FS steady state) 266koz at A$1,610/oz; Karlawinda 124koz at A$1,629/oz; Davyhurst 141koz at A$3,496/oz; through to Norseman 77koz at A$3,213/oz. Tropicana is shown at Regis's 30% share.
Five-column table (Mine, Company, Production, AISC, Source) with navy header and the Telfer and Havieron rows highlighted.
Price decks behind the FS economics. Base case: gold A$5,000/oz (FY28-FY29), A$4,800 (FY30), A$4,554 (FY31) and A$4,500 long term (FY32+); copper A$16,306/t falling to A$15,747/t; AUD:USD 0.68 rising to 0.70. Spot case: gold A$6,250/oz, copper A$16,959/t and AUD:USD 0.65 in all years.
Two small tables (base case and spot case) with fiscal-year columns and light-blue row labels, occupying the upper-left of an otherwise white slide.
Source table for the tungsten bubble chart: 26 deposits with owner, tonnage, WO3 grade, contained WO3 and a hyperlink. Hemerdon (Tungsten West) 327Mt at 0.12% for 409kt; Northern Dancer (Largo) 425Mt at 0.10% for 405kt; Mactung (Fireweed) 54Mt at 0.70% for 374kt; Sangdong (Almonty) 59Mt at 0.44% for 259kt; O'Callaghans (Greatland) 70Mt at 0.35% for 246kt, ranking eighth by contained metal; down to Currais Novos at 5kt.
Six-column table with navy header, O'Callaghans row highlighted and a 'Link' column of hyperlinks.
Συχνές ερωτήσεις σχετικά με αυτή τη διαφάνεια και το βασικό περιεχόμενο παρουσίασης.
It is the 46-slide 'Corporate Presentation - November 2026' that Greatland Resources Limited lodged with the ASX (ticker GGP, also traded on AIM). It covers the company overview, the Telfer gold-copper mine, the Havieron development project, funding, the O'Callaghans tungsten deposit, FY27 catalysts and a data appendix.
All '$' figures are Australian dollars (A$) unless stated, so $1,314m cash means A$1,314 million. Greatland's financial year runs July to June, as is usual in Australia: FY26 covers July 2025 to June 2026, and FY27 covers July 2026 to June 2027.
September 2026 quarter: 70.1koz gold and 2.9kt copper at an AISC of $2,925/oz. FY27 guidance: 260-300koz gold at $2,900-3,330/oz AISC. Balance sheet at 30 September 2026: $1,314m cash, nil debt and $1,789m total liquidity. Group Mineral Resource: 14.9Moz Au and 644kt Cu. Ore Reserve: 5.0Moz Au and 196kt Cu. Market capitalisation: about $7.3bn at 5 November 2026.
Under the conservative Havieron Standalone case at a A$4,500/oz long-term gold price, the deck shows post-tax free cash flow of $5.4 billion, an NPV(5%) of $2.9 billion, an IRR of 22.5% and a 4.2-year payback. At A$6,250/oz gold these rise to $9.6 billion, $5.4 billion, 31.5% and 3.2 years. Steady-state output is 266koz gold a year at an average AISC of $1,610/oz over a 17+ year mine life.
Yes. It shows a complete structure for a producer with a development project: a highlights page, asset 'at a glance' tile mosaics, peer benchmarking (market cap, processing capacity, cost curves, EV/EBITDA), resource and reserve waterfalls, Feasibility Study physicals and economics, a funding slide, a catalyst timeline, team slides and source appendices.
Slide 3 explains that the Havieron Production Target includes about 13% Inferred Mineral Resources and 5% Exploration Target over the mine life, carries the standard cautionary statement, and lists the ASX announcements that the resource and reserve figures come from. Slide 39 reproduces the full JORC 2012 Mineral Resource and Ore Reserve tables. The footnotes are summarised on this page rather than reproduced word for word.
Yes. The original PDF is available, along with an editable PPTX converted from it. The PPTX is machine-converted, so complex charts, 3D mine models and maps may appear as images rather than editable chart objects.
The presentation was lodged with the Australian Securities Exchange under the title 'Corporate Presentation - November 2026' and can be found on the ASX announcements page for GGP. It is dated 6 November 2026 and was authorised for release by Managing Director Shaun Day.
ASX announcements page for Greatland Resources, where 'Corporate Presentation - November 2026' was lodged.

Create Your Own Slides
Turn your ideas into professional presentations in seconds with 2slides AI.
Αναφερθείτε σε επαγγελματικές σχεδιάσεις, επιλέξτε το στυλ σας και δημιουργήστε σλάιντ με τέλεια απόδοση κειμένου. Τροφοδοτείται από το Nano Banana—ξεκινήστε να δημιουργείτε την παρουσίασή σας τώρα.
Ο Πράκτορας AI σας για διαφάνειες. Εξοικονομήστε χρόνο, λάμψτε πιο γρήγορα με έξυπνη δημιουργία παρουσιάσεων.


© 2026 2slides. Όλα τα δικαιώματα διατηρούνται.