
State of AI in the Enterprise 2026: The Untapped Edge - Deloitte Annual Report
Γρήγορη Πλοήγηση
Ετικέτες
Κοινοποίηση διαφανειών
State of AI in the Enterprise 2026: The Untapped Edge - Deloitte Annual Report
Λεπτομερής προβολή κάθε σελίδας διαφάνειας, συμπεριλαμβανομένης της διάταξης, βασικού περιεχομένου και οπτικών στοιχείων.
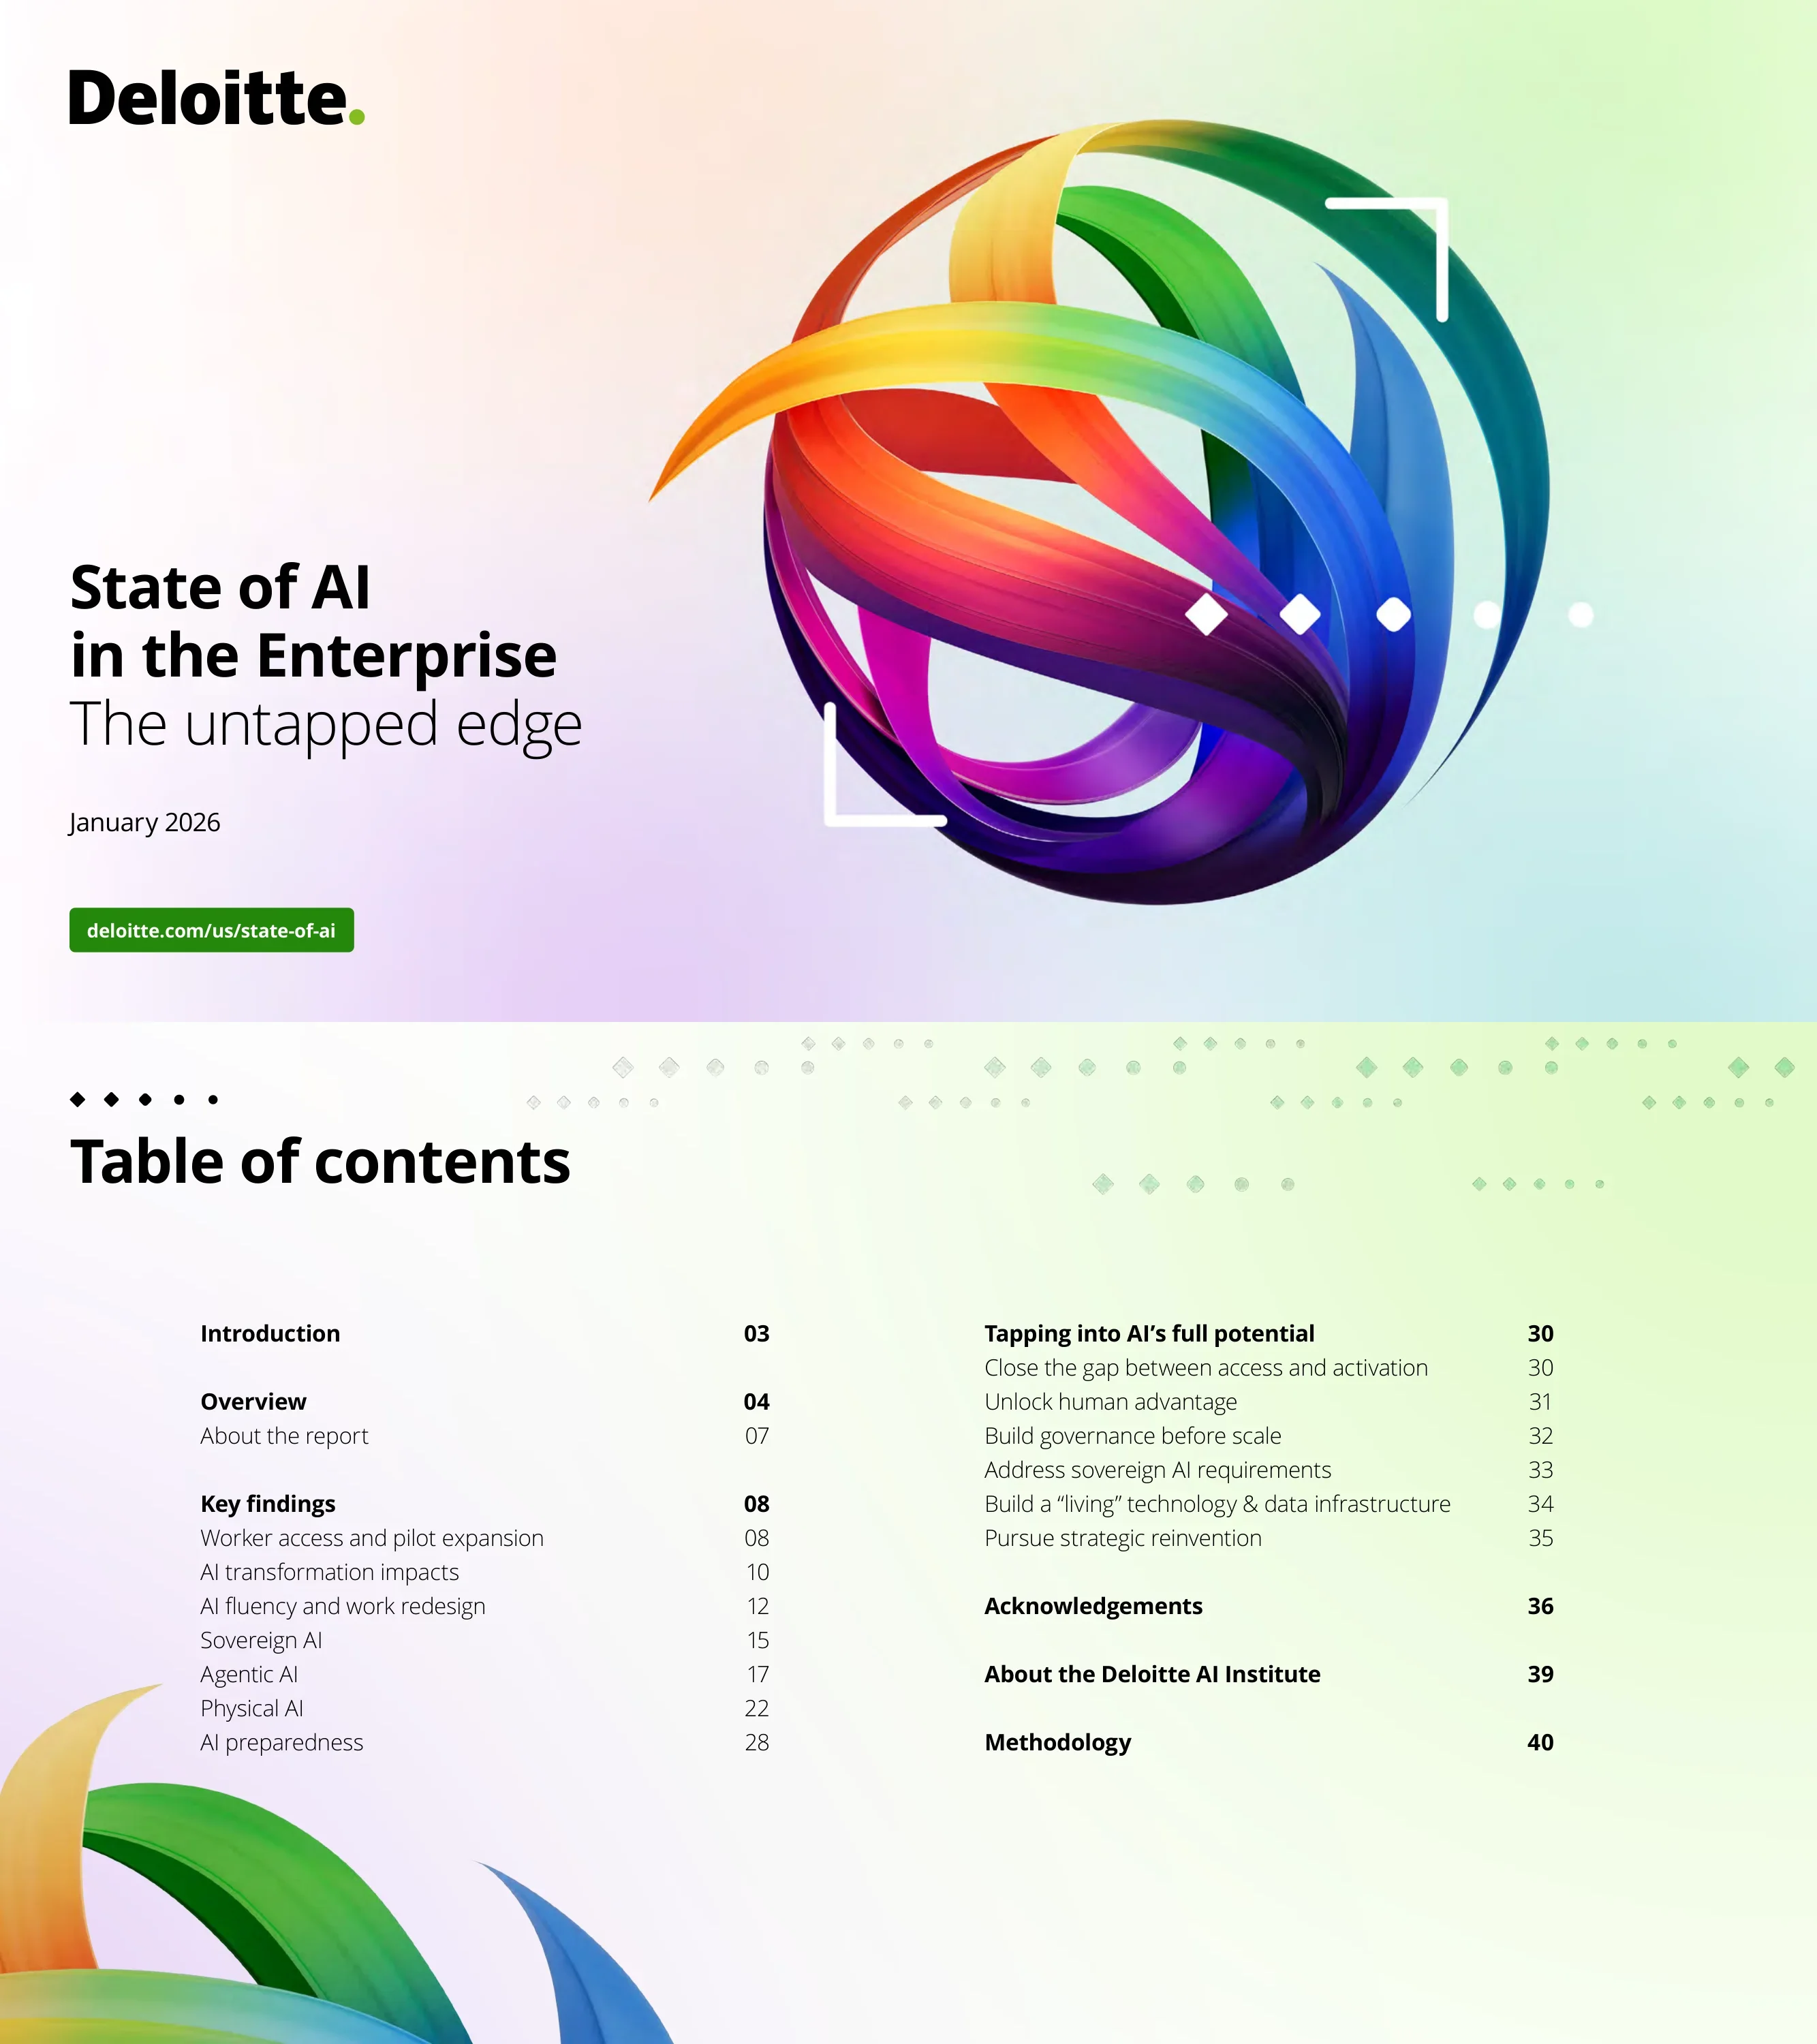
Title slide for Deloitte's annual State of AI in the Enterprise report, dated January 2026, with the subtitle 'The untapped edge'
Full-width title slide with Deloitte logo top-left, title text bottom-left, and a large colorful abstract 3D sphere graphic on the right
Structured table of contents listing all major sections: Introduction (3), Overview (4), Key Findings (8), Tapping into AI's Full Potential (30), Acknowledgements (36), Methodology (40)
Two-column layout with section titles and page numbers, decorative diamond pattern border, colorful wave graphics at bottom
Sets the stage for the report discussing how AI is transforming work and business, emphasizing the gap between experimentation and true enterprise transformation. Highlights sovereign AI, agentic AI, and physical AI as key trends reshaping the future.
Three-column text layout with section header, decorative abstract purple swirl graphic in upper right
Summarizes key findings: AI moving from pilot to enterprise scaling with 50% worker access expansion; 34% of companies deeply transforming with AI; 30% redesigning key processes; 37% using AI at surface level only
Left column with overview text, center and right columns with two highlighted finding sections in green headers
84% of companies haven't redesigned jobs around AI capabilities; 77% say location of AI development is a key factor when choosing new technologies. Highlights the gap between AI fluency focus and actual work redesign.
Two-column finding layout with large 77% statistic callout at bottom, photo of professional working with technology on right
74% of companies plan to deploy agentic AI within two years, but only 21% have mature governance. Physical AI is used by 58% of companies, projected to reach 80% within two years. Manufacturing, logistics, and defense lead adoption.
Two-column layout with findings, large 74% statistic callout at bottom, industrial worker with laptop photo on right
42% of companies believe their strategy is highly prepared for AI adoption. Report surveyed 3,235 director-to-C-suite respondents across six industries and 24 countries (Aug-Sep 2025). Complemented by 15 executive interviews.
Two-column layout with left finding text and 42% callout, right column with 'About the Report' box and methodology details, professional photo center
Workforce access to AI expanded 50% in one year (from under 40% to around 60%). Only 25% moved 40%+ of AI experiments into production to date, but 54% expect to reach that level within 3-6 months.
Three-column layout with section introduction left, scale acceleration text center, and Figure 1 donut charts right showing production deployment percentages
Explains why pilots fail to reach production: fundamental mismatch between pilot and production requirements. Warns of 'pilot fatigue' and vicious cycle of funding new pilots without clear value realization.
Three-column text layout with large green quote callout at bottom about coherent AI strategy
25% of leaders report transformative AI impact (up from 12% a year ago). 84% increasing AI investments. Figure 2 shows benefits achieved today vs. hoped to achieve across efficiency, decision-making, costs, client relationships, products/innovation, and revenue.
Left column with transformation stats, center-right with Figure 2 bar chart comparing 'Achieving today' vs 'Hope to achieve' across six benefit categories
34% pursuing deep transformation of products/processes/business models; 30% redesigning key processes; 37% surface-level use. Features case study of mining company embedding AI for market disruption.
Three-column layout with text, case study quote, and Figure 3 donut chart showing current approach breakdown
36% of companies expect at least 10% of jobs to be fully automated within a year; 82% expect this within three years. Entry-level jobs most affected. Career pathway concerns from leaders in qualitative interviews.
Two-column layout with left text about fluency and automation expectations, right photo of professionals working together, large 36% statistic callout at bottom
84% of companies have not redesigned jobs around AI capabilities. AI requires fundamentally rethinking operating models. 53% have considered pod-based or non-hierarchical models but only 16% have adopted them significantly.
Two-column text layout with prominent 84% statistic callout on right side, colorful rainbow wave graphic at bottom
Insufficient worker skills seen as biggest barrier. Figure 4 shows talent strategy adjustments: 53% educating workforce, 48% upskilling/reskilling, 36% assessing talent needs, 33% redesigning career paths, with smaller percentages for other strategies.
Three-column text layout with Figure 4 bubble chart showing nine talent strategy adjustments with percentage labels
83% view sovereign AI as at least moderately important to strategic planning; 43% rate it very/extremely important. 66% express concern about reliance on foreign-owned AI technologies. Data residency and compute considerations are boardroom issues.
Left text column with sovereign AI definition, center Figure 5 stacked bar chart on data residency importance, right Figure 6 stacked bar chart on concern over foreign AI
77% of companies factor AI solution's country of origin into vendor selection. 58% build AI stacks primarily with local vendors. Variation by geography: 11% in Americas vs 32% in EMEA rely on foreign-sourced solutions.
Three-column text layout with large 77% statistic callout on right, colorful rainbow wave graphic at bottom
23% of companies currently using agentic AI at least moderately; expected to surge to 74% within two years. Figure 7 shows stacked bar comparison of agentic AI usage today vs. in two years across usage levels.
Left text column explaining agentic AI evolution, right Figure 7 with two stacked bar charts comparing current and future usage levels
85% of companies expect to customize agents. Four industry examples: financial services (meeting actions), airline (customer rebooking), manufacturer (product development), public sector (workforce shortages).
Four-column use case layout with icon headers for each industry example, large 85% statistic callout at bottom
AI agents won't eliminate human value but increase need for uniquely human strengths like adaptivity and judgment. Quote from telecom VP: workers become force multipliers, not replaced.
Two-column text layout with large green quote callout at bottom about giving workers 'force multipliers', colorful abstract design on right
Only 21% of companies have mature governance for autonomous agents. Need for clear autonomy boundaries, real-time monitoring, audit trails. Measured approach recommended: start with lower-risk use cases.
Three-column text layout with 21% statistic callout in green box at bottom right, colorful wave decorations
Data privacy/security tops risk concerns at 73%. Figure 8 shows risk hierarchy: legal/IP compliance (50%), governance capabilities (46%), model quality (46%), workforce impact (30%). Governance enables scaling, not just compliance.
Three-column text with Figure 8 bubble chart showing AI risks by concern level on right side
58% of companies using physical AI today (at least limited use); projected to reach 80% within two years. Physical AI includes robotics, sensors, machine learning, and control systems.
Left text column with physical AI definition and adoption data, right side with Figure 9 showing two donut charts (58% today, 80% in two years)
Asia Pacific leads physical AI adoption (71% today, 90% in 2 years) vs Americas (56%/77%) and EMEA (56%/81%). Higher costs, longer development cycles, and stricter safety regulations slow physical AI vs agentic AI.
Left text column with regional analysis, right Figure 10 with world map showing three regional donut chart pairs
Leading applications in controlled environments: warehouse automation, collaborative robots on assembly lines, inspection drones, robotic picking arms, autonomous forklifts. Manufacturing, logistics, and defense are primary sectors.
Left text column with use case descriptions, center photo of warehouse robot, right area with colorful wave decoration
Figure 11 shows expected impact areas: intelligent security/smart monitoring (21%), collaborative robotics (20%), digital twins (19%), IoT-driven retail (16%), autonomous logistics (13%), smart materials (7%).
Left text column with analysis, right Figure 11 donut chart with six physical AI categories and icon labels
Restaurant industry example: computer vision for food tracking from order to delivery. Companies must ensure security, interoperability, resilience. Complex regulatory environments requiring safety approvals and industry-specific compliance.
Two-column text with manufacturing/inspection photo center-top, colorful wave decoration right
Cost is the top barrier to physical AI deployment. Total cost of ownership includes facility retrofits, equipment, integration, maintenance, spare parts, and potential downtime. Warehouse automation can cost millions in physical infrastructure vs hundreds of thousands in AI software.
Left text column on cost considerations, center photo of professional in factory setting, gradient background flowing to right
Figure 12 shows preparedness across five dimensions: Technology infrastructure (43% highly prepared, down 4pp), Strategy (42%, up 3pp), Data management (40%, down 3pp), Risk and governance (30%, up 6pp), Talent (20%, down 2pp).
Left text column with analysis, right Figure 12 with five stacked bar charts showing preparedness levels across dimensions
Perceptions of high preparedness declining for infrastructure, data management, and talent. Quote from European bank AI head: organizations prepared for traditional AI future, but 80-90% of new use cases are generative AI requiring new capabilities.
Two-column text layout with large green quote callout at bottom about GenAI needing new capabilities
First of six strategic recommendations. Focus on activation over access: empower employees to experiment, share wins, become champions. Design for deployment from the outset. Role-specific training and executive advocacy shift behavior.
Section header with icon, three-column text layout with strategic guidance, colorful wave decoration at bottom left
Redesign work around AI to combine human strengths with AI capabilities. New roles emerging: AI operations managers, human-AI interaction specialists. Organizations should flatten structures as AI absorbs routine execution.
Two-column text layout with green people icon and section header, abstract decoration on right
Governance enables scaling, not just compliance. Senior leadership must actively shape AI governance. Integrate with existing risk structures. Cross-functional teams (tech, legal, compliance, business) should establish frameworks early.
Three-column text layout with green shield/checkmark icon, colorful wave decoration at bottom left
Enterprises must navigate data control, model transparency, compliance, and localization requirements. Assess data residency needs, determine mandatory local hosting, establish cross-border policies. Proactive engagement builds strategic advantage.
Three-column text layout with orange/coral directional arrows icon, clean professional layout
Legacy architectures cannot power real-time autonomous AI. Create a 'living AI backbone': organization-wide, real-time system that adapts dynamically. Enable modular, cloud-native platforms with unified data strategy. Infrastructure determines enterprise velocity.
Left text column with infrastructure guidance, right photo of advanced industrial facility with AI/data overlays
Strategic reinvention is the strongest predictor of outsized returns. Invest in reshaping operations and creating new revenue streams. Autonomous AI accelerates the shift in knowledge-intensive industries. Balance bold transformation with operational continuity.
Three-column text layout with green rocket/launch icon, abstract decoration on right
Lists four primary authors: Jim Rowan (US Head of AI, Deloitte Consulting), Beena Ammanath (Executive Director, Global Deloitte AI Institute), Nitin Mittal (Principal, Global AI Leader), Costi Perricos (Global GenAI Business Leader). Plus global expert network contributors.
Two-column layout with author headshots and titles on left, contributor list on right, colorful wave at bottom
Credits technology and research team (Vivek Kulkarni, Lisa Hohener, Caroline Ritter) and extensive list of additional contributors who brought the report to life.
Two-column layout with research team headshots on left, contributor names list on right, decorative waves at bottom
Lists 24 Global Deloitte AI Institute leaders by country/region with headshots, covering Africa, Americas, Asia Pacific, Europe, and Middle East.
Grid layout with 24 headshots organized in rows, each with name, country/region, and email contact
Describes the Deloitte AI Institute's mission to promote human-machine collaboration in the 'Age of With'. Invites readers to explore AI resources, podcasts, newsletters, and events.
Two-column text layout with green 'Let's explore the future of AI together' CTA button, colorful rainbow wave decoration
Survey of 3,235 leaders from 24 countries (Aug-Sep 2025). 50/50 IT and business leaders. Countries include US (n=1,200), Canada (175), Brazil (115), UK (220), Germany (170), France (150), India (200), Australia (100), and more. Six endnote references.
Two-column layout with methodology details on left, endnotes/references on right, decorative wave at bottom
Standard Deloitte legal disclaimer and copyright notice. Deloitte refers to member firms of Deloitte Touche Tohmatsu Limited. Copyright 2025.
Full-page legal text with Deloitte logo, minimal design
Συχνές ερωτήσεις σχετικά με αυτή τη διαφάνεια και το βασικό περιεχόμενο παρουσίασης.
This report captures insights from a survey of 3,235 global business and IT leaders across 24 countries and six industries, examining how organizations are adopting and scaling AI. It covers six key themes: worker access expansion, AI transformation impacts, AI fluency and work redesign, sovereign AI, agentic AI, and physical AI, providing actionable strategies for enterprise AI success.
Key findings include: workforce access to AI expanded 50% in one year; only 25% have moved 40%+ of AI experiments to production; 34% are pursuing deep business transformation with AI; 74% plan to deploy agentic AI within two years; 58% already use physical AI; and 77% of companies factor AI solution origin into vendor decisions due to sovereign AI concerns.
This template is ideal for C-suite executives, AI strategy leaders, CIOs/CTOs, business consultants, and enterprise technology decision-makers who need to present AI adoption data, benchmark their organization against global peers, or build business cases for AI investment and transformation initiatives.
Agentic AI refers to autonomous AI systems that can set goals, reason through multi-step tasks, use tools, and coordinate with people or other agents. The report shows 74% of companies plan to deploy it within two years, but only 21% have mature governance models, highlighting the urgency of establishing clear boundaries for autonomous agent behavior.
Sovereign AI is about strategic independence in AI capabilities. 83% of companies view it as at least moderately important to strategic planning, 77% now factor a solution's country of origin into vendor decisions, and 66% express concern about reliance on foreign-owned AI technologies. This trend is reshaping how enterprises build and deploy AI infrastructure.
The presentation contains 41 slides with 12 data-rich figures including donut charts, stacked bar charts, paired bar charts, bubble charts, world maps with regional data, and large statistical callouts. Each visualization is professionally designed with Deloitte's signature green, teal, and blue color scheme.
The report outlines six focus areas: (1) Close the gap between AI access and activation, (2) Unlock human advantage by redesigning work around AI, (3) Build governance before you scale, (4) Address sovereign AI requirements, (5) Build living technology and data infrastructure, and (6) Pursue strategic reinvention rather than incremental efficiency.
Yes, the slides are available in PPTX format for full customization. You can adapt the data visualizations, update statistics with your own organization's data, use the strategic framework as a starting point, and leverage the professional Deloitte design aesthetic for executive-level presentations.

Create Your Own Slides
Turn your ideas into professional presentations in seconds with 2slides AI.
Αναφερθείτε σε επαγγελματικές σχεδιάσεις, επιλέξτε το στυλ σας και δημιουργήστε σλάιντ με τέλεια απόδοση κειμένου. Τροφοδοτείται από το Nano Banana—ξεκινήστε να δημιουργείτε την παρουσίασή σας τώρα.
Your AI Agent for slides. Save time, shine faster with intelligent presentation creation.




© 2026 2slides. All rights reserved.