
Ανήκει στη συλλογή Παραδείγματα παρουσιάσεων για επενδυτές
Cemex Q3 2026 Earnings Presentation: third-quarter 2026 results deck from the Mexican building-materials company, filed with the SEC as an exhibit to Form 6-K. Figures are in U.S. dollars (US$) unless noted. Headline numbers: net sales of US$4,590 million (+8% reported, +5% like-to-like), EBITDA of US$990 million (+12%) with a 21.6% margin, and record third-quarter free cash flow from operations of US$723 million (+34%).
Χρησιμοποιεί το εξώφυλλο αυτής της παρουσίασης ως πρότυπο στυλ για διαφάνειες με το δικό σας περιεχόμενο. Ή επιλέξτε οποιαδήποτε σελίδα παρακάτω για να χρησιμοποιήσετε τη διάταξή της ως αναφορά.
Γρήγορη Πλοήγηση
Ετικέτες
Κοινοποίηση διαφανειών
Cemex Q3 2026 Earnings Presentation: third-quarter 2026 results deck from the Mexican building-materials company, filed with the SEC as an exhibit to Form 6-K. Figures are in U.S. dollars (US$) unless noted. Headline numbers: net sales of US$4,590 million (+8% reported, +5% like-to-like), EBITDA of US$990 million (+12%) with a 21.6% margin, and record third-quarter free cash flow from operations of US$723 million (+34%).
Λεπτομερής προβολή κάθε σελίδας διαφάνειας, συμπεριλαμβανομένης της διάταξης, βασικού περιεχομένου και οπτικών στοιχείων.
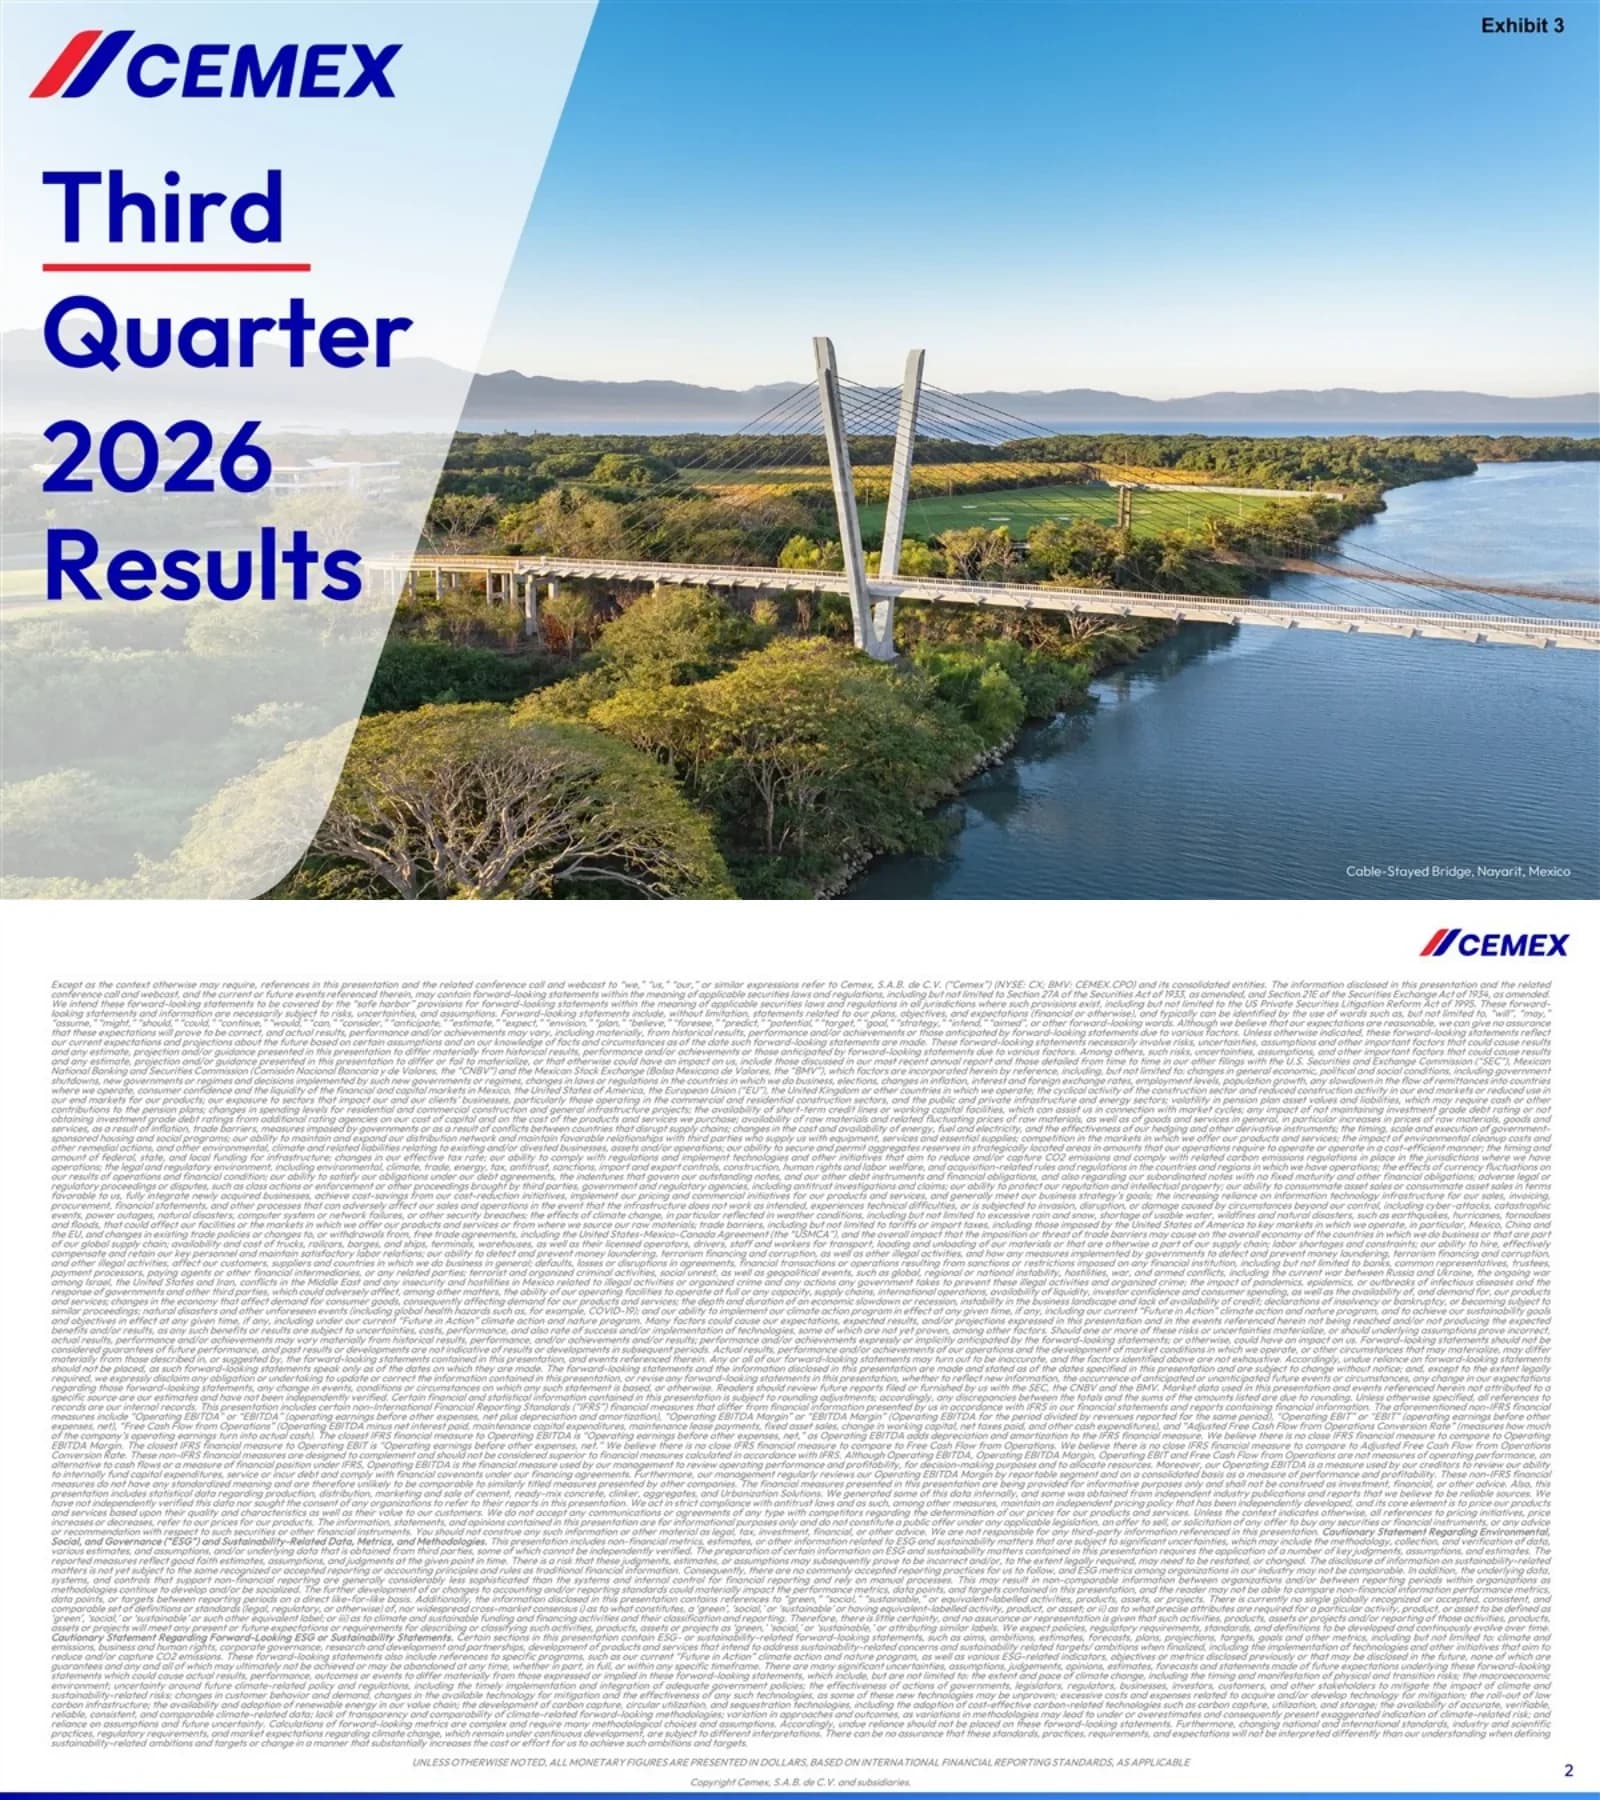
Cover slide labeled Exhibit 3 with the Cemex logo and the title Third Quarter 2026 Results, set over a photo of a cable-stayed bridge in Nayarit, Mexico.
Full-bleed landscape photo with a translucent white diagonal panel on the left holding the logo and large stacked title text; exhibit label top right.
Dense legal disclaimer covering forward-looking statements, non-IFRS measures (Operating EBITDA, EBIT, free cash flow from operations, adjusted FCF conversion) and a cautionary statement on ESG and sustainability-related data. Footer states that unless otherwise noted all monetary figures are in U.S. dollars under IFRS. The small print is only partially legible at this resolution.
Single full-width block of very small italic text with a footer note and page number.
Six highlights: 3Q consolidated EBITDA and EBIT growing at a double-digit rate with margin expansion for a fifth consecutive quarter; record 3Q FCF from operations of US$723M (+34% YoY) with a trailing-twelve-month adjusted conversion rate of about 60% for a second quarter; close to the Cemex Day 2027 financial targets (presented February 26, 2026) and operating ahead of them year-to-date; first benefits from asset pruning with divestments in the US and Europe, mainly ready-mix; Mexico recovery gaining momentum; and year-to-date gross CO2 emissions down 1% on a lower clinker factor.
Left two-thirds bulleted list with bold blue lead-ins; right third shows an angled concrete-architecture photo (Silkworm Sanctuary, Oaxaca); footnotes at bottom.
Paired bar charts for 3Q25 vs 3Q26 in US$ millions: net sales 4,245 to 4,590 (+8%, +5% like-to-like); EBITDA 882 to 990 (+12%, +9% l-t-l); EBITDA margin 20.8% to 21.6% (+0.8pp); FCF from operations 540 to 723 (+34%). Year-to-date: sales 11,952 to 13,203 (+5% l-t-l), EBITDA 2,299 to 2,802 (+16% l-t-l), margin 19.2% to 21.2% (+2.0pp), FCF from operations 473 to 1,389 (+194%). Side panels: TTM adjusted FCF conversion 46% to 62% (+16pp) and EBIT 547 to 652 (+19%).
Four dark-blue/light-blue bar pairs with oval growth callouts and a YTD row underneath; right sidebar with two rounded panels over a tower photo.
World map with 3Q26 YoY volume growth by region for cement, ready-mix and aggregates: US +4% / -1% / +4%; Mexico +7% / -2% / -2%; SCAC +3% cement and -2% ready-mix; Europe -5% / -7% / -8%; EMEA -1% / -3% / -8%. Consolidated volumes: cement +3%, ready-mix -2%, aggregates -3%. Cement refers to domestic gray cement.
Light-blue world map background with small three-bar charts placed over each region and a boxed consolidated chart top right; color legend bottom right.
World map of 3Q26 YoY and sequential (2Q26 to 3Q26) price variation in local currency. Consolidated YoY: cement +1%, ready-mix +3%, aggregates +3%; sequential -2%, +1%, -1%. Mexico YoY +5% / +4% / +4%; US -4% / +1% / -1%; Europe +1% / +2% / +5%; EMEA -1% / +5% / +5%; SCAC cement 0% and ready-mix -2%. Prices are FOB, volume-weighted at constant FX.
Same world-map template as page 5, with YoY bars above and boxed sequential percentages below each region.
EBITDA bridge in US$ millions: 3Q25 EBITDA 882, plus volume 23, plus price 105, minus costs and expenses 89, plus Urbanization Solutions and other 39, reaching 960 like-to-like (+9%); FX adds 30 for 990 reported (+12%). EBITDA margin rises 0.8pp from 20.8% to 21.6%.
Horizontal waterfall chart with navy totals, green increases and a purple decrease; bracket arrows with oval percentage callouts; margin arrow below.
Cost savings program in US$ millions: 200 achieved in 2025, 120 in 1H26 and 60 in 3Q26, with 15 expected in 4Q26 and 80 in 2027, for 475 of recurrent savings; savings split 52% operating and 48% overhead. YTD 2026 table of EBITDA margin change: Mexico +4.5pp, US -1.4pp, EMEA +1.3pp, SCAC +1.1pp, Cemex +2.0pp, with COGS as % of sales -1.6pp and operating expenses -0.8pp. YTD EBIT +34% and EBITDA +22% YoY.
Blue diagonal band holding a donut and a step chart split into Achieved and Expected zones; table overlaid on a concrete-structure photo bottom right.
Asset pruning targets EBIT, FCF generation and return on invested capital; it is a multi-year process launched in 2025. 3Q26 transactions: divested ready-mix assets in the Atlanta market and entered exclusive negotiations with Vicat Group to sell ready-mix and aggregates assets in South-Eastern France (announced October 1, 2026, subject to consultation and approvals). More than US$200M in estimated cash proceeds from completed and announced transactions, covering over 140 assets.
Three stacked rounded text cards on the left, a large outlined callout box on the right, and an aerial road-and-forest photo with mixer trucks along the bottom.
Section divider introducing the regional results, with a photo of the L'Arbre Blanc building in Montpellier, France.
White left area with large blue title and red/blue brand slash; architecture photo filling the right side behind a curved diagonal edge.
Mexico 3Q26 in US$ millions: sales 1,299 (+9% l-t-l), EBITDA 480 (+22% l-t-l), EBITDA margin 37.0% (+3.9pp). YTD: sales 3,866 (+10%), EBITDA 1,425 (+24%), margin 36.9% (+4.5pp). Commentary: structural efficiencies and demand recovery drive double-digit EBITDA growth with pricing offsetting input-cost inflation; demand supported by residential and government social programs; strong ready-mix orderbook with more contracted infrastructure volumes; constructive 2027 outlook.
Regional template: metric table top left, four bullets below, full-height photo on the right (cable-stayed bridge, Nayarit).
US 3Q26 in US$ millions: sales 1,373 (+5% l-t-l), EBITDA 259 (-4%), margin 18.9% (-1.7pp). YTD: sales 3,884 (+2%), EBITDA 697 (-5%), margin 18.0% (-1.4pp). YTD EBITDA mix: aggregates 41%, cement 39%, ready-mix and Urbanization Solutions 20%. Cement volumes up 4% helped by the Omega acquisition and project work; ready-mix and aggregates prices up mid-single digits vs 4Q25 with some cement price erosion; EBITDA hit by an unplanned outage, raw-material inflation and lower cement prices; about 40% of IIJA funds still to be spent, plus growing AI-related investment.
Regional template with metric table, bullets and a photo (Sixth Street Viaduct, Los Angeles) carrying an EBITDA-mix donut card.
EMEA 3Q26 in US$ millions: sales 1,435 (+3% l-t-l), EBITDA 257 (+4%), margin 17.9% (flat). YTD: sales 4,115 (+4%), EBITDA 702 (+15%), margin 17.0% (+1.3pp). YTD EBITDA split Europe 72% and MEA 28%. Europe demand hit by heatwaves and project delays, partly offset by cement volume growth in Germany and Spain; Europe cement, ready-mix and aggregates prices up 2%, 3% and 4% vs 4Q25; CBAM and the phase-down of free EU ETS allowances seen supporting cement pricing; double-digit cement volume growth in Middle East and Africa led by Egypt.
Regional template with metric table, five bullets and a photo (Smetana's Footbridge, Litomysl, Czechia) with a donut card.
South, Central America and the Caribbean 3Q26 in US$ millions: sales 333 (0% l-t-l), EBITDA 62 (-14%), margin 18.6% (-3.3pp). YTD: sales 935 (-1%), EBITDA 195 (+6%), margin 20.8% (+1.1pp). YTD EBITDA mix: Colombia 36%, Jamaica 34%, rest 30%. Quarter hit by purchased cement, maintenance and energy costs; solid cement demand in Colombia and Jamaica from the informal sector, hurricane reconstruction and tourism projects; cement prices up 2% vs 4Q25.
Regional template with metric table, four bullets and a photo of a Jamaican estate terrace with an EBITDA-mix donut card.
Section divider for the financial section, showing the Peljesac Bridge in Croatia, built with Cemex's Vertua concrete.
White left panel with blue title and brand slash; bridge photo on the right behind a curved mask; photo caption bottom right.
Free cash flow table in US$ millions: EBITDA 882 to 990 in the quarter (+12%) and 2,299 to 2,802 YTD (+22%); net interest paid (69) vs (104); maintenance capex and leases (183) vs (224); working capital (3) vs +132; taxes (90); other cash expenditures (21); sale of fixed assets 99. FCF from operations 723 vs 540 (+34%) and 1,389 YTD vs 473 (+194%). Side charts: TTM adjusted FCF conversion 46% to 62%, YTD controlling net income 1,316 to 982 (-25%), average working-capital days -10 to -9.
Cash flow table on the left with quarter and YTD columns; two narrow bar-chart panels on the right.
Section divider for the 2026 outlook, with a photo of the Gilbert Chabroux School in Lyon, France, built with Cemex's Insularis product.
White left panel with blue title and brand slash; white curved architecture against blue sky on the right.
Guidance as of October 26, 2026: EBITDA up 16% to 17% YoY (like-to-like, assuming MXN 18.25 to 18.50 per USD in 4Q26); energy cost per ton of cement up low-single digits; maintenance capex about US$900 million; growth capex about US$300 million plus about US$210 million in intangible assets; working-capital investment US$50 to 100 million; cash taxes about US$400 million; net interest paid down US$40 million.
Two-column guidance table with thin blue divider lines; footnotes below.
Appendix divider featuring the International Museum of the Baroque in Puebla, Mexico.
White left panel with blue title and brand slash; museum dusk photo on the right.
2026 volume guidance vs 2025 for cement, ready-mix and aggregates. Cemex: low-single-digit increase / low-single-digit decrease / low-single-digit decrease. Mexico: low-to-mid-single-digit increase / flat to low-single-digit decrease / flat to low-single-digit decrease. US: flat / low-single-digit decrease / low-single-digit increase. Europe: mid-single-digit decrease across all three. MEA: low-single-digit increase / mid-single-digit increase / flat. SCAC: low-single-digit increase / mid-single-digit decrease / N/A. Orange text marks downward revisions, including Cemex ready-mix, Mexico ready-mix and aggregates, and Europe cement.
Grid table with regions as rows and products as columns, color-coded column rules and orange highlighting for revised items.
Urbanization Solutions YTD in US$ millions: sales 597 to 694 (+16%, +11% l-t-l) and EBITDA 124 to 157 (+26%, +20% l-t-l), margin 20.8% to 22.6% (+1.8pp). YTD 3Q26 sales mix: construction chemicals 32%, mortars 25%, concrete products 29%, asphalt 13%. YTD 3Q26 regional split of sales: Mexico 14%, US 29%, EMEA 52%, SCAC 5%; of EBITDA: 25%, 28%, 40%, 8%.
Two stacked-bar charts with segment percentages, a margin arrow, and regional split bars below; aerial park photo on the right.
Table for domestic gray cement, ready-mix and aggregates comparing YTD 3Q26 vs YTD 3Q25, 3Q26 vs 3Q25 and 3Q26 vs 2Q26. Cement volume +2%, +3%, +2%; cement price in USD +8%, +4%, -2%. Ready-mix volume -2%, -2%, +2%; price in USD +7%, +7%, 0%. Aggregates volume -1%, -3%, +4%; price in USD +7%, +5%, -2%. Like-to-like prices also shown.
Clean three-block table with blue header row and thin separators.
Regional 3Q26 vs 3Q25 table for volume, price in USD and price in local currency. Mexico cement volume +7%, USD price +12%, LC price +5%; US cement volume +4%, price -4%; Europe cement volume -5%; MEA cement volume +12%; SCAC cement volume +3% with USD price +9%. Ready-mix and aggregates columns show Mexico prices up 11% in USD, Europe aggregates volume -8% and SCAC aggregates volume -19%.
Wide bordered table with three product groups across nine columns and six regional rows.
Same regional table on a year-to-date basis. Mexico cement volume +7%, USD price +17%, LC price +6%; US cement +1%, aggregates volume +5%; Europe cement -5%, ready-mix -6%, aggregates -7%; MEA ready-mix USD price +24%; SCAC aggregates volume -25%.
Identical bordered grid layout to page 23 for easy comparison.
YTD net debt waterfall in US$ millions: from 4,958 at December 2025, FCF from operations reduces it by 1,389, while growth capex 208, acquisitions and divestments 281, intangibles 100, subordinated-note coupons 113, dividends 120, share buybacks 100 and redemption of the 5.125% subordinated notes 1,000 add to it, with others net -67, ending at 5,423 in September 2026 (+466). Shareholder return about US$220M. QoQ waterfall: from 6,225 in June 2026 down 802 to 5,423, with FCF of 723 and others net of 263, which mainly reflects a EUR 200 million Spanish government grant for a carbon capture project.
Two stacked horizontal waterfalls (YTD above, QoQ below) with floating value labels; green box highlighting shareholder returns.
Total debt of US$6,075 million with an average life of 5.2 years. Maturities in US$ millions: 2026: 260, 2027: 237, 2028: 183, 2029: 901, 2030: 1,282, 2031: 1,728, 2036: 1,483. Debt by instrument: fixed income 82%, leases 16%, other bank debt 2%.
Stacked column maturity ladder with legend on the left, average-life box top left and a pie chart on the right.
Total debt including leases 6,789 (3Q25), 6,075 (3Q26, -11%) and 6,879 (2Q26); short-term share 7%. Cash 652 vs 1,198 a year earlier. Net debt 5,423 vs 5,592 (-3%) and 6,225 in 2Q26. Leverage ratio 1.80x vs 2.52x a year earlier and 2.08x in 2Q26. Currency denomination: US dollar 79%, euro 16%, MXN 2%, other 3%; interest rate fixed 87% and variable 13%.
Debt table on the left; two pie charts stacked on the right for currency and interest-rate mix.
Carbon strategy (YTD 3Q25 / 2025 / YTD 3Q26): gross CO2 578 / 577 / 570 kg per ton of cement equivalent; net CO2 536 / 538 / 537; clinker factor 71.5% / 71.3% / 70.6%; alternative fuels 33.1% / 32.1% / 28.5%. Blended cement as a share of total cement produced 84.1% / 84.5% / 86.4%. Health and safety: employee fatalities 0 / 2 / 1; employee LTI frequency rate 0.3 / 0.3 / 0.4; operations with zero fatalities and injuries 96% / 97% / 97%.
Three KPI tables with bright blue headers arranged in a two-column grid on a white background.
Glossary defining SCAC (South, Central America and the Caribbean), EMEA, MEA, domestic gray cement, local currency, like-to-like, maintenance and growth capital expenditures, sales, EBIT, Operating EBITDA, EBITDA margin, free cash flow from operations, investment in intangible assets, IFRS, percentage points, prices, USD and % YoY.
Two-column glossary with right-aligned terms and left-aligned definitions.
Closing slide with investor relations contacts in the United States and Mexico plus the IR email, and stock information: NYSE ADS ticker CX, Mexican Stock Exchange CPO ticker CEMEX.CPO, with a ratio of 10 CPOs per ADS.
Deep-blue background with red and white curved shapes; two columns of white text separated by a thin red rule.
Συχνές ερωτήσεις σχετικά με αυτή τη διαφάνεια και το βασικό περιεχόμενο παρουσίασης.
It is the 30-slide deck Cemex, S.A.B. de C.V. used to present its third-quarter 2026 results. It was filed with the SEC as an exhibit to Form 6-K and covers consolidated results, the Mexico, US, EMEA and SCAC regions, cash flow, debt, 2026 guidance and sustainability indicators.
Net sales were US$4,590 million (+8% reported, +5% like-to-like), EBITDA was US$990 million (+12%) with a 21.6% margin, EBIT was US$652 million (+19%) and free cash flow from operations was a record US$723 million (+34%). The leverage ratio fell to 1.80x from 2.52x a year earlier.
Unless noted, all amounts are in U.S. dollars (US$) under IFRS, even though Cemex is a Mexican company. Price changes are also shown in local currency (LC) and on a like-to-like basis at constant exchange rates.
It is Cemex's cost savings program. The deck shows US$200 million achieved in 2025, US$120 million in 1H26 and US$60 million in 3Q26, with more expected in 4Q26 and 2027 for a total of US$475 million in recurrent savings, split 52% operating and 48% overhead.
As of October 26, 2026, Cemex expects EBITDA to grow 16% to 17% like-to-like, maintenance capex of about US$900 million, growth capex of about US$300 million plus about US$210 million in intangibles, cash taxes of about US$400 million and a US$40 million reduction in net interest paid.
Foreign private issuers often submit presentations to the SEC's EDGAR system as rasterized page images inside a Form 6-K exhibit. The PDF here keeps that original form, and some very small print, such as the full disclaimer on page 2, is hard to read at this resolution.
Yes. You can download the PDF and an editable PPTX converted from it, then adapt layouts such as the regional results template, the EBITDA bridge, the net debt waterfall and the debt maturity ladder for your own earnings presentation. The financial data belongs to Cemex and should be cited if reused.
It uses a consistent navy, bright-blue and red brand palette, oval growth callouts on paired bar charts, world-map charts for regional volumes and prices, a repeatable regional slide layout, and full-bleed architecture photos built with Cemex products on its section dividers.

Create Your Own Slides
Turn your ideas into professional presentations in seconds with 2slides AI.
Αναφερθείτε σε επαγγελματικές σχεδιάσεις, επιλέξτε το στυλ σας και δημιουργήστε σλάιντ με τέλεια απόδοση κειμένου. Τροφοδοτείται από το Nano Banana—ξεκινήστε να δημιουργείτε την παρουσίασή σας τώρα.
Ο Πράκτορας AI σας για διαφάνειες. Εξοικονομήστε χρόνο, λάμψτε πιο γρήγορα με έξυπνη δημιουργία παρουσιάσεων.


© 2026 2slides. Όλα τα δικαιώματα διατηρούνται.