
Ανήκει στη συλλογή Παραδείγματα παρουσιάσεων για επενδυτές · Παραδείγματα παρουσιάσεων για επενδυτές από την Αυστραλία
ANZ's 2025 Full Year Debt Investor Presentation (full year ended 30 September 2025): a 79-slide bank debt investor pack covering financial results, group treasury (capital, liquidity and funding), risk management and housing, ESG and economics. Published by ANZ Group Treasury on ANZ's Debt Investors Centre for fixed-income investors. Amounts are Australian dollars (A$) unless marked NZ$.
Χρησιμοποιεί το εξώφυλλο αυτής της παρουσίασης ως πρότυπο στυλ για διαφάνειες με το δικό σας περιεχόμενο. Ή επιλέξτε οποιαδήποτε σελίδα παρακάτω για να χρησιμοποιήσετε τη διάταξή της ως αναφορά.
Γρήγορη Πλοήγηση
Ετικέτες
Κοινοποίηση διαφανειών
ANZ's 2025 Full Year Debt Investor Presentation (full year ended 30 September 2025): a 79-slide bank debt investor pack covering financial results, group treasury (capital, liquidity and funding), risk management and housing, ESG and economics. Published by ANZ Group Treasury on ANZ's Debt Investors Centre for fixed-income investors. Amounts are Australian dollars (A$) unless marked NZ$.
Λεπτομερής προβολή κάθε σελίδας διαφάνειας, συμπεριλαμβανομένης της διάταξης, βασικού περιεχομένου και οπτικών στοιχείων.
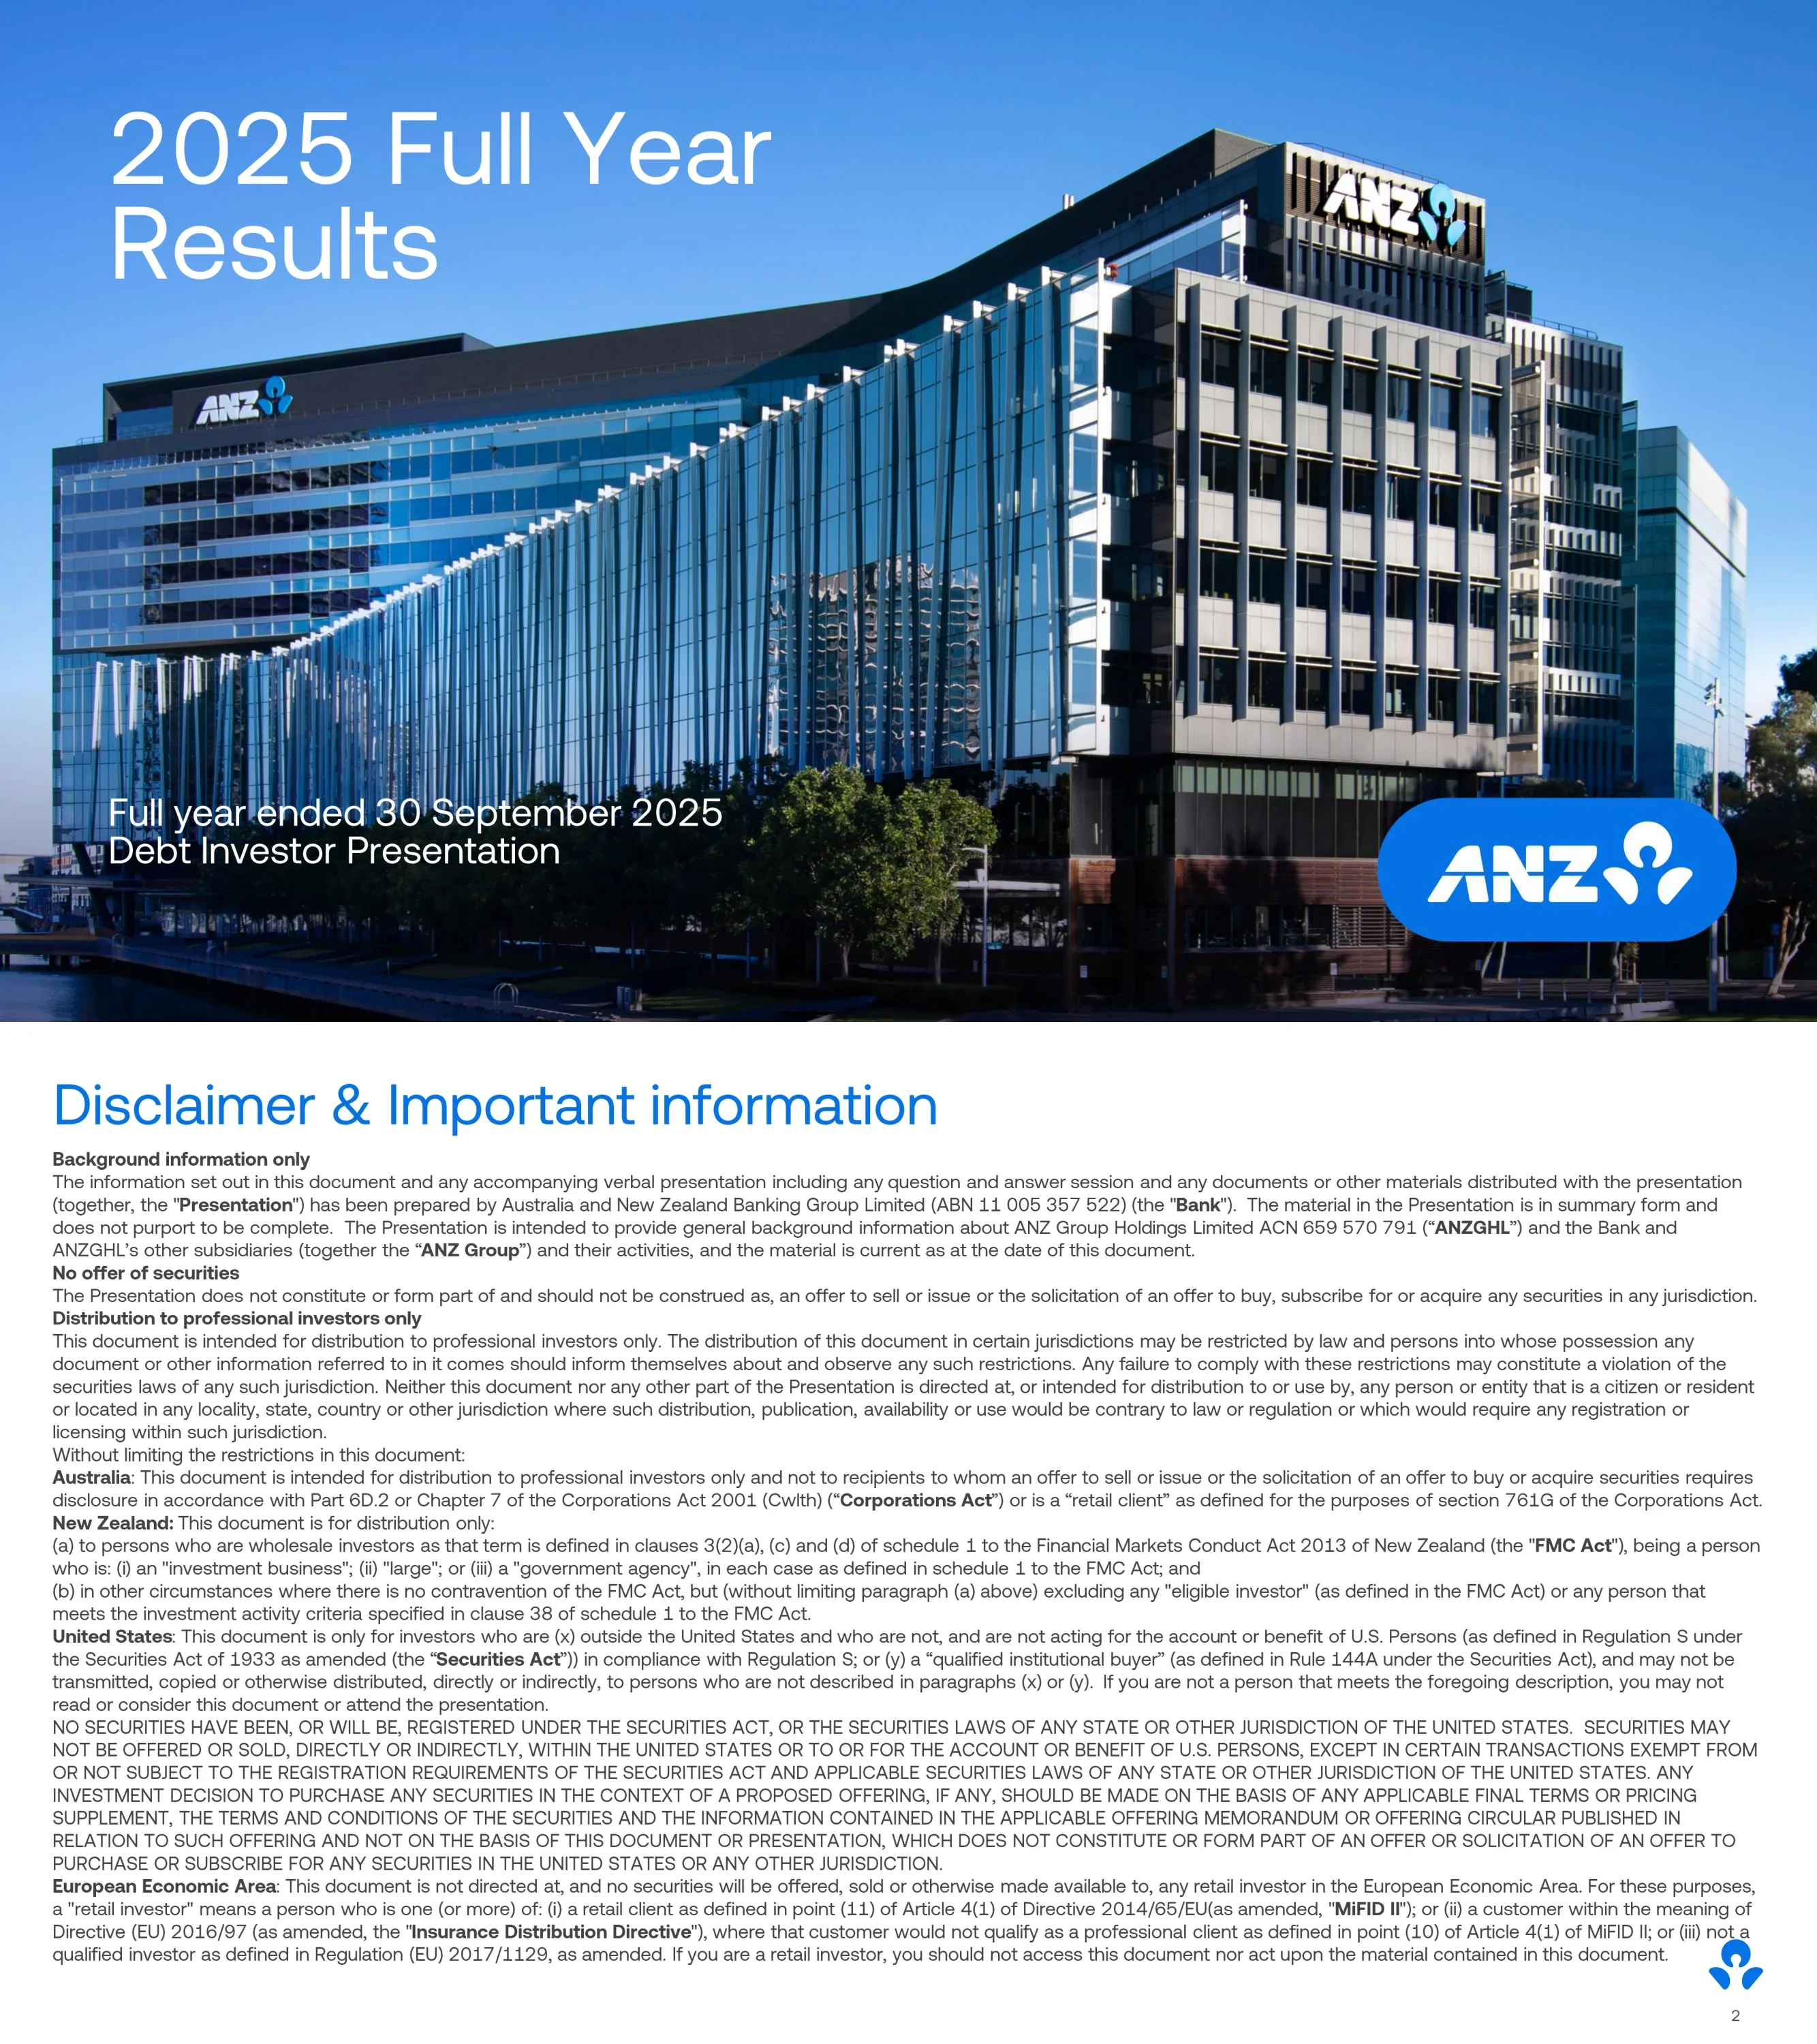
Cover for ANZ's Debt Investor Presentation covering the full year ended 30 September 2025.
Full-bleed photograph with title text and a white logo pill at bottom right.
Opening legal notice: the material is background information only, is not an offer of securities and is intended for professional investors.
Full-page dense legal text in a single block with a title bar.
Country-by-country distribution restrictions covering Australia, New Zealand, the US (Reg S and Rule 144A QIBs), the EEA and the UK.
Full-page legal text arranged in headed paragraphs by jurisdiction.
No-reliance language, forward-looking and climate-related statements, non-GAAP measures such as cash profit, credit ratings and third-party information.
Full-page legal text in headed paragraphs.
Heritage since 1828, a Big Four bank in Australia and New Zealand, 29 markets and over 11m customers. Assets $1,297b including $829b net loans; liabilities $1,225b including $748b customer deposits; market cap $99.1b.
White content card overlaid on a black-and-white photograph, with KPI figures in columns.
Two scale markets and four divisions: Australia Retail, Australia Business and Private Bank (both Top 4), Institutional (#1 institutional bank across Australia and New Zealand) and New Zealand (#1 market leader).
Blue world map background with four navy-header division cards.
Embed the new leadership team, integrate Suncorp Bank faster (migration by June 2027), accelerate ANZ Plus (all 8m retail and SME customers by September 2027), simplify (over 30% of 3,500 announced roles exited by end-October 2025) and strengthen non-financial risk management.
Numbered list arranged along an arc, one line of explanation per priority.
Photo grid of ten executives including CEO Nuno Matos and CFO Farhan Faruqui, with a statement on culture.
Grid of circular headshots with names and roles, culture text alongside.
Since the July 2022 deal announcement, customer deposits are up 19% and net loans up 18%. Migration to ANZ by June 2027; full run-rate cost synergies of about $500m by FY29.
Three-column card layout with headline figures.
Technology simplification path: 3 front-ends, 3 middleware and 2 core systems today, 1/2/1 by September 2027 and 1/1/1 after 2027.
Horizontal timeline with arrows and system counts at each stage.
About $800m of pre-tax gross cost savings targeted in FY26, with FTE reductions split roughly 60% Retail and Technology and 40% the rest of the group.
Savings headline on the left and a single stacked bar on the right.
ASIC settlement, the ASIC Matters Resolution Program and the Root Cause Remediation Plan submitted to APRA, delivered through a three-year Design, Implement, Embed programme.
Three-stage process flow with supporting text blocks.
ROTE towards 12% by FY28 and 13% by FY30, cost-to-income ratio in the mid-40s% by FY28, $800m savings in FY26 and $500m Suncorp synergies by FY29.
Checkmark list on a white rounded card.
Divider introducing the Financial Results section.
White slide with large 2025 Full Year Results headline, section caption and logo at bottom right.
Cash profit ex significant items $6,896m (FY24 $6,921m), revenue to average RWA 4.75% (4.80%), cost-to-income 53.4% (51.4%), ROTE 10.5% (10.6%) and CET1 12.3% (12.2%), made up of 12.0% Level 2 plus NOHC surplus.
Row of five mini bar charts comparing FY24 and FY25.
Statutory profit $5,891m (-10%), cash profit ex significant items $6,896m (flat), revenue $22,184m (+7%), expenses $11,849m (+11%) and profit before provisions $10,335m (+2%). Significant items include the PT Panin impairment, ASIC settlement and restructuring.
Full-width financial table with FY24, FY25 and change columns, plus significant-items notes.
FY25 revenue of $21,899m split by division (Institutional 31%, Australia Retail 27%, New Zealand 17%, Australia Commercial 16%, Suncorp 8%). Half-yearly bars show revenue of about $10.4b to $11.0b and 2H25 expenses of $7.1b including restructuring.
Donut chart on the left with two half-yearly stacked bar charts on the right.
Group NIM moved from 156 bps in 1H25 to 154 bps in 2H25: asset pricing -1, deposit pricing -3, capital and replicating +2, group centre liquids +2, markets -2. NIM excluding Markets was flat.
Waterfall chart across the slide with a callout for NIM ex Markets.
Individual provision charge and loss rate by half (loss rate of 1 to 4 bps), consumer 90+ days past due (Australia home loans 0.86%, NZ home loans 0.86%, Australia cards 0.45%) and non-performing loans rising from 0.64% to 0.79%.
Grid of charts: bar and line combinations with small line charts.
Four stacked percentage bar sets (September 2023 to September 2025) by division: EAD $1,303b, RWA $459b, net loans $829b and deposits $748b.
Four side-by-side stacked bar panels with a shared division legend.
6.40m customers, main financial institution share 11.7%, NPS +1.7. Deposits grew from $90b to $100b (+12%) and home loans from $327b to $344b (+5%).
Blue frame with a KPI panel on the left and two bar charts on the right.
571k customers, main financial institution share 16.4%, NPS -1.8. Deposits up 3% and lending rising from $65b to $67b.
KPI panel on the left with two bar charts on the right.
1.26m customers, main financial institution share 2.5%, NPS +16.5. Deposits up 6% and lending up 3%.
KPI panel on the left with two bar charts on the right.
#1 relationship bank. Operational deposits grew from $110b to $123b (+12%); markets revenue was $2,139m against $2,184m a year earlier.
KPI panel on the left with deposit and markets revenue bar charts on the right.
2.67m customers, personal main financial institution share 32.0%, NPS +19. Deposits rose from NZ$58b to NZ$61b and lending from NZ$133b to NZ$138b.
KPI panel on the left with two bar charts on the right.
Matrix of main financial institution share and NPS rank across the six businesses.
Table-style KPI matrix with rank indicators.
Simplicity (cost-to-income 53.4%, about $30m Suncorp synergies), Resilience (CET1 12.03%, RCRP approved) and Delivering value (ROTE 10.5%, revenue to RWA 4.75%).
Three-column scorecard with headline metrics under each theme.
Divider introducing the Group Treasury section.
White slide with large headline, section caption and logo at bottom right.
Stacked bars from March 2024 to September 2025 for Australia Retail ($349b), Australia Commercial ($67b), Suncorp ($73b), New Zealand (NZ$140b) and Institutional ($216b).
Five side-by-side stacked bar panels, one per division.
Customer deposits by division split into transaction, savings, term and offset balances, shown in the same five panels as the loans slide.
Five side-by-side stacked bar panels with a product legend.
Level 2 CET1 of 12.0% (Level 1 12.4%), up 25bp on 1H25; final dividend 83c, 70% franked. Waterfall from 11.78% in March 2025 to 12.03%, or 12.26% including the NOHC surplus.
CET1 waterfall chart with key-point callouts on the side.
Capital of $97.8b (CET1 $56.6b, AT1 $7.4b, Tier 2 $33.8b). Tier 1 13.6%, total capital 21.0%, leverage 4.4%, RWA $459b; CET1 17.6% on a Basel Harmonised basis.
Stacked capital composition bar beside a ratio table.
Reconciles APRA CET1 of 12.0% to Basel Harmonised 17.6% through adjustments including mortgage multipliers (+1.05%), IRB scaling (+0.85%), NZ exposures (+0.85%), equity investments (+0.87%) and IRRBB (+0.73%).
Comparison bars with a reconciliation table.
Level 2 RWA waterfall from $469.0b to $458.5b, plus IRRBB RWA bars from September 2022 to September 2025.
Waterfall chart on the left with a bar chart on the right.
NSFR moved from 116% to 115%, with an NSFR composition chart and funding versus assets composition including customer deposits and long-term wholesale debt at 11%.
Waterfall plus composition bars and a funding-versus-assets stacked comparison.
Average LCR of 132% in FY25 (133% in FY24); average LCR surplus up $9b to $77b. Liquid assets of $313b against net cash outflows of $236b.
Summary bars on the left and LCR composition stack on the right.
FY25 issuance of $37b, about 50% in domestic currencies; FY26 expected about $35b (ANZBGL ~$25b, ANZ NZ ~$5b, Suncorp ~$3 to 5b). Includes issuance and maturity profile, product and currency mix, and a credit ratings table (ANZ BGL senior AA-/Aa2/AA-).
Dense multi-panel slide: profile bars, two pie charts and a ratings table.
Total capital 21.0%; about $7.5b of Tier 2 issued in FY25 including the first AUD benchmark 20-year bullet. Tier 2 ratio 7.4% (7.7% pro forma) against a 6.5% January 2026 requirement; FY26 Tier 2 need about $5 to 7b. AT1 being phased out.
Key points on the left with first-call and amortisation profile charts and a currency pie.
Tier 2 relative value: stacked CET1, AT1 and Tier 2 as a percentage of RWA versus Canadian, Scandinavian, UK, Dutch, French and Singaporean banks, with 10-year USD and 10NC5 EUR new-issue spreads.
Stacked comparison bars with spread charts alongside.
Gantt-style outlook for 2025 to 2027: loss-absorbing capacity, APRA AT1 changes (2027), APS210 liquidity review, recovery and resolution, IRRBB, FRTB, RBNZ capital framework, NZ Deposit Takers Act and core standards.
Gantt chart with workstreams in rows and quarters along the top.
Compares RBNZ options with ANZ's recommended option 3 capital stack of 18.25% (CET1 10.50%, Tier 2 3.25%, LAC 4.50%), with key points of ANZ NZ's submission.
Stacked bar comparison of options with a key points panel.
Portfolio earnings rate against 3-month BBSW and 5-year swap for Australia and NZ; Australian earnings rate up from 1.90% to 2.91% and NZ from 1.93% to 3.84% (1H23 to 2H25). Volumes about $94b Australia, $29b NZ and $12b international.
Two line charts with an earnings rate table below.
Divider introducing the Risk Management and Housing section.
White slide with large headline, section caption and logo at bottom right.
Individual provision charge by half, collective provision balance of $4,379m (1.18% coverage), collective provision charge table and loss-rate ratios.
Bar chart on the left with charge tables and ratios on the right.
Collective provision by stage and by division, with portfolio coverage by EAD, in tables from March 2024 to September 2025 (total $4.38b).
Multiple tables and stacked bars by stage and division.
Collective provision under 100% upside, base, downside and severe scenarios ($1,550m, $1,997m, $4,458m and $9,913m) with weights of 1/46/40/13%. Economic scenario table for Australia and New Zealand, with severe-case house prices -43.5%.
Scenario bar chart on the left with an economic assumptions table on the right.
Individual provision loss rate since 1991 (peak around 230 bps in the early 1990s) and total impairment charge by half from 1H20 to 2H25.
Long-run line chart on top with a half-yearly bar chart below.
EAD mix September 2008 versus September 2025 (residential mortgages 35% to 42%) and average observed loss rates of 38, 24, 16 and 11 bps over 35, 25, 15 and 10 years.
Two stacked mix bars with a loss-rate comparison.
Probability-of-default distribution for wholesale IRB EAD (83% investment grade) and retail IRB EAD.
Two side-by-side distribution bar charts.
Gross impaired assets moved from $1.52b to $2.54b, shown by category, size band and division, plus new impaired assets by half.
Grid of stacked bar charts and a new-impaired-assets chart.
90+ days past due lines for Australia home loans, Australia cards and NZ home loans from 2018 to 2025, plus an indexed control list.
Line charts with a control list table.
EAD $1,303b and RWA $459b by type, credit RWA drivers waterfall from $361.2b to $369.6b, and a risk intensity table (28% in total).
Composition bars, a waterfall and a table.
EAD by industry in a donut and table: consumer lending 43.5%, finance, investment and insurance 21.9%, government 9.3%, commercial property 5.8%, with impaired-asset ratios.
Donut chart beside a detailed industry table.
Outstandings of $62.8b (7.5% of gross loans and advances) by region and sector (retail, office, industrial, residential); 79% well secured.
Charts by region and sector with a collateral panel.
EAD of $567b by market of incorporation and tenor, with Asia at $119b and China at $16b, plus industry, product and country donuts.
Grid of donut charts and a stacked bar.
97% investment grade; China corporate exposure of $3.4b, down from $8.4b in 2020; industry and product donuts.
Key callouts on the left with donut charts on the right.
Excluding Suncorp: 936k accounts, FUM $341b, average loan $365k, owner-occupied 68%, investor 31%, interest-only 10%, broker 61%. Average LVR at origination 65%, dynamic LVR 41%, market share 13.5%, 89% ahead of repayments, offset balances $52b, loss rate 0.01%.
Two stacked metric tables with headers.
Home loan composition by purpose and by state (VIC/TAS, NSW/ACT, QLD, WA, SA/NT), shown as stacked percentage bars for FY23 to FY25.
Series of stacked percentage bar charts.
Repayment-ahead profile, dynamic LVR buckets (5.2% above 90% and 1.8% in negative equity) and offset balances rising from $36b to $52b (15% of balances).
Grid of bar charts with buffer metrics.
90+ days past due by state from September 2022 to September 2025, delinquency lines since 2019 and 90+ DPD by vintage curves.
Three line charts in a row.
ANZLMI FY25 gross written premium $82.4m, net claims $3.7m and loss rate 1.4 bps. 95% of new FUM is not LMI insured; reinsurance includes quota share above 90% LVR and aggregate stop loss above 80% LVR.
Industry premium bars, a metrics table and a reinsurance structure diagram.
572k accounts, NZ$116b FUM, market share 30.0%, owner-occupied 78%, fixed rate 89% and average dynamic LVR 44%, with LVR and region pies (Auckland 43%).
Metrics table beside two pie charts.
Divider introducing the ESG section.
White slide with large headline, section caption and logo at bottom right.
Seven material issues listed in a blue panel, with thumbnails of the 2025 ESG Report, Climate Report, ESG Data and Frameworks Pack, Climate Change Commitment and Energy Customer Approach.
Blue list panel beside a row of report cover thumbnails.
Targets table: $10b social housing ($7.37b funded since 2018), $100b social and environmental (A$84.72b since April 2023), sectoral pathways (8 on track, 2 close), operational emissions -85% by 2030 and gender targets.
Full-width target table with progress column.
Vision, ambition and action pillars grid with 2025 outcomes: 77 LEEP customers at Mature, 159 sustainable finance deals totalling $165b, and an Intellihub green loan of about $3b.
Pillars grid with an outcomes panel and case example.
Customers by assessed maturity: 24 Emerging, 49 Progressing and 77 Mature, with descriptions of each phase.
Horizontal stacked bar with phase description cards.
Table of ten sectors with 2030 interim targets and status; aviation and shipping are close to on-track and the others are on track.
Table with sector icons, target and status columns.
Climate risk within the Group Risk Management Framework, with four numbered focus areas including use of generative AI in the Climate Change Risk Assessment tool.
Framework diagram with four numbered focus blocks.
Resources EAD fell from $16.2b (September 2016) to $10.6b (September 2025); thermal coal mining EAD is down to about $0.1b; oil and gas extraction target of -40% met at $4.9b.
Trend bar and line charts with target callouts.
Divider introducing the Economics section.
White slide with large headline, section caption and logo at bottom right.
ANZ Research forecast table for 2020 to 2026F (as at 6 November 2025): Australia GDP 1.8% in 2025F and 2.5% in 2026F, RBA cash rate 3.60% in 2025; NZ GDP 0.3% and 2.6%, OCR 2.25%.
Full-width forecast table with historical and forecast columns.
Cross-country scorecard of GDP, CPI, policy rate, 2-year swap spread, 10-year yield, unemployment, current account, budget, net debt and S&P rating for Australia (AAA), UK, France, Germany, US, Canada and New Zealand.
Dense comparison table with a row per country.
ANZ Research house price forecasts by city (2022 to 2026F bar chart) alongside Cotality and REINZ price-change tables.
Clustered bar chart with two data tables.
Four line charts: CPI versus trimmed mean, unemployment at 4.5%, ANZ-Indeed Job Ads and the cash rate path to 3.35%.
Two-by-two grid of small line charts under a message headline.
Four charts covering GDP growth of 0.6% q/q, household consumption, public final demand and productivity.
Two-by-two grid of charts.
Four charts: non-financial debt to GDP, government net debt, household debt to income and mortgage arrears.
Two-by-two grid of line charts.
Top export destinations (China A$195.5b, 30.4%; then Japan, South Korea, US, India) and top exports (iron ore A$124.5b; then coal, natural gas, education-related travel and gold).
Two ranked tables side by side.
ANZ Group Treasury and Debt Investor Relations contact cards (including Group Treasurer Adrian Went, Head of Debt IR David Goode and Head of Group Funding Scott Gifford), Norfina Ltd (Suncorp Bank) treasury contacts, Debt Investors Centre screenshots and general mailboxes.
Grid of contact cards with photos plus website screenshots.
Συχνές ερωτήσεις σχετικά με αυτή τη διαφάνεια και το βασικό περιεχόμενο παρουσίασης.
A debt investor presentation is aimed at bondholders and credit analysts rather than shareholders. Instead of focusing on earnings per share and dividends, it spends most of its pages on capital ratios, liquidity, term funding plans, credit ratings, Tier 2 and AT1 instruments, asset quality and the macro outlook. ANZ's pack has dedicated Group Treasury and Risk Management and Housing sections, which an equity results deck normally covers in far less detail.
ANZ's financial year runs from 1 October to 30 September, so FY25 covers October 2024 to September 2025. This differs from the July to June financial year used by most ASX-listed companies, so compare results with other companies carefully.
CET1 is 12.0% on the APRA Level 2 basis and 17.6% on a Basel Harmonised basis. The average liquidity coverage ratio is 132% and the net stable funding ratio is 115%. ANZ issued $37b of term wholesale funding in FY25 and expects about $35b in FY26. Amounts are in Australian dollars unless marked NZ$.
The original is written for fixed-income and professional investors: holders and prospective buyers of senior unsecured, covered bond, Tier 2 and AT1 securities, as well as credit analysts and rating agencies. It is also useful to students and finance professionals who want to see how a major bank discloses capital, funding and credit risk.
You can download it to read offline and to study the structure: a strategy overview, financial results, a Group Treasury section, credit risk and housing detail, ESG, economics and contacts, separated by section dividers. The content, figures and branding belong to ANZ, so you should replace them with your own and not present ANZ material as yours.
It has 79 slides: cover and disclaimers, strategy and priorities, Financial Results, Group Treasury, Risk Management and Housing, ESG, Economics and Key Contacts. Each major section starts with a divider slide.
It covers net loans and deposits by division, regulatory capital and the Basel Harmonised reconciliation, RWA movements, NSFR and LCR, term wholesale funding with credit ratings, the Tier 2 and AT1 portfolio, a global TLAC comparison, the prudential outlook, the RBNZ capital review and the capital and replicating deposits portfolio.
The original is published on ANZ's Debt Investors Centre at anz.com/debtinvestors by ANZ Group Treasury. ANZ's equity-focused results materials, including the results announcement and investor discussion pack, are on its results announcements page.
Official source for ANZ debt investor presentations, funding programs and credit ratings
Full year results announcement, investor discussion pack and equity results presentation

Create Your Own Slides
Turn your ideas into professional presentations in seconds with 2slides AI.
Αναφερθείτε σε επαγγελματικές σχεδιάσεις, επιλέξτε το στυλ σας και δημιουργήστε σλάιντ με τέλεια απόδοση κειμένου. Τροφοδοτείται από το Nano Banana—ξεκινήστε να δημιουργείτε την παρουσίασή σας τώρα.
Ο Πράκτορας AI σας για διαφάνειες. Εξοικονομήστε χρόνο, λάμψτε πιο γρήγορα με έξυπνη δημιουργία παρουσιάσεων.


© 2026 2slides. Όλα τα δικαιώματα διατηρούνται.