
ضمن مجموعة أمثلة عروض المستثمرين
Wistron Investor Presentation November 2026 is an 18-slide English-language investor deck from Wistron Corporation, a Taiwan-based OEM/ODM maker of PCs, servers and AI computing hardware. It was filed on Taiwan's Market Observation Post System (MOPS) on 11 November 2026 for a broker-hosted investor conference (法說會) on 12 November 2026, and a Chinese version also exists. It covers the company profile, its evolution from PC to AI, growth platforms, manufacturing footprint, ESG recognition, and financials for 2021-2025 and 1-3Q 2026, with amounts in NT$ (New Taiwan dollars).
يستخدم غلاف هذا العرض مرجعًا للنمط لإنشاء شرائح من محتواك الخاص. أو اختر أي صفحة أدناه لاستخدام تخطيطها مرجعًا.
التنقل السريع
العلامات
مشاركة الشرائح
Wistron Investor Presentation November 2026 is an 18-slide English-language investor deck from Wistron Corporation, a Taiwan-based OEM/ODM maker of PCs, servers and AI computing hardware. It was filed on Taiwan's Market Observation Post System (MOPS) on 11 November 2026 for a broker-hosted investor conference (法說會) on 12 November 2026, and a Chinese version also exists. It covers the company profile, its evolution from PC to AI, growth platforms, manufacturing footprint, ESG recognition, and financials for 2021-2025 and 1-3Q 2026, with amounts in NT$ (New Taiwan dollars).
عرض تفصيلي لكل صفحة شريحة، بما في ذلك التخطيط والمحتوى الرئيسي والعناصر المرئية.
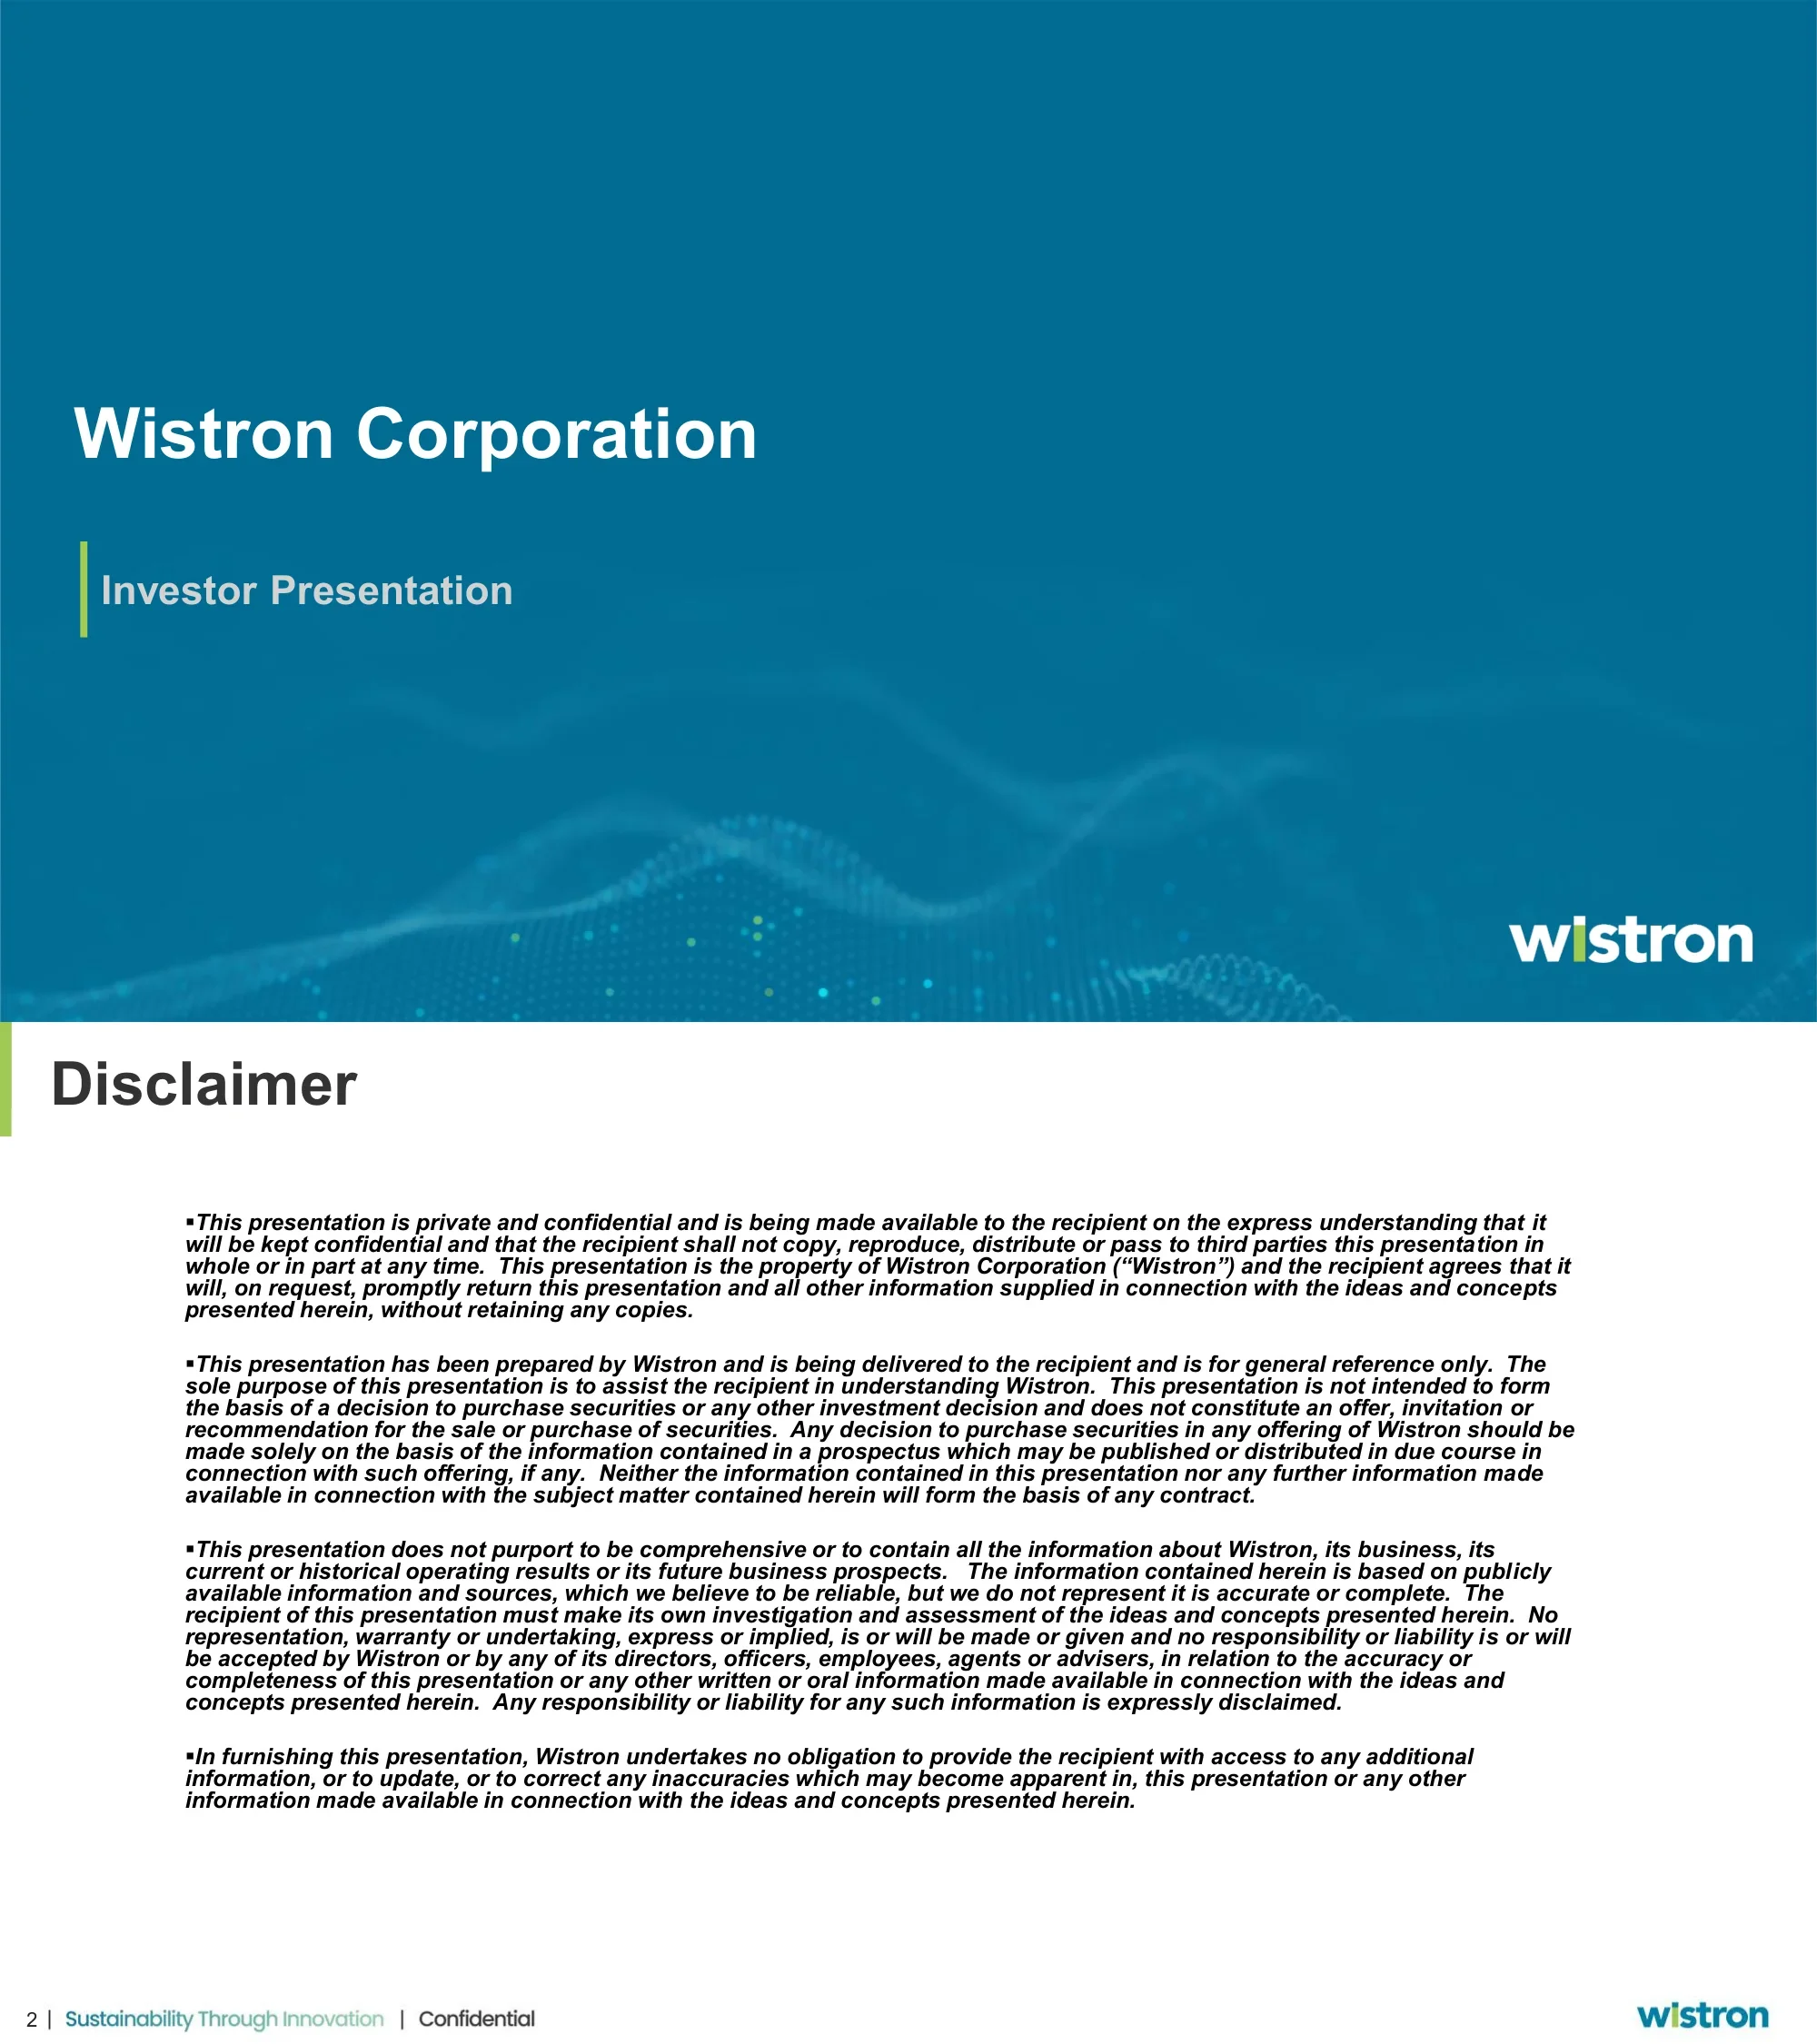
Title slide naming Wistron Corporation and the document type, Investor Presentation. No date or presenter is shown on the slide.
Left-aligned white title and a lighter subtitle with a green vertical accent bar on a solid teal-blue background. Wistron logo sits at the bottom right.
Four bullet paragraphs of legal language. The presentation is described as private and confidential and for general reference only. It is not an offer or recommendation to buy or sell securities, does not purport to be comprehensive, and Wistron undertakes no obligation to update it.
Title at the top left with a green accent bar, followed by a single wide block of dense italic bold text. Footer reads Sustainability Through Innovation | Confidential with the logo at the right.
Four headline facts: a leading OEM/ODM partner to the world's top 10 technology companies, 22 global operating locations, 63,000+ employees, and Fortune Global 500 No. 198 in 2026.
Four rounded shapes of different forms (rectangle, circle, square, pill) in green-to-blue gradients arranged as a loose cluster, each with one large number.
Three eras are compared. Wistron 1.0 (pre-2010) focused on PC with Dell and HP as key customers, US$1.8bn market capitalization, NT$615B revenue, ~20% non-consumer revenue and ~29% revenue CAGR. Wistron 2.0 (2011-2022) added mobile and server, US$2.4bn, NT$759B, ~50% and ~4%. Wistron 3.0 (Now) is AI-focused with customers including NVIDIA, AMD, Oracle, Meta, Dell, Cisco, Microsoft Azure and AWS, US$28.3bn, ~NT$4.0T, ~90% and ~59%.
Three-column chevron timeline in blue, orange and green, with a row-label legend on the left (product focus, key customers, market capitalization, revenue, non-consumer revenue %, revenue CAGR %).
Under Pioneer Over Time, Wistron lists product areas where it ranks Top 1 (AI server / AI compute devices, enterprise mobility), Top 2 (network security device, desktop PC, ICT after-sales services by revenue) and Top 3 (notebook PC, display monitor, enterprise server MB). AI exposure: NT$2.9tn 1-3Q26 revenue, up 97% YoY; 80% AI revenue contribution in 1-3Q'26; NT$27.4bn 2025 net income, up 57% YoY. Future growth platforms are AI, network, enterprise and industrial compute and after services, plus AI for the next (autonomous vehicles, automation, next-gen communications).
Ascending staircase graphic with a green arrow rising to the right across three steps: grey Pioneer Over Time, blue AI Exposure, green in the Future. Metrics sit in pill callouts and growth platforms in a grey rounded panel with circular icons.
Core Business: notebook, desktop, display monitor, and docking / VoIP / peripherals. Growth Platforms: AI Compute (AI servers, AI components), Network Compute (switches, network security), Enterprise Compute (general servers, storage), Industrial Compute (IPC, enterprise mobility), After-Sales Services (reconfiguration, repair, spare part management). Next Engines: autonomous vehicles, automation, next-generation communications.
Three columns on a horizontal arrow band colored blue, orange and green, each with a circular illustration and a vertical list of icon-labeled items beneath.
Three blocks: (1) the core backbone of AI components and OEM AI solutions with NVIDIA, AMD, Dell, HP and Lenovo, shown with an L10 compute tray and L6 compute board; (2) new growth engines through Wistron plus Wiwynn for cloud service provider exposure (Oracle, Meta, Microsoft Azure, AWS) covering NVIDIA, AMD, ASIC and general servers; (3) components and new products, with Cisco networking switches and NVIDIA-related GPU, LPU, CPU, storage and switch boards.
Roof-shaped header with Core Backbone on the left and New Growth Engines on the right, above three numbered columns with partner logos and product photos.
A world map lists sites by country: U.S.A. (Fremont, Dallas: AI components, AI server); Mexico (Juarez: AI / general server); Czech Republic (Brno: general server); Vietnam (Tinh Ninh Binh: NB, IPC, DT, display, general server, networking); Malaysia (Port Klang: industrial handheld); China (Chongqing, Chengdu, Kunshan, Zhongshan); Taiwan (Hsinchu: AI components, AI / general server, IPC, storage, networking; Kaohsiung: LCM module).
Grey world map with blue pins connected by green leader lines to country headings and underlined city names with product lists.
A process flow runs from early design engagement, early R&D investment, prototype development and design collaboration, automated manufacturing, high product quality, efficient distribution, after-sales services and reverse logistics. Capability stats: 1,400 software engineers, 7,400 engineers, 6,400 patents and 1,900 U.S.A. utility patents.
Chevron row across the top that curls into a circular loop around the Wistron logo, with a four-item checkmark list at the lower left.
Wistron Corporation is described as a Forbes Global 500 company supplying innovative ICT products, services and systems, with Wistron Medical Technology and WiAdvance Technology noted beneath. Affiliates: WITS Corp. (contract software development), WNC Corporation (broadband communications, IoT and automotive products), CHANGING Information Technology Inc. (information security), and Wiwynn Corporation (solutions for customers in cloud services).
Circular jigsaw-puzzle ring with the Wistron logo in the center and the parent and four affiliates placed around it with short descriptions.
Recognitions shown: S&P Global Sustainability Yearbook Top 1% (2024-2025), CDP Climate Change / Water Security A List (2024~2025), CDP Climate Change Supplier Engagement leader (2022~2024), Time World's Most Sustainable Companies (2024~2025), MSCI ESG Rating A, ISS ESG Prime, Financial Times Asia-Pacific Climate Leaders and Best Employers Asia-Pacific (2023~2025), plus Taiwanese awards (CommonWealth Magazine corporate citizen award, TCSA Taiwan Corporate Sustainability Awards, and another manufacturing award) and Clarivate Top 100 Global Innovator (2022~2025). Several award labels are in Chinese.
Two rows of award badges and trophies on gold plinths with captions beneath each, five in the top row and six in the bottom row.
Four bar charts for 2022, 2023, 2024, 2025 and 1-3Q'26. Revenue (NT$ B): 985, 867, 1,049, 2,187, 2,891. Operating income (NT$ B): 27.4, 27.4, 39.0, 78.6, 111.3. ROE (%): 12.8, 11.4, 14.7, 17.7, 19.3. EPS (NT$): 4.01, 4.08, 6.11, 9.04, 13.54.
Two-by-two grid of bar charts with blue header bars; the 1-3Q'26 bar in each chart is highlighted in gold, other years in teal or green.
Five-year income statement in NT$ M for 2025 to 2021. Net revenue: 2,186,523; 1,049,256; 867,057; 984,619; 862,083. Operating income: 78,553; 38,979; 27,390; 27,472; 16,375. PAT: 27,408; 17,446; 11,472; 11,162; 10,468. EPS: 9.04, 6.11, 4.08, 4.01, 3.76. Realized gross profit margin runs from 5.9% in 2021 to 6.1% in 2025, with 8.0% in 2023 and 2024. Minority interest and tax lines are also shown.
Wide financial table with years in columns, shaded green rows for key subtotals, small blue percentage columns next to profit lines, and highlighted shares and EPS rows.
1-3Q'2026 vs 1-3Q'2025 in NT$ M: net revenue 2,890,836 vs 1,465,582 (up 97.2%); realized gross profit 162,558 (5.62%) vs 93,474 (6.38%); operating income 111,257 (3.85%) vs 53,080 (3.62%); PBT 97,060 vs 54,988; PAT 42,860 vs 19,242 (up 122.7%); EPS 13.54 vs 6.43 (up 110.6%).
Three-column table with two periods and a YoY column, green-shaded rows for key profit lines and a blue-shaded EPS row.
3Q 2026 vs 2Q 2026 vs 3Q 2025 in NT$ M: net revenue 1,149,090 vs 895,443 (QoQ 28.3%) vs 567,805 (YoY 102.4%); realized gross profit 67,800 (5.90%) vs 50,664 (5.66%) vs 41,965 (7.39%); operating income 48,672 (4.24%) vs 33,447 (3.74%) vs 27,142 (4.78%); PAT 18,402 vs 14,827 vs 7,406; EPS 5.74 vs 4.72 vs 2.36.
Table with three period columns, each followed by QoQ or YoY change columns; green and blue shaded rows for profit subtotals and EPS.
Balance sheet in NT$ M at 2026/09/30, 2026/06/30 and 2025/9/30. Total assets: 1,790,352; 1,573,109; 960,470. Cash and short-term investments: 150,661; 123,164; 77,475. Accounts receivable: 655,596; 574,198; 298,612. Inventory: 641,845; 532,898; 425,314. Total liabilities: 1,407,029; 1,295,841; 733,575. Shareholders' equity: 383,323; 277,268; 226,895. Each line also shows its percent of total assets.
Three-date table with percentage columns, grouped into current assets, total assets, current liabilities, long-term liabilities and equity, with shaded subtotal rows.
Cash dividend per share (NT$): 2.2 (2021), 2.6 (2022), 2.6 (2023), 3.8 (2024), 5.5 (2025*). No stock dividends in any year. EPS (NT$): 3.76, 4.01, 4.08, 6.11, 9.04. Cash and total dividend payout: 59%, 65%, 64%, 62%, 61%. The 2025 column is marked with an asterisk; no footnote text is legible on the slide.
Compact five-year table with a red rectangle outlining the 2024 and 2025 columns, which are shown in bold.
Closing slide with a Thank You message and no contact details or additional content.
Left-aligned white text on the same teal-blue wave background as the title slide, with the logo at the bottom right.
أسئلة شائعة حول هذه الشريحة ومحتوى العرض التقديمي الأساسي.
It is an English investor presentation filed on Taiwan's Market Observation Post System (MOPS) on 11 November 2026 for a broker-hosted investor conference (法說會) on 12 November 2026. A Chinese version also exists. This version is in English, with a few Chinese award names on the ESG slide.
Amounts are in NT$ (New Taiwan dollars). The deck shows annual results for 2021-2025, 1-3Q 2026 compared with 1-3Q 2025, 3Q 2026 compared with 2Q 2026 and 3Q 2025, and balance sheets at 2026/09/30, 2026/06/30 and 2025/9/30.
Net revenue was NT$2,890,836 million (up 97.2% YoY), operating income NT$111,257 million, PAT NT$42,860 million and EPS NT$13.54, compared with NT$6.43 in 1-3Q 2025.
It describes a shift from PC (Wistron 1.0) to mobile and server (2.0) to AI (3.0). The strategy is organized as core businesses (notebook, desktop, display, peripherals), growth platforms (AI, network, enterprise and industrial compute, after-sales services) and next engines (autonomous vehicles, automation, next-generation communications).
Yes. Slide 17 lists cash dividends per share of NT$2.2, 2.6, 2.6, 3.8 and 5.5 for 2021 to 2025, with no stock dividends, alongside EPS and payout ratios of 59%, 65%, 64%, 62% and 61%. The 2025 column carries an asterisk.
It is a good reference for structure. It opens with a title and disclaimer, moves through company profile, strategy, footprint and ESG, then ends with charts, income statements, balance sheets and a dividend table. Every content slide has a left accent bar, a tagline footer and a logo.
No numeric guidance or outlook figures appear on the slides. The forward-looking content is qualitative, covering growth platforms and next engines, and the disclaimer states the deck is not investment advice.
No. This page is a descriptive summary of the slides. For the authoritative figures, consult the original filing on MOPS and the company's own financial statements.

Create Your Own Slides
Turn your ideas into professional presentations in seconds with 2slides AI.
راجع التصاميم الاحترافية، اختر أسلوبك، وأنشئ شرائح بعرض نصي مثالي. مدعوم بـ Nano Banana—ابدأ في إنشاء عرضك التقديمي الآن.
وكيل الذكاء الاصطناعي الخاص بك للشرائح. وفر الوقت، أشرق بشكل أسرع مع إنشاء عروض تقديمية ذكية.


© 2026 2slides. جميع الحقوق محفوظة.