
ضمن مجموعة أمثلة عروض المستثمرين
Weyerhaeuser Investor Presentation November 2026 — Weyerhaeuser's 74-slide investor deck, filed with the SEC as an exhibit (Exhibit 99.1) to Form 8-K, covering its timberlands, strategic land solutions and wood products businesses, the targeted $1.5 billion of incremental Adjusted EBITDA by 2030, capital allocation, ESG record and non-GAAP reconciliations.
يستخدم غلاف هذا العرض مرجعًا للنمط لإنشاء شرائح من محتواك الخاص. أو اختر أي صفحة أدناه لاستخدام تخطيطها مرجعًا.
التنقل السريع
العلامات
مشاركة الشرائح
Weyerhaeuser Investor Presentation November 2026 — Weyerhaeuser's 74-slide investor deck, filed with the SEC as an exhibit (Exhibit 99.1) to Form 8-K, covering its timberlands, strategic land solutions and wood products businesses, the targeted $1.5 billion of incremental Adjusted EBITDA by 2030, capital allocation, ESG record and non-GAAP reconciliations.
عرض تفصيلي لكل صفحة شريحة، بما في ذلك التخطيط والمحتوى الرئيسي والعناصر المرئية.
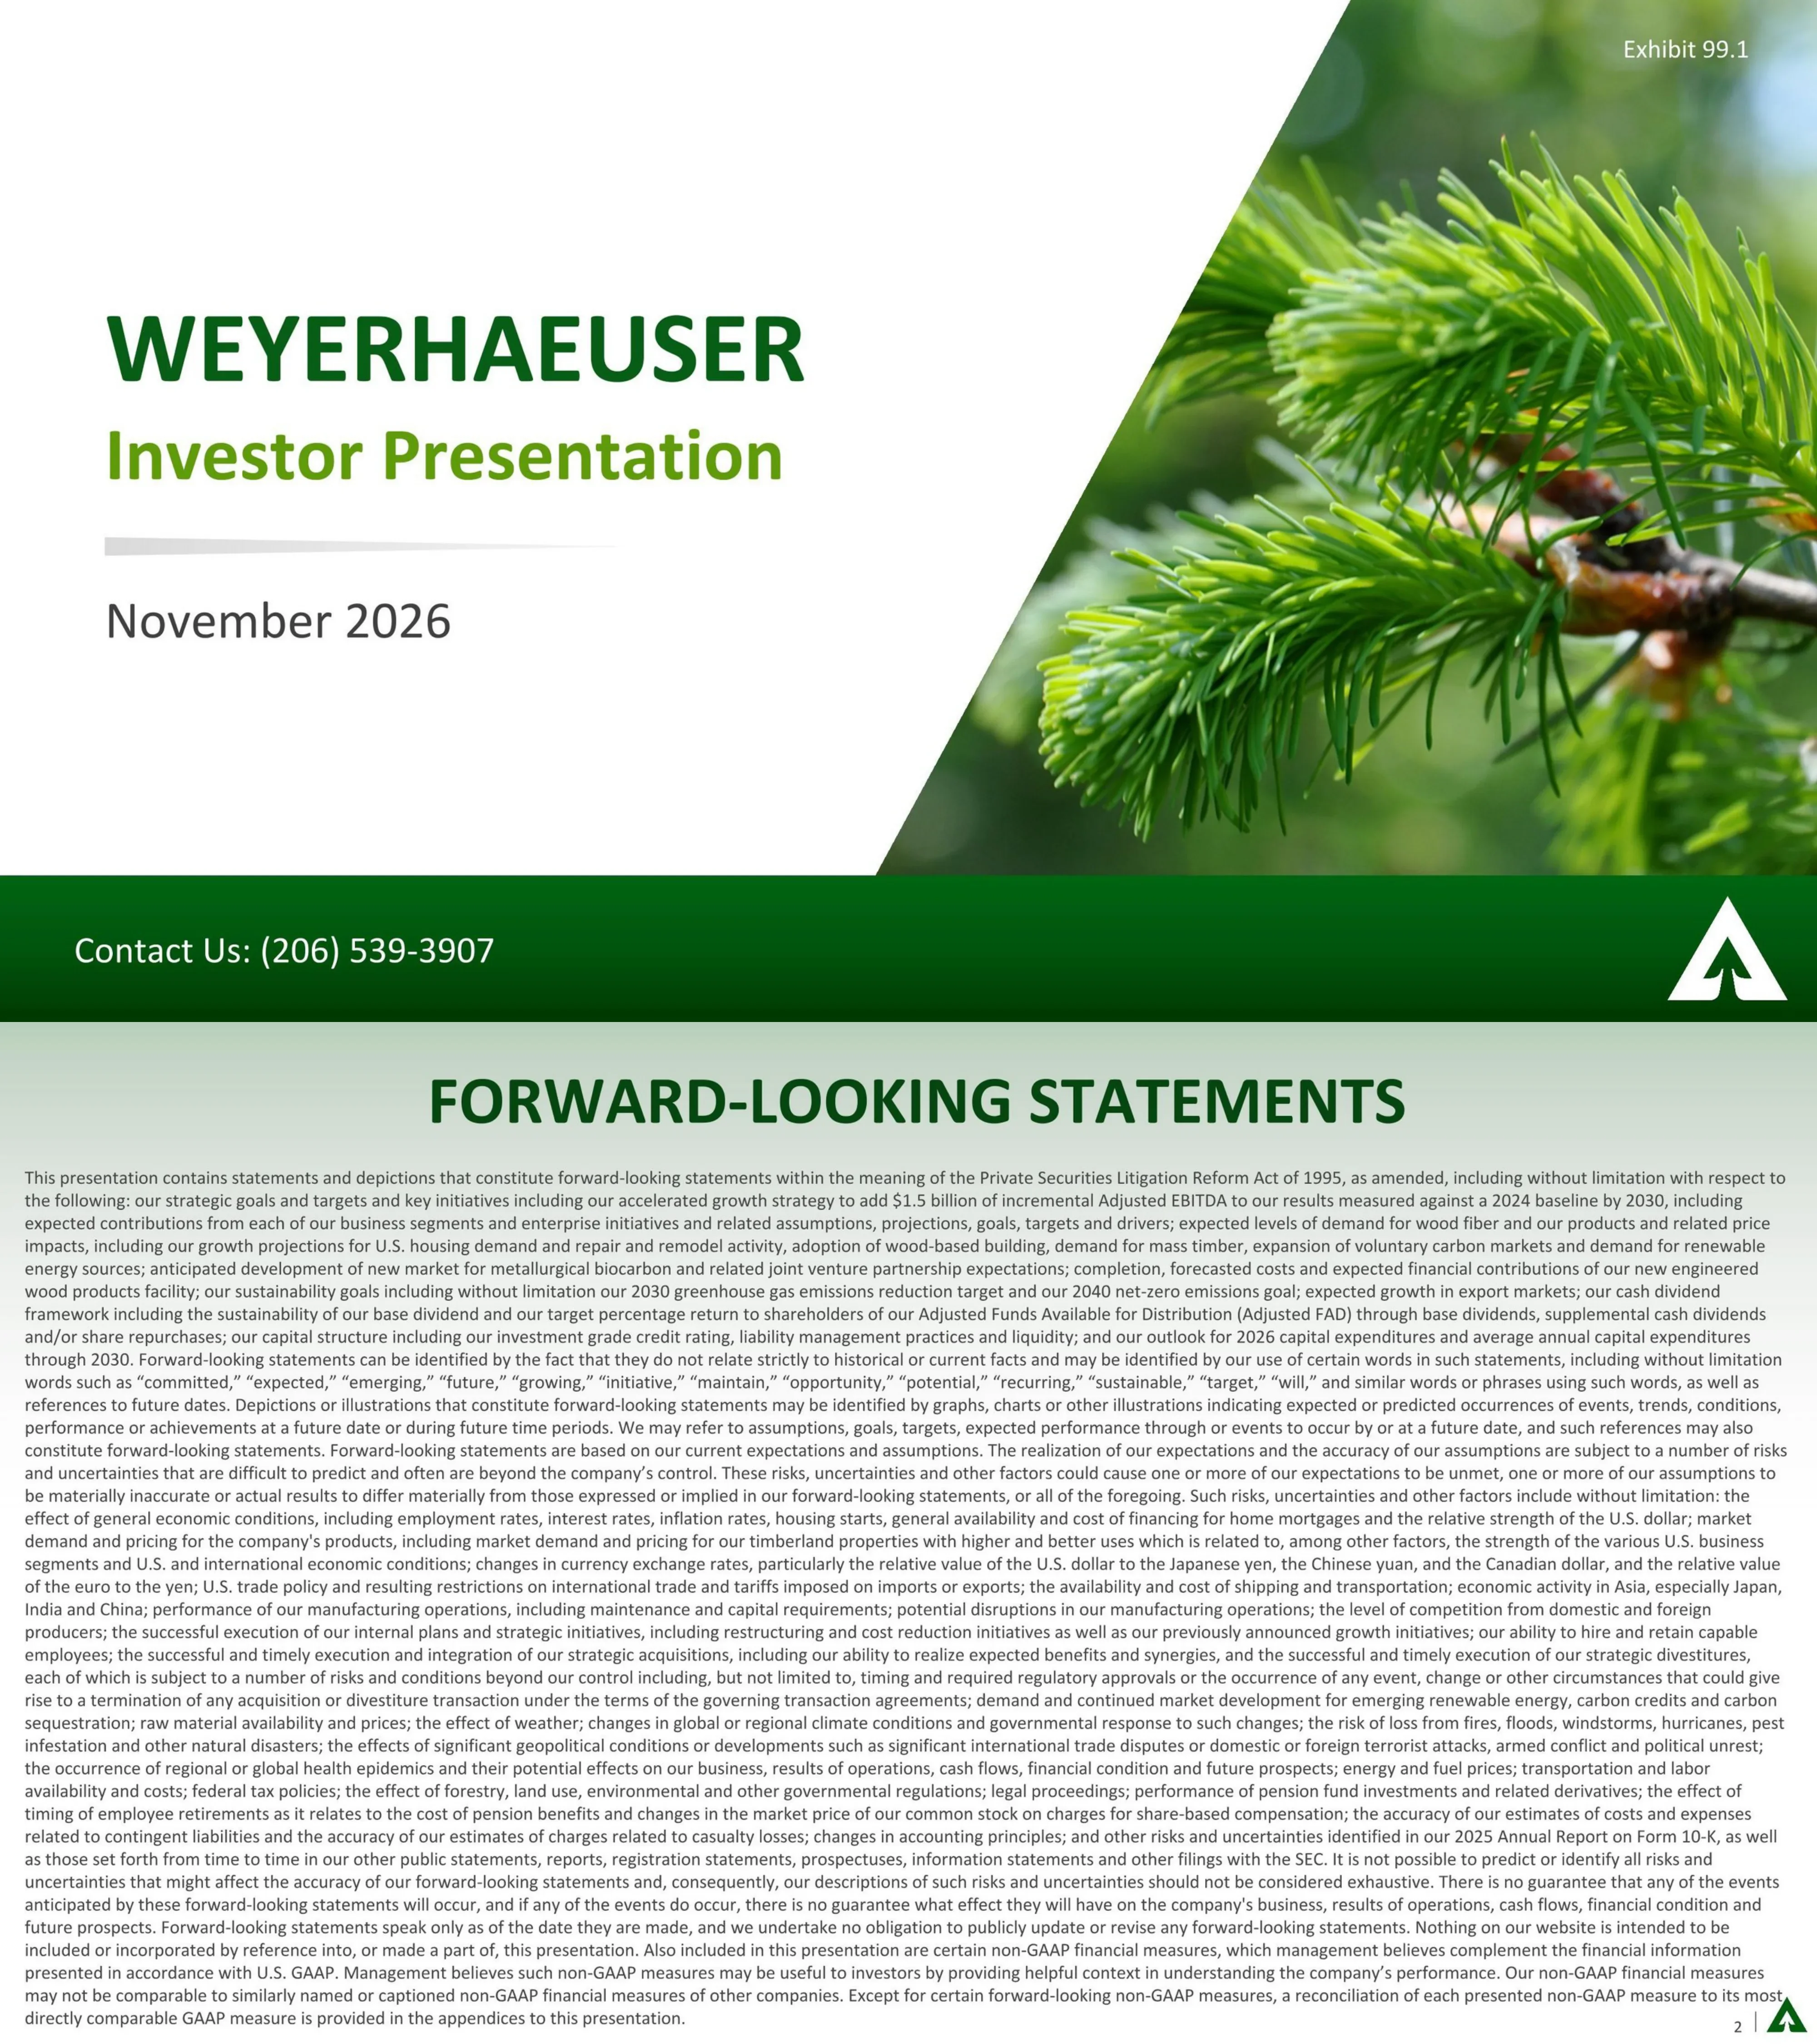
Title slide dated November 2026, marked Exhibit 99.1, with a contact phone number (206) 539-3907 in the footer.
Left-aligned title block on white with a diagonal-cropped conifer photo on the right and a green footer band with the logo.
Legal disclaimer covering forward-looking statements, including the goal of adding $1.5 billion of incremental Adjusted EBITDA by 2030 against a 2024 baseline, dividend framework, capital expenditures outlook and risk factors. It also notes the use of non-GAAP measures reconciled in the appendices.
Title at top and a single dense full-width paragraph of small text.
Six sections: Company Overview, Unmatched Portfolio, Industry-Leading Performance, Disciplined Capital Allocation, Strong ESG Foundation, and Appendix. A footnote says Strategic Land Solutions is the new segment name for Real Estate, Energy & Natural Resources, effective 2026 Q1.
Left column with six arrow-marked agenda items and sub-topics; full-height spruce photo on the right.
Driving superior shareholder value through four pillars: Unmatched Portfolio, Industry-Leading Performance, Disciplined Capital Allocation and Accelerated Growth, built on foundational strengths of expertise, sustainability, operational excellence and innovation.
Four photo panels joined by plus signs with icons and labels, and a dark banner of foundational strengths below.
Four businesses: Timberlands (largest private owner in North America; 10+ million acres held in the U.S. and 13 million acres licensed in Canada), Strategic Land Solutions, Wood Products (33 manufacturing facilities and 22 distribution centers), and Value Accelerators.
Four photo columns with headings and bullet text, a bottom banner and footnotes.
Nine-step value chain from proprietary seedlings through customized planting, silviculture, healthy forests, harvest and haul, delivered log model, optimal raw materials and low-cost production to a diverse customer mix. Real Estate, Climate Solutions and Natural Resources are shown as complementary value streams.
Nine photo strip with chevrons and captions across the top, three circular-icon descriptions along the bottom.
Successful delivery of 2025 year-end targets: more than $1.2B of Timberlands acquisitions (2022-2025) with ~$850MM divested, Climate Solutions annual Adjusted EBITDA of $119MM in 2025, nearly 1BBF of incremental lumber production, ~$210MM of OpX improvements, and more than $6B returned to shareholders in 2021-2025, with base dividend increased by at least 5% annually.
Five tall columns (three photo cards with outcome arrows, one blue and one green panel) and footnotes below.
New strategy built on a strong foundation, catalyzing growth and enhancing cash flow per share, targeting $1.5 billion of incremental Adjusted EBITDA by 2030 measured against a 2024 baseline. The cash return target remains at 75-80% of Adjusted FAD annually.
Three boxes flowing by arrow to a circle with the $1.5 billion target, a banner below, over a forest photo.
Bar roadmap of Adjusted EBITDA uplift in millions: Timberlands +$150, Strategic Land Solutions +$230, Wood Products +$440 and Enterprise Initiatives +$180 add up to +$1,000 of identified growth initiatives. A modest product pricing uplift of +$500 brings the total to +$1,500 by 2030, measured against a 2024 baseline.
Waterfall-style column chart with image-filled bars, a bracket over identified initiatives, and footnotes at the bottom.
Growth levers are grouped by Timberlands, Strategic Land Solutions, Wood Products and Enterprise Initiatives under a banner of $1 billion of line-of-sight growth initiatives by 2030. Examples include Western harvest volume increase, forest carbon, the Monticello TimberStrand facility and artificial intelligence. A separate row lists additional potential catalysts such as sawlog pricing uplift and larger-scale M&A.
Four photo headers with bulleted lever lists in columns, a green banner above and a dark banner for additional catalysts below.
Four long-term demand drivers: U.S. housing and repair and remodel demand, increased adoption of wood-based building (mass timber demand expected to increase 150% by 2030), rising global demand for wood fiber, and increased demand for climate solutions. Sources cited include the FEA Global Mass Timber Service 2025 Annual Report and Harvard Business Review, September 2025.
Four colored header columns with photos, down arrows and three supporting bullets each.
Section divider titled Unmatched Portfolio with the line that quality, diversity and scale cannot be replicated, listing Timberlands, Strategic Land Solutions and Wood Products.
Left-aligned title and three arrow-marked items with a diagonal-cropped forest photo on the right.
Timberlands acreage by region: West 2.5 million acres (high-value Douglas fir), South 6.6 million acres (premium southern yellow pine) and North 1.2 million acres (diverse hardwoods and softwoods). Callouts say largest private timberlands owner in the U.S., 125 years of expertise and a significant supplier in every region; an additional 13 million acres are licensed in Canada.
Left stack of three green arrow callouts and three regional map panels with blue headers on the right.
Timberlands delivered ~$650 million of Adjusted EBITDA as a 5-year average. Revenue by end market (2021-2025) is Third-Party Domestic 53%, WY Mills 26% and Export 21%; Adjusted EBITDA by region is West 54%, South 45% and North 1%. Growth initiatives add $150 million of Adjusted EBITDA uplift by 2030.
Left competitive advantages checklist and four-photo growth initiatives grid; right headline figure and two pie charts.
The slide positions Weyerhaeuser as the largest timber REIT, with 10.3 million U.S. acres versus 4.1 for Rayonier. Log sales are 76% third-party for WY versus 87% for RYN, and the delivered model is 89% delivered versus 62% for RYN. It claims first in silviculture and harvesting costs and #1 Adjusted EBITDA per acre in the West.
Four quadrants: ownership map with table, two bar charts, and a badge callout over a forest photo.
Export log revenue by end market (2021-2025): Japan 73%, China 18%, Korea 7% and India 2%. Highlights include a unique Japan export business and the largest log export facility in North America, summarized as scale plus consistent product quality plus supply chain reliability equals export competitive advantage.
Left checklists in two sections, right world map with export routes and a pie chart, and a dark banner at the bottom.
Weyerhaeuser holds 2.5 million western acres versus 0.9 for Rayonier, with the #1 position in Adjusted EBITDA per acre and sawlogs at approximately 90% of harvest volume. Timber inventory is 83% Douglas fir, 11% whitewood and 6% other; about 2 million tons are shipped to export markets, with western log sales 76% domestic and 24% export.
Left ownership map with table; right checklist above two pie charts; footnotes at bottom.
Southern holdings are grouped into AR/OK/TX/LA, MS/AL, GA/FL/SC and NC/VA, with a callout that ~70% of new sawmill capacity is in states with strong WY holdings. A stacked bar compares WY with RYN, with WY at roughly 6,600 thousand acres versus about 3,100 for RYN (read from the chart axis, approximate).
Left map with circled sub-regions and stacked bar chart below; right five-point checklist.
Timberlands A&D 2020-2026: acquisitions of 530 thousand acres versus divestitures of 1,340 (net -810 thousand acres), harvest tons of 3,260 versus 1,810 thousand (+1.5 million tons), timber free cash flow yield of 4.3% versus 1.0% (+3.3%), and timber free cash flow of $76 million versus $18 million (+$58 million). About $1.8 billion was deployed into acquisitions and about $1.8 billion generated from divestitures.
Left paired bar rows with net-change arrows; right two rounded callout boxes over a forest photo.
Seven circular callouts: more than 100 million trees planted each year, 100% of timberlands reforested after harvest, only 2% of forests harvested on average each year, 100% certified to the Sustainable Forestry Initiative standard, tree buffers along waterways, conservation agreements, and working forests contributing to climate change solutions.
Seven staggered white circles over a misty forest photo with a bottom banner.
Three distinct business lines (Real Estate, Natural Resources, Climate Solutions) drive value across the portfolio. End-to-end portfolio management covers 10+ million acres across the West, South and North.
Three photo panels with a blue banner, and a map strip with a wide arrow beneath.
Segment Adjusted EBITDA of ~$340 million as a 5-year average. Run rate grew from $241 million in 2020 to $320 million in 2023 and $411 million in 2025 across Real Estate, Natural Resources and Climate Solutions (2025: $203, $89 and $119 million). Growth initiatives add $230 million of uplift by 2030.
Left advantages list and photo grid; right headline figure and stacked column chart.
Real Estate: 1+ million acres identified for higher and better use, typically selling under 1% of timberland acres annually, with more than 150,000 acres of development potential; HBU acreage is South 81%, West 11%, North 8%. Natural Resources: 46 active quarries with ~30 million tons of annual production serving 18 markets.
Two halves: Real Estate with pie and development circle on left, Natural Resources construction materials list on right.
Four lines: forest carbon (5 approved projects, 700K+ credits issued 2023-2025), renewable energy (8 wind projects online, 2 solar online, 5 under construction), carbon capture and sequestration (2 agreements, 500K+ suitable acres), and mitigation and conservation (18 active mitigation banks on more than 28K acres). Value uplift ranges from 1.5x to 12-15x depending on the line.
Four-column matrix with rows for current portfolio, value uplift and competitive advantages.
Target of ~$250 million of annual Adjusted EBITDA by 2030. Mitigation and conservation is expected to be steady through 2030, forest carbon and renewables are the primary growth engines, and biocarbon is a new business launched in December 2025 through a partnership with Aymium.
Three colored panels joined by plus signs with circular icons over a stream photo, plus a bottom banner.
Biocarbon is a carbon-rich solid produced from biomass and used as a drop-in replacement for coal and coke in steel and metals production. The slide cites a 1.2 billion-ton metallurgical coal market, where 1% replacement equals 60 million tons of fiber.
Three panels (definition with process flow icons, market potential, 1% replacement callout) above a strip of wood fiber photos.
Weyerhaeuser plus Aymium form a biocarbon platform, with a goal of partnering to deliver 1.5 million tons of biocarbon by 2030 (memorandum of understanding in place; target subject to definitive agreements). Plan: explore 7-10 sites, up to 20+ biocarbon processors and potential for 7+ million tons of fiber; a JV is executed for the first facility at WY's McComb, MS lumber mill with construction commenced in 2026.
Top equation banner with logos, left proof-points panel, right growth strategy panel with three stat boxes.
Weyerhaeuser is the 2nd largest lumber producer (17 mills, 5.2 BBF), 4th largest in OSB (6 mills, 3.2 BSF) and #1 in engineered wood capacity (6 EWP facilities, 42 MMCF), with 22 distribution centers. A new TimberStrand EWP facility is under construction in the U.S. South.
Left product list with photos and North America facility map on the right with legend and callouts.
Wood Products is #1 in Adjusted EBITDA margin in all manufacturing businesses (5-year average). 2025 sales by end market: new residential 66%, repair and remodel 18%, non-residential 16%. Adjusted EBITDA by business (2021-2025): OSB 35%, lumber 35%, EWP 23%, distribution 7%; growth initiatives add $440 million of uplift by 2030.
Left advantages list and four-photo growth grid; right headline and two pie charts.
Commodity price sensitivity: for every $10 change in product pricing, about $50MM of EBITDA annually for lumber and $30MM for OSB. OSB has a portfolio-leading RONA of ~90% and supplies 100% of webstock to WY EWP.
Two photo halves with green ovals of claims, a gray sensitivity band, and a row of competitive advantages below.
EWP delivers ~$370MM of annual Adjusted EBITDA and a 25% Adjusted EBITDA margin (5-year averages). Third-party sales by product in 2025: I-joists 27%, Parallam PSL 20%, TimberStrand LSL 17%, Microllam LVL 14%, plywood 11%, MDF 11%.
Three columns (advantages, financials, pie chart) above a photo strip of solid section products and I-joists.
New TimberStrand facility in Monticello, Arkansas adds 10 million cubic feet of capacity, increasing total company EWP capacity by ~24%, and is expected to generate $100+ million of annual Adjusted EBITDA at full operating capacity. Construction commenced in 2025 with startup expected in mid-2027; total investment expected to be moderately higher than $500 million between 2025 and 2027.
Left text sections and highlighted EBITDA box; right brown benefits panel above a photo.
22 distribution centers cover ~75% of the new residential construction market, with more than 30,000 SKUs. 2025 sales by product category: EWP 39%, Specialty 20%, Commodity 20%, Siding 14%, Outdoor Living 7%; about 40% of Distribution sales are WY EWP.
Advantages list and pie chart panels over a lumber yard photo, with two circular stat callouts on the right and a banner at the bottom.
Enhanced product mix: lumber 44% high-value products, OSB 53% enhanced products, EWP 91% enhanced products, and distribution with EWP 39%, specialty 41% and commodity 20%. A green panel lists why customers choose Weyerhaeuser, including quality, diverse product mix, geographic fit, reliable supply, significant scale and sustainable practices.
Four pie charts across the left with headers, and a vertical green icon list on the right.
Four callouts: an ambitious target to reduce greenhouse gas emissions by 2030, more than two-thirds of own energy needs met with renewable biomass on average, 99% of wood by-products used to create other products or generate energy, and 100% of wood fiber supply certified to the Sustainable Forestry Initiative standard or certified sourcing standards.
Four white circles over a house-framing photo with a bottom banner.
Section divider with the line significant, sustainable margin improvement accelerated by innovation, listing Operational Excellence, Relative Competitive Performance and Innovation.
Left title and three arrow-marked items with a diagonal-cropped stacked lumber photo.
Weyerhaeuser achieved ~$210 million in OpX from 2022-2025 across Timberlands and Wood Products, with cross-business OpX between them. OpX 2.0 expands reach through future value, cost avoidance, efficiency and cross-business OpX.
Left panel with two circular photos and cross-business arrows; right list of four icon items.
OpX scorecard: Weyerhaeuser holds the #1 position in Adjusted EBITDA margin in all manufacturing businesses (5-year average) and #1 in Adjusted EBITDA per acre in Western Timberlands. Four line charts compare Weyerhaeuser versus peers from 2011 to 2025 for lumber, OSB, engineered wood products and distribution.
Left two badge photo panels; right 2x2 grid of line charts with footnotes below.
Innovation focus areas shown as four photo quadrants: unmanned autonomous vehicles, energy-efficient equipment, automation and robotics, and artificial intelligence and machine learning.
2x2 grid of full-bleed photos, each with an icon and label.
Section divider on a long-term commitment to balancing three key priorities: Shareholder Returns, Capital Expenditures and Capital Structure.
Left title with three arrow-marked items and a diagonal-cropped pine needle photo.
Flexible framework with three priorities: return cash to shareholders, invest in our businesses and maintain an appropriate capital structure. Core allocation is a sustainable base dividend, disciplined capital expenditures and an investment grade credit rating; opportunistic allocation is share repurchase and supplemental dividend, value-enhancing growth opportunities and liability management.
Three dark headers with arrows over a green core allocation band and a blue opportunistic allocation band of pill-shaped items.
$8.6 billion allocated since implementing the capital allocation framework in 2021 (2021-2025): $5.0B dividends, $2.3B capital expenditures, $1.1B share repurchase and $0.2B net Timberlands investments. Additional actions include a new $1 billion share repurchase authorization in 2025, four consecutive base dividend increases of at least 5%, refinancing ~$2.6 billion of debt and reducing pension obligations by ~$2.2 billion.
Left donut chart with labeled segments and center total; right checklist panel; dark banner and footnotes.
Framework returns 75-80% of Adjusted FAD to shareholders through a sustainable base dividend plus share repurchase and/or supplemental dividend, leaving 20-25% as excess cash for growth, repurchases and debt paydown. The calculation is Adjusted FAD times a 75-80% payout, less quarterly base cash dividends, equals cash available for opportunistic repurchase or supplemental dividend.
Left stacked allocation framework bars; right formula-style calculation box with a circular callout.
Average annual capital expenditures were ~$425 million in 2021-2025 versus a prior target of $420-$440 million, and the 2026-2030 average annual target is $400-$450 million (both excluding the Monticello facility). Illustrative allocation is mostly Wood Products, then Timberlands and a small Corporate share; Wood Products maintenance CapEx is ~$200 million.
Left period comparison boxes around a pie chart; right text panel by segment; bottom banner and footnotes.
Three value levers: Timberlands portfolio improvement (baseline 7-8% ROI), Wood Products investment (most projects greater than 15-20% ROI) and share repurchase (significant return when below intrinsic value). Rows are grouped as execution excellence and strategic benefits.
Three colored columns with icons and two rows of checklists, a ROI footer bar per column and left row labels.
Investment grade ratings of Baa2 (Moody's) and BBB (Standard & Poor's) with a leverage target of 3.5x net debt to Adjusted EBITDA over the cycle. Liability management: refinanced ~$2.9 billion of debt since 2022 Q1, reduced interest expense by more than $100 million since 2019 and pension obligations by ~$5 billion since 2018. Nearly 80% of business assets are in Timberlands and $1.75 billion revolving line of credit is available (data as of September 30, 2026).
Left credit profile with line chart; right liability management panel and two stat boxes.
Debt maturity bar chart in $ millions: 2027 $300, 2028 $800, 2029 $750, 2030 $750, 2031 $550, 2032 $657, 2033 $725, 2052 $450 and 2065 $102. $5.4B of long-term debt outstanding, ~85% fixed rate, weighted average maturity of ~6 years and weighted average interest rate of 5.0% (as of September 30, 2026).
Left bar chart with axis breaks; right bullet list; footnotes below.
Section divider stating sustainability is a core value, listing Sustainability Strategy, ESG Performance and Carbon Record.
Left title with three arrow-marked items and a diagonal-cropped conifer branch photo.
Sustainability strategy has three parts (maintain ESG foundation, improve business alignment, demonstrate positive impact by working on climate action, sustainable homes and thriving rural communities by 2030). ESG performance highlights include more than 100 million trees planted each year, 31 million metric tons of CO2e removed in 2025, $5.9 million of charitable giving in 2025, 9,000+ family-wage jobs and 36% of board directors being women.
Left strategy panel with three icon sections; right ESG performance panel split into environmental, social and governance checklists over a forest photo.
Weyerhaeuser says it removes nearly four times more carbon dioxide than it emits: 10 million mtCO2e emitted and 31 million mtCO2e removed in 2025, with forests storing 2.3-3.7 billion mtCO2e. Science-based emissions targets by 2030 are 42% for Scope 1 and 2 and 25% for Scope 3, with a net-zero commitment by 2040 and Climate Pledge membership.
Four track cards with headers, big figures and illustrations, plus a bottom banner.
Vision of working together to be the world's premier timber, land, and forest products company. How we win combines core values (safety, integrity, citizenship, sustainability, inclusion), relentless focus and key behaviors to produce a truly great company.
Green vision header with employee portrait circles, four columns joined by plus and equals signs, and a dark why-we-matter banner.
Appendix divider listing Market Dynamics & Fundamentals and Supplemental Information.
Left title and two arrow-marked items with a diagonal-cropped pine branch photo.
Qualitative market outlook for lumber, oriented strand board, western logs and southern logs, using up or steady arrows. Examples include steady current R&R activity, softening in single-family construction, composite pricing above recent lows, stable Japanese demand for WY logs and improving southern sawlog demand.
Four photo columns with arrow-marked bullet lists.
As of October 23, 2026, lumber realizations are -$55/MBF for Q4 QTD versus the Q3 average and -$65/MBF current; OSB is +$15/MSF and +$20/MSF. Sensitivities: $10/MBF is about $50 million of annual EBITDA for lumber and $10/MSF is about $30 million for OSB.
Table with product photos, comparison rows and sensitivity cells.
Generation Z and Millennials are the largest population cohorts and have entered peak homebuying years, and the current homebuilding pace will not fully address the deficit from a decade of underbuilding. A bar chart of U.S. population by age and a housing starts versus underlying demand chart support this (sources: CBO, U.S. Census Bureau, FEA).
Bullets at top and two charts side by side.
R&R activity is holding steady, the housing stock continues to age with a median age greater than 40 years, and ~75% of homes were built before 2000. A second chart shows U.S. retail building materials sales rising to a 2026 YTD annualized bar above $500 billion (axis reading, approximate).
Bullets at top and two bar charts side by side.
North American lumber consumption by end use in 2025: repair and remodel 38%, new residential 32%, industrial 23%, non-residential 7%. A framing lumber composite price chart from 2010 to 2026 shows peaks above $1,200/MBF in 2021-2022 (axis reading, approximate) and a Q4 QTD marker as of 11/6/2026.
Bullet list at top with a pie chart and a line chart below.
2025 North American lumber production by region: U.S. South 40%, U.S. West 22%, Other Canada 23%, British Columbia 11%, U.S. Other 4%, out of 55 BBF total. A share-by-region line chart (2011-2025) shows the U.S. South rising and British Columbia declining.
Bullets at top with a pie chart on the left and a multi-line chart on the right.
North American OSB consumption by end use in 2025: new residential 57%, repair and remodel 23%, non-residential 10%, industrial 10%. A 7/16 inch North Central OSB price chart in $/MSF from 2010 to 2026 shows a Q4 QTD marker as of 11/6/2026.
Three bullets at top with a pie chart and a line chart below.
Tensioned market with domestic and export optionality. Western sawlog pricing is shown with a WY sensitivity of $25/MBF, about $30 million of EBITDA annually; a $5/ton change is approximately $40 million of annual EBITDA. Side charts show Japan wood-based housing starts and China softwood log imports (with a U.S. import suspension from March 4, 2025 to November 10, 2025).
Bullets at top, large line chart with a sensitivity circle on the left, area chart and stacked bar chart stacked on the right.
Improving sawlog demand will drive long-term price appreciation, with 10+ BBF of new sawmill capacity completed in 2017-2025 and states encompassing ~60% of WY's southern holdings highlighted. WY sensitivity is $5/ton, about $55 million of EBITDA annually.
Bullets and sawlog price chart on the left with sensitivity circle; right sawmill capacity map and a bar chart by state.
NCREIF Timberland Index of indexed market value per acre by region (Index to 1987 U.S. South = 100), with Northwest rising to roughly 570 and South to roughly 360 by 2025 (read from chart, approximate). Callouts: perpetually growing asset and low correlation with other asset classes.
Large two-line chart on the left and two overlapping circular callouts on the right.
Expanded OpX scorecard comparing Weyerhaeuser versus peers (2011-2025): Timberlands Adjusted EBITDA per acre in the West and South, and Wood Products Adjusted EBITDA margin for lumber, OSB, EWP and distribution. Detailed peer-set footnotes are small and only partly legible at this resolution.
Two framed panels: left two Timberlands line charts, right 2x2 Wood Products line charts, with footnotes below.
Structural lumber capacity of 5.2 billion board feet across 17 facilities (as of December 31, 2025): Southern U.S. 2,910 million board feet in 10 facilities, Western U.S. 1,735 in 5 and Canada 590 in 2. Examples include Dierks, AR at 395 and Santiam, OR at 485 million board feet.
Left capacity callout with lumber photo and three tables of mills by region.
Engineered wood has 42 million cubic feet of solid section and I-joist capacity across 6 facilities, plus 1 MDF facility (Columbia Falls, MT at 265 million sq ft) and 3 plywood facilities totalling 610 million sq ft. OSB capacity is 3.2 billion square feet across 6 facilities, led by Sutton, WV at 675 and Hudson Bay, SK at 600 million sq ft. Data as of December 31, 2025.
Left engineered wood panel with table, middle MDF and plywood tables, right OSB capacity panel with table.
Annual reconciliation 2017-2025 in $ millions from Adjusted EBITDA to GAAP net earnings. Adjusted EBITDA was $2,080 in 2017, peaked at $4,094 in 2021 and was $1,021 in 2025; net earnings (GAAP) were $324 in 2025 versus $2,607 in 2021. Footnotes define Adjusted EBITDA as a non-GAAP measure.
Single wide reconciliation table with years across the top and footnote text below.
Quarterly table for 2017-2021 showing net debt to Adjusted EBITDA (LTM), from 3.6 in 2017 Q1 to 0.8 in 2021 Q4, with total debt, cash, net debt and the Adjusted EBITDA to GAAP net earnings bridge. Table text is very small and only the headline ratio row is clearly legible at this resolution.
Dense quarterly table with 20 quarter columns.
Quarterly table for 2022 to 2026 Q3 showing net debt to Adjusted EBITDA (LTM) rising from 0.9 in 2022 Q1 to 5.0 in 2026 Q3, with net debt of $5,005 million and LTM Adjusted EBITDA of $1,006 million in 2026 Q3. Most other rows are in small print and not fully legible at this resolution.
Dense quarterly table with 19 quarter columns.
Timberlands reconciliation 2011-2025: Weyerhaeuser Timberlands Adjusted EBITDA was $344 million in 2011, $936 million in 2017 and $581 million in 2025, with Western, Southern, Northern and Other Timberlands breakdowns down to net contribution to earnings of $586 million in 2025. Footnotes are small and only partly legible.
Wide table with years 2011-2025 across the top and multi-line footnotes.
Strategic Land Solutions Adjusted EBITDA 2017-2025: total of $241 million in 2017 and $411 million in 2025 (Real Estate $203, Natural Resources $89 and Climate Solutions $119 in 2025). Operating income (GAAP) was $315 million in 2025.
Single table by year with segment line items and footnotes.
Wood Products Adjusted EBITDA 2011-2025 by lumber, OSB, EWP, distribution and other: total of $3,357 million in 2021 and $250 million in 2025 (2025: lumber ($54), OSB $76, EWP $215, distribution $11, other $2). Operating income (GAAP) was $55 million in 2025.
Wide table with years 2011-2025 and footnotes about the Plum Creek merger and non-GAAP definitions.
Effective 2026 Q1, the Real Estate, Energy & Natural Resources segment was renamed Strategic Land Solutions, with business lines updated to Real Estate, Natural Resources and Climate Solutions. A table maps revenue sources (for example conservation, mitigation banking, renewable energy and forest carbon now in Climate Solutions) before and after the change; segment figures for 2025 and prior are unimpacted.
Explanatory paragraph above a before-and-after mapping table with the new structure highlighted.
Annual reconciliation 2017-2025 in $ millions from net cash from operations to Adjusted FAD. Funds available for distribution was $88 million in 2025 versus $2,718 million in 2021, and Adjusted FAD was $397 million in 2025 versus $2,623 million in 2021, with 2025 adjustments for Monticello capital expenditures ($109) and a pension plan contribution ($200).
Single reconciliation table by year with definitional footnotes.
Disclaimer text explaining forward-looking non-GAAP measures used in the deck: free cash flow yield, Adjusted EBITDA multiple and return on investment (ROI), how each is calculated, and why no reconciliation to GAAP is provided.
Title with two paragraphs of text and a large empty lower half.
أسئلة شائعة حول هذه الشريحة ومحتوى العرض التقديمي الأساسي.
It is the Weyerhaeuser Investor Presentation dated November 2026. The cover slide is marked Exhibit 99.1, and the deck was filed with the SEC as an exhibit to Form 8-K.
Weyerhaeuser targets $1.5 billion of incremental Adjusted EBITDA by 2030, measured against a 2024 baseline. The roadmap slide shows +$150 million from Timberlands, +$230 million from Strategic Land Solutions, +$440 million from Wood Products and +$180 million from Enterprise Initiatives (about $1,000 million identified), plus a +$500 million modest product pricing uplift.
It reports $8.6 billion allocated since implementing the capital allocation framework in 2021 (2021-2025): $5.0B dividends, $2.3B capital expenditures, $1.1B share repurchase and $0.2B net Timberlands investments. The target is to return 75-80% of Adjusted FAD to shareholders annually.
As of September 30, 2026, ratings are Baa2 (Moody's) and BBB (Standard & Poor's), the leverage target is 3.5x over the cycle, and $1.75 billion of revolving credit is available. Long-term debt outstanding is $5.4B, about 85% fixed rate, with a weighted average interest rate of 5.0%.
It covers Timberlands (West 2.5 million, South 6.6 million and North 1.2 million acres), Strategic Land Solutions (Real Estate, Natural Resources and Climate Solutions, including a new biocarbon business with Aymium) and Wood Products (lumber, OSB, engineered wood and distribution). Strategic Land Solutions is the new name for Real Estate, Energy & Natural Resources, effective 2026 Q1.
It has 74 slides: forward-looking statements, a table of contents, the investment thesis and accelerated growth strategy, then sections on the unmatched portfolio, industry-leading performance, disciplined capital allocation and the strong ESG foundation, followed by an appendix with market dynamics, mill capacity tables and non-GAAP reconciliations.
The original was filed with the SEC as Exhibit 99.1 to a Form 8-K. The slides in this gallery are rasterized images of that filing, so small print on some slides, especially dense footnotes and the quarterly reconciliation tables, is not legible at this resolution.
Yes. The appendix includes Adjusted EBITDA reconciliations for the total company, Timberlands, Strategic Land Solutions and Wood Products, quarterly net debt to Adjusted EBITDA tables, an Adjusted FAD reconciliation and a slide on other non-GAAP measures. Amounts are in US$ millions.

Create Your Own Slides
Turn your ideas into professional presentations in seconds with 2slides AI.
راجع التصاميم الاحترافية، اختر أسلوبك، وأنشئ شرائح بعرض نصي مثالي. مدعوم بـ Nano Banana—ابدأ في إنشاء عرضك التقديمي الآن.
وكيل الذكاء الاصطناعي الخاص بك للشرائح. وفر الوقت، أشرق بشكل أسرع مع إنشاء عروض تقديمية ذكية.


© 2026 2slides. جميع الحقوق محفوظة.