
ضمن مجموعة أمثلة عروض المستثمرين · أمثلة عروض المستثمرين من اليابان
Tobu Railway's supplementary earnings materials for the first half (Q2 interim period, April-September 2026) of the fiscal year ending March 2027 (FY2026), dated November 5, 2026. This is a Japanese-language deck published on TDnet, the Tokyo Stock Exchange's timely disclosure system (securities code 9001). It reports consolidated operating revenue of ¥317.8 billion (¥3,177 億円, +¥7.0 billion year on year), operating profit of ¥36.1 billion (¥361 億円), and interim net income attributable to owners of the parent of ¥31.7 billion (¥317 億円, +¥7.7 billion), all ahead of the April 30, 2026 plan, and keeps the full-year forecast unchanged at ¥673.0 billion revenue and ¥72.0 billion operating profit. The deck breaks results down across Tobu's five segments: Transportation (Tobu railway lines in Tokyo and the Kanto region, buses and taxis), Leisure (travel, hotels, Tokyo Skytree), Real Estate (leasing, Tokyo Skytree Town, property sales), Retail (Tobu department stores and Tobu Store supermarkets) and Other (mainly construction).
يستخدم غلاف هذا العرض مرجعًا للنمط لإنشاء شرائح من محتواك الخاص. أو اختر أي صفحة أدناه لاستخدام تخطيطها مرجعًا.
التنقل السريع
العلامات
مشاركة الشرائح
Tobu Railway's supplementary earnings materials for the first half (Q2 interim period, April-September 2026) of the fiscal year ending March 2027 (FY2026), dated November 5, 2026. This is a Japanese-language deck published on TDnet, the Tokyo Stock Exchange's timely disclosure system (securities code 9001). It reports consolidated operating revenue of ¥317.8 billion (¥3,177 億円, +¥7.0 billion year on year), operating profit of ¥36.1 billion (¥361 億円), and interim net income attributable to owners of the parent of ¥31.7 billion (¥317 億円, +¥7.7 billion), all ahead of the April 30, 2026 plan, and keeps the full-year forecast unchanged at ¥673.0 billion revenue and ¥72.0 billion operating profit. The deck breaks results down across Tobu's five segments: Transportation (Tobu railway lines in Tokyo and the Kanto region, buses and taxis), Leisure (travel, hotels, Tokyo Skytree), Real Estate (leasing, Tokyo Skytree Town, property sales), Retail (Tobu department stores and Tobu Store supermarkets) and Other (mainly construction).
عرض تفصيلي لكل صفحة شريحة، بما في ذلك التخطيط والمحتوى الرئيسي والعناصر المرئية.
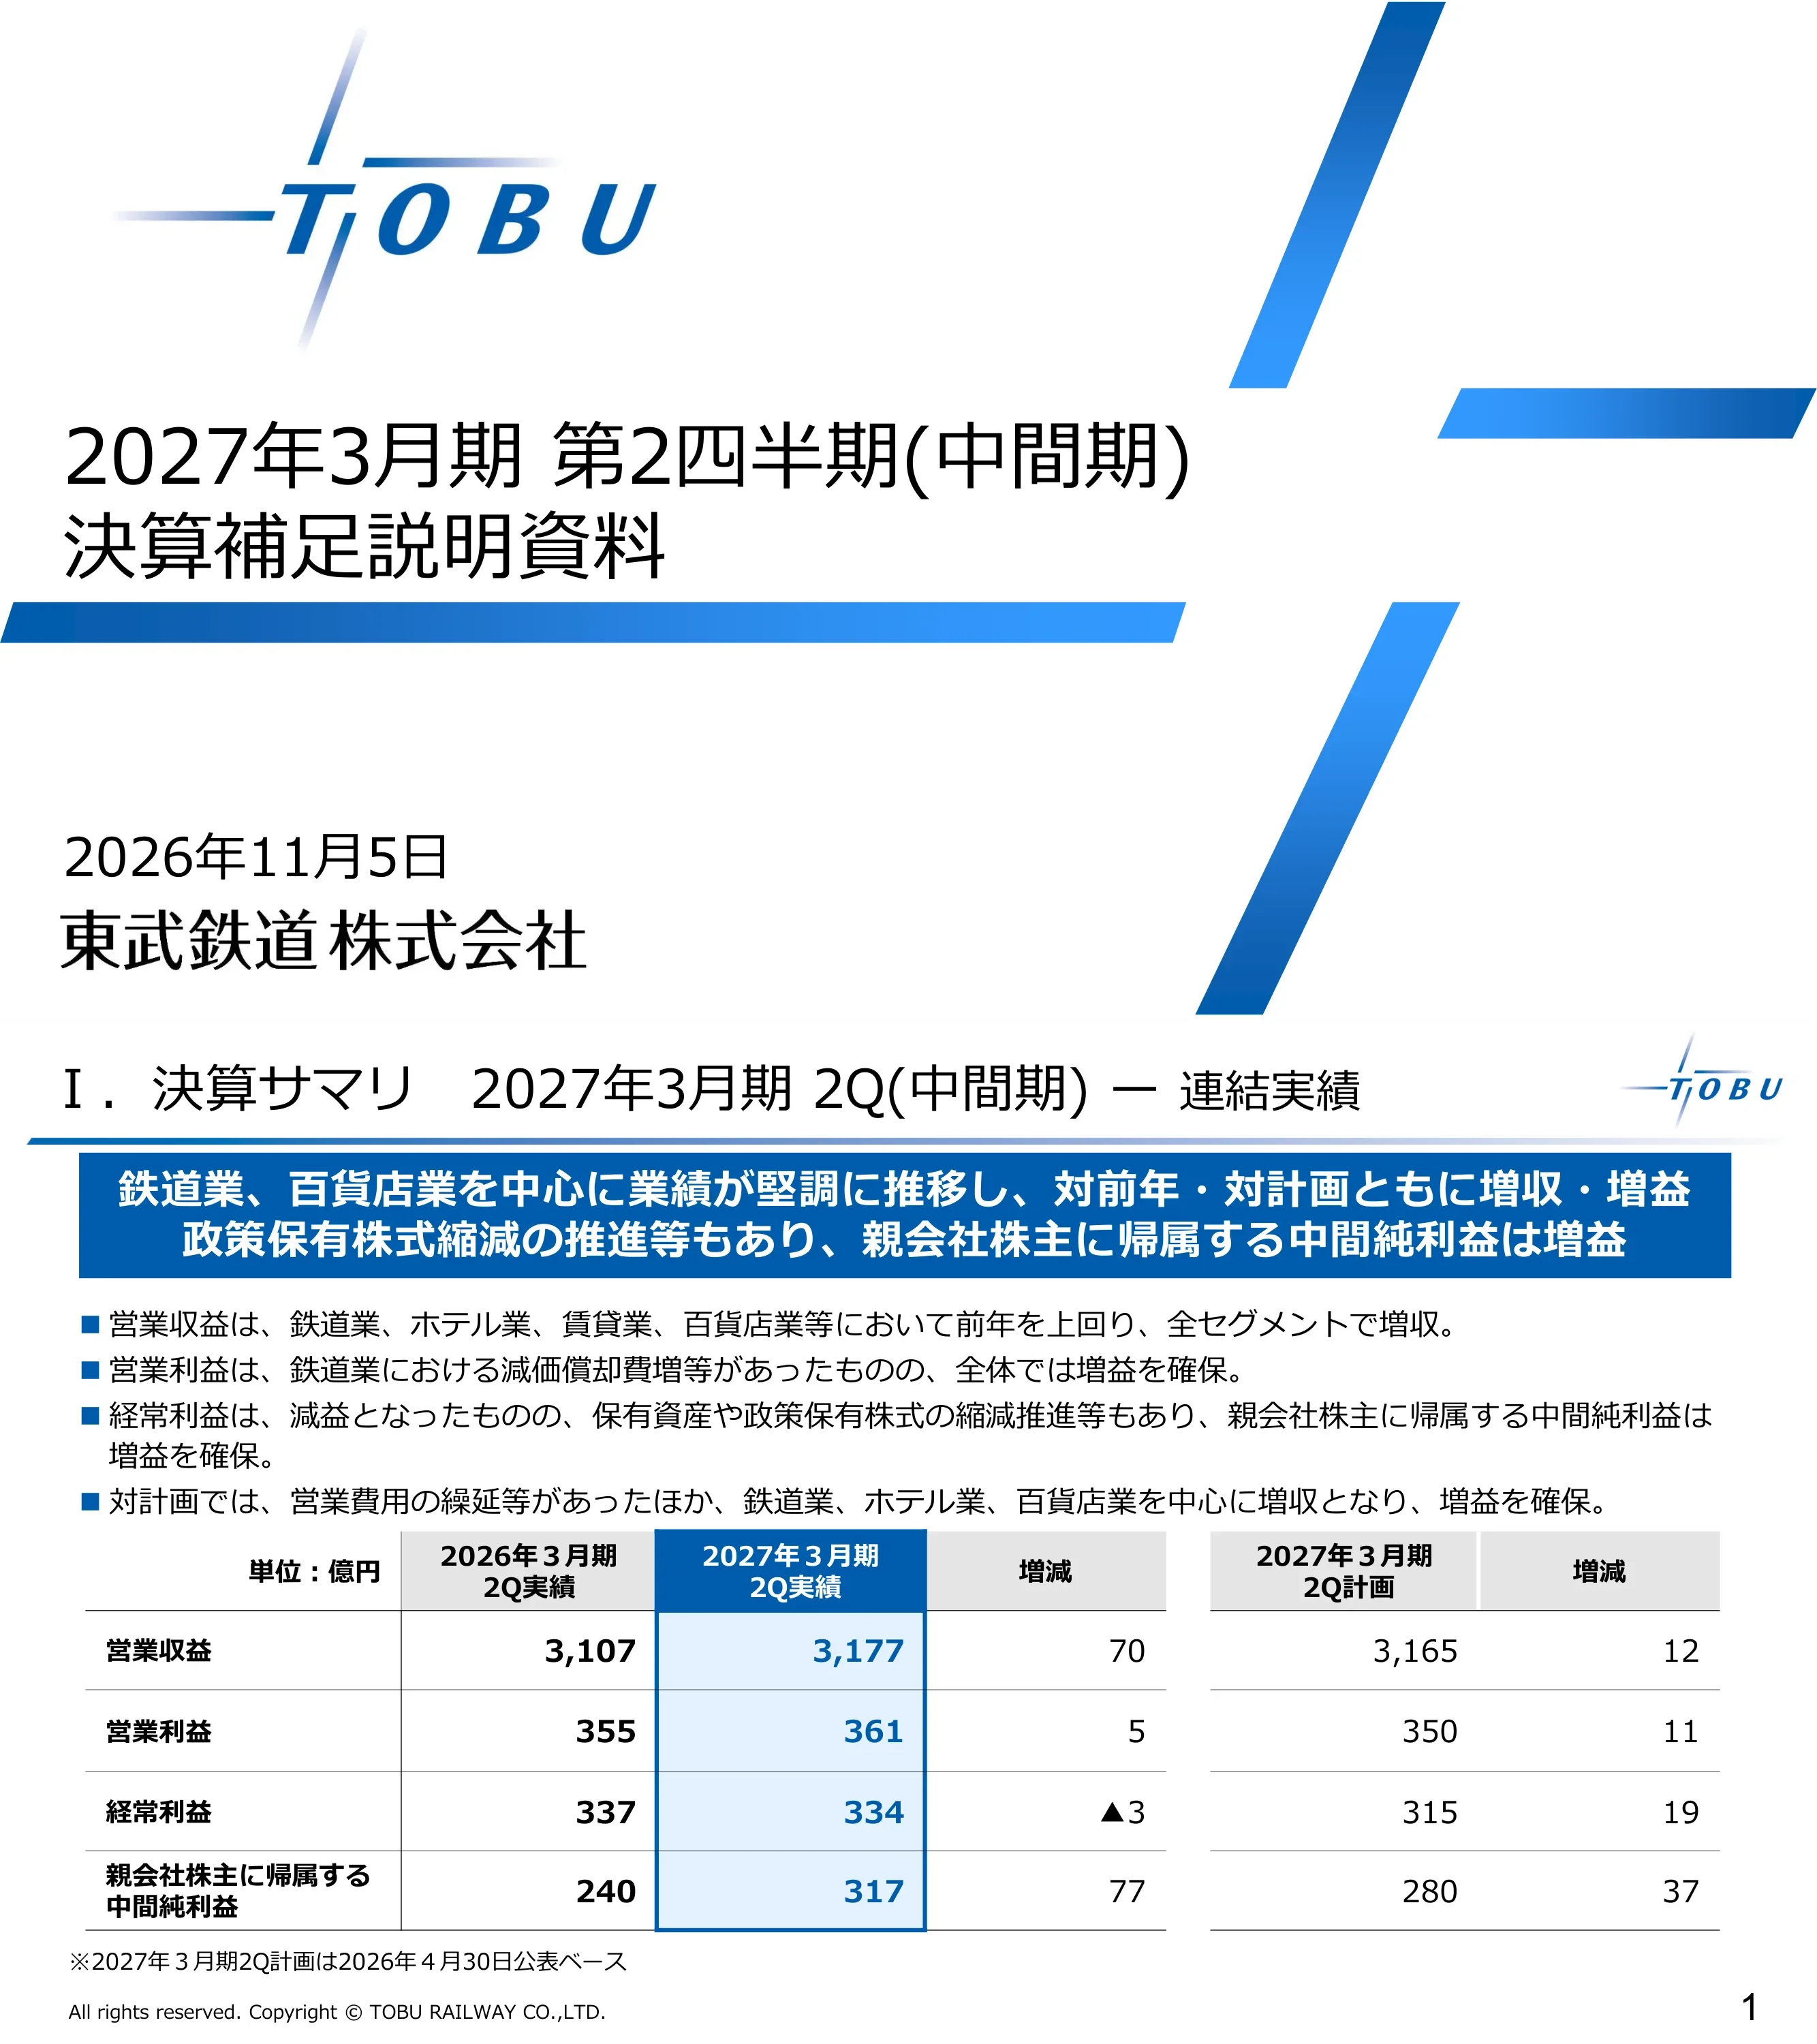
Title page reading (in Japanese) 'Fiscal year ending March 2027, Second Quarter (Interim Period), Supplementary Earnings Materials', dated November 5, 2026, issued by Tobu Railway Co., Ltd. (東武鉄道株式会社).
Tobu logo top left, two-line title across the middle, date and company name bottom left, with large diagonal blue stripe graphics on the right.
Headline: results were firm, led by the railway and department store businesses, with revenue and profit up both year on year and against plan; interim net income attributable to owners of the parent rose, helped by continued reduction of cross-shareholdings. Bullets: operating revenue rose in all segments (railway, hotel, leasing, department store and others); operating profit rose despite higher railway depreciation; ordinary profit fell slightly, but net income rose thanks to sales of held assets and cross-shareholdings; against plan, deferral of operating expenses plus higher railway, hotel and department store revenue lifted profit. Table in ¥100 million (億円): operating revenue 3,107 → 3,177 (+70; plan 3,165, +12); operating profit 355 → 361 (+5; plan 350, +11); ordinary profit 337 → 334 (▲3; plan 315, +19); net income attributable to owners of parent 240 → 317 (+77; plan 280, +37). Note: plan is the April 30, 2026 announcement.
Section header bar, blue headline box with two-line key message, four square-bullet commentary lines, then a comparison table with prior-year actual, current actual (highlighted blue column), change, plan and variance vs plan.
Segment table in ¥100 million (億円), H1 FY2025 → H1 FY2026 (change; plan, variance). Transportation: revenue 1,094 → 1,119 (+25; plan 1,109, +10), operating profit 159 → 157 (▲2; plan 137, +20) — higher railway, bus and taxi revenue, but profit down on higher railway depreciation. Leisure: revenue 836 → 840 (+4; plan 832, +8), OP 79 → 74 (▲5; plan 78, ▲4) — hotel-led revenue growth, but lower travel profit and higher hotel and Skytree costs. Real Estate: revenue 266 → 273 (+6; plan 277, ▲4), OP 72 → 76 (+4; plan 75, +1) — leasing and Skytree Town up; condo/house sales down on fewer units. Retail: revenue 866 → 875 (+9; plan 871, +4), OP 30 → 39 (+9; plan 36, +3) — department stores up, store margin improved, lower new Tobu Card issuance costs. Other: revenue 382 → 415 (+33; plan 436, ▲21), OP 21 → 24 (+2; plan 32, ▲8) — more completed construction. Adjustments: revenue ▲337 → ▲347, OP ▲7 → ▲11. Total: revenue 3,107 → 3,177, OP 355 → 361.
Wide multi-column table: segment, metric, prior-year actual, current actual (blue highlighted), change, reasons column with bullet text, then plan and variance columns at right.
Headline: real estate and retail remain firm and the initial revenue and profit plan is maintained; net income attributable to owners of parent is expected to rise as originally planned. Bullets: revenue expected above prior year in railway, leasing, Skytree Town and department stores; profit declines in Leisure and Other are offset so the group-wide plan is held; ordinary profit expected to fall on higher interest expense, while net income rises on continued cross-shareholding reduction. Table in ¥100 million (億円), FY2025 actual → FY2026 forecast (change; plan unchanged): operating revenue 6,554 → 6,730 (+176), operating profit 718 → 720 (+2), ordinary profit 688 → 635 (▲53), net income attributable to owners of parent 556 → 560 (+4). Forecast equals the April 30, 2026 plan on every line.
Blue headline banner, three square-bullet commentary lines, comparison table with FY2025 actual, FY2026 forecast (highlighted), change, FY2026 plan and variance (all dashes).
Segment forecast in ¥100 million (億円), FY2025 actual → FY2026 forecast (change; plan, variance). Transportation: revenue 2,186 → 2,237 (+51; plan 2,214, +23), OP 276 → 244 (▲32; plan 243, +1) on higher railway depreciation. Leisure: revenue 1,895 → 1,913 (+18; plan 1,992, ▲79), OP 184 → 185 (+1; plan 193, ▲8) — hotels and Skytree up, travel profit down but leisure profit held flat. Real Estate: revenue 590 → 641 (+51; plan 632, +9), OP 158 → 160 (+2; plan 158, +2). Retail: revenue 1,761 → 1,773 (+12; plan 1,754, +19), OP 60 → 92 (+32; plan 80, +12) — department stores, store margin and lower Tobu Card issuance cost. Other: revenue 926 → 969 (+43; plan 950, +19), OP 69 → 64 (▲5; plan 71, ▲7) on lower construction margins. Adjustments: revenue ▲806 → ▲803, OP ▲30 → ▲25. Total: revenue 6,554 → 6,730, OP 718 → 720.
Same wide table format as page 3, with a reasons column and plan/variance columns at the right.
Balance sheet in ¥ million (百万円), end of March 2026 → end of September 2026 (change). Current assets 194,787 → 208,469 (+13,681); fixed assets 1,668,775 → 1,676,672 (+7,896); total assets 1,863,562 → 1,885,141 (+21,578). Current liabilities 475,985 → 472,740 (▲3,245); long-term liabilities 765,350 → 758,517 (▲6,832); total liabilities 1,241,335 → 1,231,257 (▲10,077). Net assets 622,227 → 653,883 (+31,656; retained earnings +23,909). Equity ratio 33.0% → 34.3% (+1.3 points). Interest-bearing debt 789,673 → 795,747 (+6,073).
Single table with prior period-end, current period-end (highlighted), change and remarks columns; equity ratio and interest-bearing debt in a separate block below.
In ¥ million (百万円), H1 FY2025 → H1 FY2026 (change; plan, variance). Operating revenue 109,402 → 111,995 (+2,593; plan 110,900, +1,095): railway 82,078 → 83,724 (+1,646), other 27,323 → 28,270 (+946; bus/taxi +964, freight ▲14). Operating profit 15,997 → 15,789 (▲208; plan 13,700, +2,089): railway 13,773 → 13,763 (▲9), other 2,224 → 2,025 (▲198; bus/taxi ▲262, freight +63). Tobu Railway passengers (million): commuter pass 279 → 284 (+1.7%), non-commuter 166 → 171 (+2.9%), limited express 3 → 3 (+1.6%), total 445 → 455 (+2.1%). Passenger revenue (¥ million): commuter pass 31,505 → 31,903 (+1.3%), non-commuter 43,230 → 44,330 (+2.5%), limited express 3,655 → 3,772 (+3.2%), total 74,736 → 76,234 (+2.0%). Note: non-commuter revenue includes limited express and reserved-seat fees.
Segment P&L table at top with remarks and plan columns; two side-by-side KPI tables below for passenger volume and passenger revenue.
In ¥ million (百万円), H1 FY2025 → H1 FY2026 (change; plan, variance). Revenue 83,628 → 84,054 (+425; plan 83,200, +854): travel 51,803 → 51,217 (▲586), hotels 17,399 → 18,172 (+773), Tokyo Skytree 8,688 → 8,845 (+157), other 5,737 → 5,819 (+81; amusement/sightseeing +29, sports +63). Operating profit 7,986 → 7,476 (▲509; plan 7,800, ▲324): travel ▲57 → ▲291 (▲234), hotels 3,469 → 3,409 (▲59), Skytree 3,850 → 3,747 (▲103), other 723 → 610 (▲112). Tokyo Skytree visitors (10 thousand): 239 → 201 (▲38). Hotel occupancy: Courtyard Ginza 86.2% → 82.6%, AC Hotel Ginza 83.7% → 79.1%, Kinshicho 90.0% → 90.7%, Narita 88.3% → 88.0%. Foreign-guest ratio: Courtyard Ginza 83.8% → 87.1%, AC Ginza 81.6% → 84.3%, Kinshicho 84.9% → 80.3%, Narita 69.6% → 66.0%.
Segment P&L table across the top; three small KPI tables below for Skytree visitors, hotel occupancy and foreign-guest ratio.
In ¥ million (百万円), H1 FY2025 → H1 FY2026 (change; plan, variance). Revenue 26,635 → 27,335 (+699; plan 27,700, ▲365): leasing 17,475 → 18,703 (+1,227), Skytree Town 6,766 → 6,987 (+220), property sales 2,393 → 1,644 (▲748). Operating profit 7,259 → 7,681 (+422; plan 7,500, +181): leasing 5,057 → 5,405 (+347), town 2,097 → 2,174 (+77), sales 104 → 101 (▲2). Skytree Town visitors (10 thousand): 1,810 → 1,799 (▲11). Units sold: detached houses 37 → 31 (▲6), condominiums 43 → 55 (+12); on an equity-share basis, detached houses 18 → 13 (▲5), condominiums 17 → 24 (+7).
Segment P&L table at top; Skytree Town visitor table bottom left; units-sold table bottom right with gross and equity-share basis.
In ¥ million (百万円), H1 FY2025 → H1 FY2026 (change; plan, variance). Revenue 86,629 → 87,556 (+926; plan 87,100, +456): department stores 30,836 → 31,811 (+975), stores (supermarkets) 37,425 → 36,259 (▲1,165), other 18,367 → 19,485 (+1,117). Operating profit 3,008 → 3,942 (+933; plan 3,600, +342): department stores 2,490 → 3,129 (+638), stores 508 → 584 (+76), other 9 → 228 (+218). Major department store sales growth: Ikebukuro 10.6% (prior H1) vs 4.1% (this H1), Funabashi 0.7% vs 1.2%, Utsunomiya 0.3% vs ▲0.1%.
Segment P&L table on top; department store sales growth table bottom left; remaining space blank.
In ¥ million (百万円), H1 FY2025 → H1 FY2026 (change; plan, variance). Operating revenue 38,230 → 41,582 (+3,352; plan 43,600, ▲2,018). Operating profit 2,112 → 2,404 (+291; plan 3,200, ▲796). No breakdown is given; page 3 attributes the gain to more completed construction work.
Single two-row table at the top of an otherwise empty slide.
In ¥ million (百万円), FY2025 actual → FY2026 forecast (change; plan, variance). Revenue 218,646 → 223,700 (+5,054; plan 221,400, +2,300): railway 164,272 → 167,200 (+2,928), other 54,373 → 56,500 (+2,127; bus/taxi +2,076, freight +37). Operating profit 27,644 → 24,400 (▲3,244; plan 24,300, +100): railway 23,583 → 20,600 (▲2,983), other 4,060 → 3,800 (▲260; bus/taxi ▲275, freight +16). Full-year passengers (million): commuter 542 → 551 (+1.7%), non-commuter 335 → 344 (+2.7%), limited express 7 → 7 (+2.2%), total 877 → 895 (+2.1%). Passenger revenue (¥ million): commuter 61,714 → 62,658 (+1.5%), non-commuter 87,593 → 89,609 (+2.3%), limited express 7,609 → 7,792 (+2.4%), total 149,307 → 152,267 (+2.0%).
Same format as page 7: P&L forecast table on top, ridership and fare revenue tables below.
In ¥ million (百万円), FY2025 actual → FY2026 forecast (change; plan, variance). Revenue 189,584 → 191,300 (+1,716; plan 199,200, ▲7,900): travel 124,034 → 124,000 (▲34; plan 131,600, ▲7,600), hotels 37,456 → 38,400 (+944), Skytree 16,536 → 17,300 (+764), other 11,557 → 11,600 (+43; amusement/sightseeing ▲126, sports +180). Operating profit 18,446 → 18,500 (+54; plan 19,300, ▲800): travel 2,239 → 1,900 (▲339), hotels 8,350 → 8,600 (+250), Skytree 6,420 → 6,800 (+380), other 1,435 → 1,200 (▲235). Tokyo Skytree visitors (10 thousand): 446 → 408 (▲38). Hotel occupancy forecast: Courtyard Ginza 87.1% → 84.7%, AC Ginza 83.4% → 81.1%, Kinshicho 90.8% → 91.0%, Narita 89.6% → 89.1%.
P&L forecast table on top; Skytree visitors table bottom left; hotel occupancy table bottom right.
In ¥ million (百万円), FY2025 actual → FY2026 forecast (change; plan, variance). Revenue 59,075 → 64,100 (+5,025; plan 63,200, +900): leasing 36,498 → 40,900 (+4,402), Skytree Town 13,913 → 14,300 (+387), property sales 8,662 → 8,900 (+238). Operating profit 15,892 → 16,000 (+108; plan 15,800, +200): leasing 10,694 → 11,000 (+306), town 3,886 → 4,000 (+114), sales 1,311 → 1,000 (▲311). Skytree Town visitors (10 thousand): 3,650 → 3,601 (▲49). Units sold: detached houses 77 → 66 (▲11), condominiums 285 → 386 (+101); equity-share basis: detached 37 → 30 (▲7), condominiums 130 → 141 (+11).
Same layout as page 9 with forecast columns.
In ¥ million (百万円), FY2025 actual → FY2026 forecast (change; plan, variance). Revenue 176,135 → 177,300 (+1,165; plan 175,400, +1,900): department stores 63,480 → 64,400 (+920), stores 75,025 → 72,200 (▲2,825), other 37,630 → 40,700 (+3,070). Operating profit 6,004 → 9,200 (+3,196; plan 8,000, +1,200): department stores 5,293 → 6,600 (+1,307), stores 1,057 → 1,100 (+43), other ▲346 → 1,500 (+1,846). Department store sales growth: Ikebukuro 4.3% (FY2025) → 2.5% (FY2026 forecast), Funabashi 2.4% → 1.2%, Utsunomiya 0.8% → 2.1%.
P&L forecast table on top; department store growth table bottom left.
In ¥ million (百万円), FY2025 actual → FY2026 forecast (change; plan, variance). Operating revenue 92,645 → 96,900 (+4,255; plan 95,000, +1,900). Operating profit 6,955 → 6,400 (▲555; plan 7,100, ▲700). Page 5 attributes the profit decline to lower construction margins.
Single two-row table at the top of an otherwise blank slide.
Section divider reading 'appendix ~ reference information' (参考情報).
Centered single-line title on a white slide with the standard header rule and logo.
Consolidated subsidiaries, March 2026 → September 2026: Transportation 27 → 24 (3 removed), Leisure 14, Real Estate 3, Retail 8, Other 16; total 68 → 65. The decrease reflects the April 2026 absorption of Tobu Intertec, Tobu Engineering and Tobu Station Service into Tobu Railway Co., Ltd. Equity-method affiliates unchanged at 3 (Transportation 1, Leisure 2).
Two tables (subsidiaries and equity-method affiliates) with columns for March 2026, increase, decrease, September 2026 (highlighted) and remarks.
In ¥ million (百万円), Q1 / Q2 / H1 cumulative. Transportation: revenue 56,117 / 55,878 / 111,995; OP 10,262 / 5,527 / 15,789. Leisure: revenue 38,648 / 45,406 / 84,054; OP 3,831 / 3,644 / 7,476. Real Estate: revenue 13,872 / 13,463 / 27,335; OP 3,871 / 3,809 / 7,681. Retail: revenue 44,304 / 43,252 / 87,556; OP 2,390 / 1,552 / 3,942. Other: revenue 19,006 / 22,576 / 41,582; OP 1,179 / 1,224 / 2,404. Adjustments: revenue ▲15,655 / ▲19,098 / ▲34,754; OP ▲517 / ▲643 / ▲1,161. Total: revenue 156,292 / 161,477 / 317,769; OP 21,017 / 15,115 / 36,132.
Table occupying the left two-thirds of the slide, with Q2 column highlighted.
Notes that the profit plans in the materials are based on forecasts using information available at the time, including industry trends and domestic and overseas economic conditions, and that actual results may differ from the plans due to changes in the business environment.
Centered heading with a short paragraph of body text beneath.
أسئلة شائعة حول هذه الشريحة ومحتوى العرض التقديمي الأساسي.
The original is in Japanese. It is Tobu Railway's supplementary earnings materials (決算補足説明資料) for the second quarter (interim period) of the fiscal year ending March 2027, published on TDnet, the Tokyo Stock Exchange's timely disclosure system, under securities code 9001 on November 5, 2026. The page-by-page summary here is in English, with yen figures kept in the company's own units.
Tobu's fiscal year runs from April to March. FY2026 is April 2026 to March 2027, which the company labels the fiscal year ending March 2027 (2027年3月期). H1 is the interim period from April to September 2026.
Operating revenue rose to ¥3,177 億円 (¥317.8 billion) from ¥3,107 億円, operating profit rose to ¥361 億円 from ¥355 億円, ordinary profit dipped to ¥334 億円 from ¥337 億円, and interim net income attributable to owners of the parent jumped to ¥317 億円 from ¥240 億円, helped by sales of cross-shareholdings. All lines beat the April 30, 2026 plan.
No. The FY2026 forecast is unchanged at operating revenue of ¥6,730 億円, operating profit of ¥720 億円, ordinary profit of ¥635 億円 (down ¥53 億円 on higher interest expense) and net income attributable to owners of the parent of ¥560 億円. Within segments, retail and real estate were raised while leisure (mainly travel) and other were lowered.
Tobu Railway carried 455 million passengers in H1 (+2.1%) and fare revenue rose 2.0% to ¥76,234 million, but higher depreciation kept railway operating profit flat at ¥13,763 million. For the full year the company expects railway operating profit to fall from ¥23,583 million to ¥20,600 million.
Tokyo Skytree visitors fell from 2.39 million to 2.01 million in H1, though Skytree revenue still rose to ¥8,845 million. Hotel occupancy slipped at Courtyard Ginza (82.6%) and AC Hotel Ginza (79.1%), while foreign-guest ratios at both Ginza hotels rose to 87.1% and 84.3%.
The appendix lists the number of consolidated subsidiaries (68 down to 65 after three group companies were merged into Tobu Railway in April 2026) and equity-method affiliates (3), plus a Q1 / Q2 split of revenue and operating profit by segment.
Yes. It is a clean example of a table-driven Japanese interim earnings supplement: a key-message banner, prior-year vs actual vs plan columns, a reasons column, and segment pages with operating KPIs. You can download the PDF or PPTX and adapt the structure.
Original Japanese-language filing (securities code 9001), November 5, 2026

Create Your Own Slides
Turn your ideas into professional presentations in seconds with 2slides AI.
راجع التصاميم الاحترافية، اختر أسلوبك، وأنشئ شرائح بعرض نصي مثالي. مدعوم بـ Nano Banana—ابدأ في إنشاء عرضك التقديمي الآن.
وكيل الذكاء الاصطناعي الخاص بك للشرائح. وفر الوقت، أشرق بشكل أسرع مع إنشاء عروض تقديمية ذكية.


© 2026 2slides. جميع الحقوق محفوظة.