
ضمن مجموعة أمثلة عروض المستثمرين · أمثلة عروض المستثمرين من اليابان
Murata Manufacturing H1 FY2026 Earnings Presentation (fiscal year ending March 2027): the Japanese-language results briefing deck (2026年度 第2四半期決算説明会資料) dated October 30, 2026 and published on TDnet, the Tokyo Stock Exchange timely-disclosure system. Murata posted record first-half revenue of ¥1,090.8 billion (¥10,908 億円, +20.8% YoY) and record operating profit of ¥245.9 billion (¥2,459 億円, +48.9%), raised its full-year FY2026 forecast to ¥2.26 trillion revenue and ¥520 billion operating profit, and unveiled a roughly ¥1 trillion, five-year (2026-2030) MLCC capacity expansion aimed at more than doubling MLCC sales versus FY2025.
يستخدم غلاف هذا العرض مرجعًا للنمط لإنشاء شرائح من محتواك الخاص. أو اختر أي صفحة أدناه لاستخدام تخطيطها مرجعًا.
التنقل السريع
العلامات
مشاركة الشرائح
Murata Manufacturing H1 FY2026 Earnings Presentation (fiscal year ending March 2027): the Japanese-language results briefing deck (2026年度 第2四半期決算説明会資料) dated October 30, 2026 and published on TDnet, the Tokyo Stock Exchange timely-disclosure system. Murata posted record first-half revenue of ¥1,090.8 billion (¥10,908 億円, +20.8% YoY) and record operating profit of ¥245.9 billion (¥2,459 億円, +48.9%), raised its full-year FY2026 forecast to ¥2.26 trillion revenue and ¥520 billion operating profit, and unveiled a roughly ¥1 trillion, five-year (2026-2030) MLCC capacity expansion aimed at more than doubling MLCC sales versus FY2025.
عرض تفصيلي لكل صفحة شريحة، بما في ذلك التخطيط والمحتوى الرئيسي والعناصر المرئية.
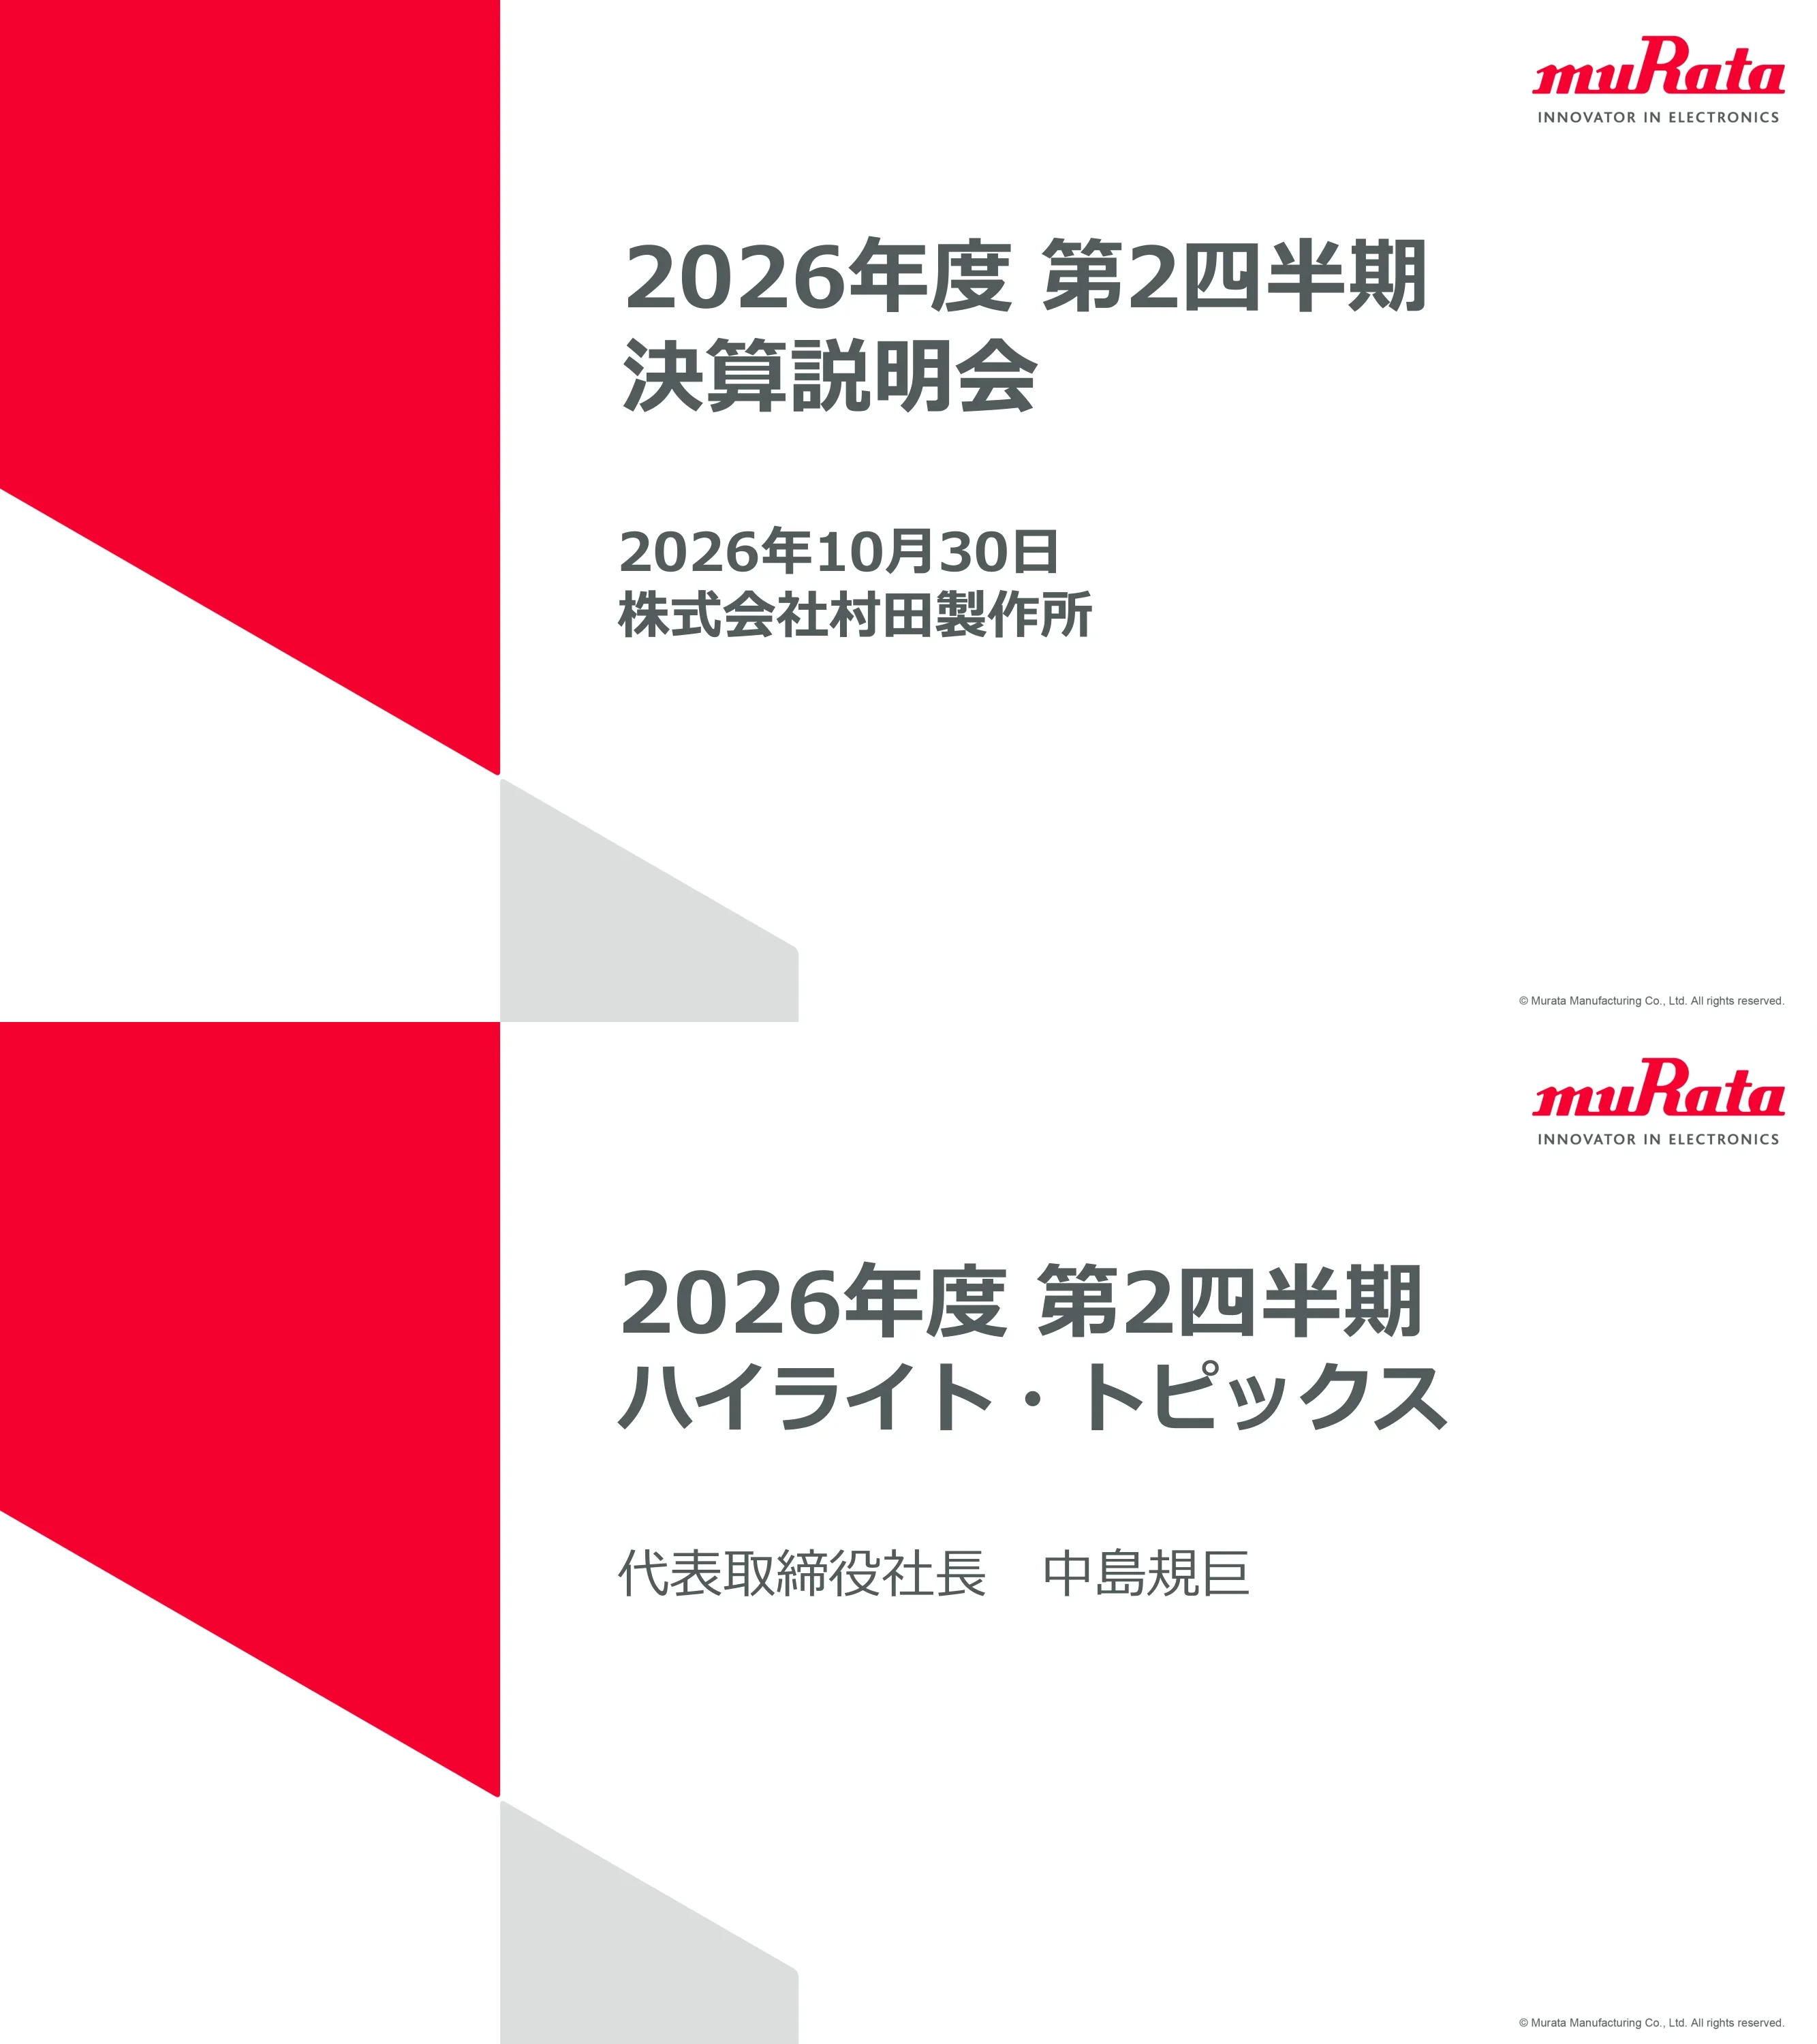
Title slide reading 2026年度 第2四半期 決算説明会 (FY2026 Second Quarter Results Briefing), dated October 30, 2026, Murata Manufacturing Co., Ltd.
Large red angular panel on the left with grey wedge; title and date stacked right of center; Murata logo with 'Innovator in Electronics' tagline top right
Opens the highlights and topics section (ハイライト・トピックス), presented by President and Representative Director Norio Nakajima (中島規巨).
Same red-panel cover template used as a section divider, with presenter name and title beneath the heading
H1 revenue ¥10,908 億円 (¥1.09 trillion), a company record, up 20.8% YoY and 14.2% excluding FX; resin multilayer substrates and RF modules fell on smartphones but components grew broadly in data center and mobility. Operating profit ¥2,459 億円, also a record, up 48.9% YoY (+30.7% ex-FX), as higher utilization and yen weakness outweighed higher fixed costs and price erosion.
Grey header bar, two large red headline figures each followed by two explanatory bullets
Full-year forecast raised to revenue ¥22,600 億円 (+7.1%, +¥1,500 億円 vs the July forecast) and operating profit ¥5,200 億円 (+20.9%, +¥900 億円), both records. Capex raised by ¥150 億円 to ¥2,700 億円, mainly for devices and modules. Annual dividend unchanged and the ¥1,500 億円 share buyback proceeds as planned.
Four stacked blocks (revenue, operating profit, capex, shareholder returns), each a red label plus bullets
Introduces the briefing's special topic: plans to expand future production capacity for multilayer ceramic capacitors (積層セラミックコンデンサ).
Full-width light grey panel with a single centered two-line statement
Maps AI's progression (LLM, AI agents, AGI, ASI) against three domains: edge devices (smart glasses, smart rings, 6G, bioelectronics/implantables), IT infrastructure (AI data centers needing vertical power delivery and semiconductor packages, optical communications, distributed computing) and mobility (AD/ADAS, drones, industrial robots, humanoids, space). Murata's enduring value: small size, high capacitance, high efficiency, high density, high reliability and thermal management. The footer page number reads 4 although it is the sixth page.
Matrix with an AI-evolution arrow across the top, three purple-labelled rows on the left and photo tiles with captioned technology requirements
Murata will invest about ¥1 trillion over 2026-2030 and aims to more than double MLCC sales from ¥0.9 trillion in FY2025. About ¥3,500 億円 goes to buildings (three new plants in Japan plus two overseas sites) and about ¥6,500 億円 to equipment. The map shows new plants at Izumo/Yasugi (timing undecided), Okayama (FY2028 plant; FY2030 MLCC sheet and raw-material plant), Thailand (FY2030), and Philippines infrastructure (FY2027), alongside existing sites in Wuxi, Fukui, Shenzhen, India and Singapore. High-value MLCCs (small, high capacitance, heat and voltage resistant) for IT infrastructure, mobility, edge devices and humanoids drive growth.
Headline banner; left half an Asia map with plant photo callouts (new projects outlined red); right half a two-bar growth chart with arrow and application photo strip
The new investment ramps from FY2028, is funded mainly by operating cash flow with external financing as needed, and does not materially change Mid-term Plan 2027 capital allocation. Plan: operating CF ¥13,000 億円 funding capex ¥6,800 億円 (incl. ¥1,900 億円 land and buildings), strategic investment ¥2,200 億円 and shareholder returns ¥4,000 億円. FY2025-26 actual/forecast: capex ¥5,178 億円, strategic ¥598 億円, returns ¥2,446 億円, plus buybacks of ¥2,500 億円 (¥1,000 億円 FY2025, ¥1,500 億円 FY2026). Target DOE raised toward 5% mid-term.
Pink callout box with three key points; below, stacked In/Out bars for the plan beside FY2025-26 bars, each linked to a commentary panel
Opens the results section covering the cumulative consolidated period April-September 2026.
Red-panel section divider template
Q2 and H1 revenue and operating profit both set records. H1: revenue ¥10,908 億円 (+¥1,880 億円, +20.8%; FX +¥600 億円), operating profit ¥2,459 億円 (22.5% margin, +48.9%), pre-tax profit ¥2,484 億円 (+42.1%), net profit attributable to owners ¥1,862 億円 (+40.6%). Q2 revenue ¥5,885 億円 (+17.2% QoQ), operating profit ¥1,475 億円 (25.1%, +49.8% QoQ). Average rate ¥159.37/USD vs ¥146.04. FX sensitivity per ¥1 per year: revenue ~¥90 億円, operating profit ~¥45 億円.
Three summary bullets above a wide financial table with H1 FY2025, Q1/Q2/H1 FY2026 (red outline), YoY, FX effect and QoQ columns
Company-wide orders hit a record despite yen appreciation reducing the value of foreign-currency backlog, led by data center and communications demand. Q2 FY2026: sales ¥5,885 億円, orders ¥7,534 億円, backlog ¥7,827 億円, book-to-bill 1.28 (1.34 in Q1). Murata flags rising long-lead orders and possible pull-ins in some applications. Book-to-bill ratios FY23 Q2 to FY26 Q2 are listed; period-end rates ¥148.89 (Sep 2025), ¥159.93 (Mar 2026), ¥157.33 (Sep 2026).
Two bullets above a combo chart: grey backlog bars, red sales line, dashed orders line, with callout boxes and a book-to-bill row beneath
H1 FY2026 revenue by segment: Capacitors ¥6,056 億円 (55.5% of sales, +33.1% YoY), Inductors/EMI filters ¥1,349 億円 (+21.8%), High-frequency & Communications ¥1,985 億円 (-2.1%), Energy & Power ¥787 億円 (+5.1%), Functional Devices ¥637 億円 (+22.1%), Other ¥94 億円. Q2 QoQ growth was strongest in high-frequency (+30.4%) and energy (+26.2%).
Single wide table with H1 FY2025, Q1/Q2/H1 FY2026 (red outline), YoY and QoQ columns
Components revenue rose 29.7% to ¥7,451 億円 and operating profit 62.1% to ¥2,556 億円 (margin 34.3% vs 27.5%). MLCC grew in servers, distributors and mobility; inductors and EMI filters grew in mobility and servers. Price erosion, raw-material cost increases and higher fixed costs were outweighed by utilization gains and yen weakness.
Left grid of segment rows with commentary and a pink operating-profit box; right side stacked revenue bars and pink profit bars for the two periods
Devices & Modules revenue rose 3.4% to ¥3,409 億円, but operating profit swung from ¥103 億円 (3.1%) to a loss of ¥48 億円 (-1.4%). RF modules fell on smartphones and PCs; resin multilayer substrates and SAW filters fell on smartphones; power modules grew on data centers; lithium-ion batteries fell on power tools and the micro primary battery divestiture; sensors grew on mobility. Price cuts, material costs and a project-drop loss in power modules hurt profit; one-off costs are included.
Same template as page 13: segment grid on the left with pink profit box, stacked bar comparison on the right
H1 FY2026: Communications ¥3,468 億円 (+5.6%), Mobility ¥2,688 億円 (+14.6%), Computers ¥2,351 億円 (+61.2%) including data-center-related ¥1,649 億円 (+101.8%, 15.1% of sales), Home electronics ¥716 億円 (-2.4%), Industrial & other ¥1,684 億円 (+39.8%). Q2 data-center sales were ¥952 億円, +36.6% QoQ.
Wide table with highlighted data-center sub-row; same column scheme as the segment table
Operating profit rose from ¥1,651 億円 to ¥2,459 億円: rationalization +170, utilization gains +1,080, price declines -280, FX +300, higher depreciation -72, higher semi-variable and fixed costs -410, other +20 (¥億円). Rate ¥146.04 to ¥159.37/USD; production value ¥9,090 億円 to ¥11,080 億円. One-offs in H1 FY2026 net +¥20 億円 (US tariff effect incl. refunds +40, power-module project-drop loss -20).
Waterfall chart with red start and end bars, grey increments, assumption box and one-off callout box
Inventory at end-September 2026 fell ¥49 億円 QoQ, but rose ¥15 億円 excluding yen appreciation at period end. Finished goods plus WIP / raw materials and supplies (¥億円): Sep 2025 3,700/1,186; Dec 2025 3,734/1,278; Mar 2026 3,905/1,300; Jun 2026 4,052/1,338; Sep 2026 4,014/1,327.
One bullet above a five-period stacked column chart, latest period outlined red
H1 FY2026 vs H1 FY2025 (¥億円): operating CF 2,155 (+477), investing CF -1,125, financing CF -1,467, FX effect -94, cash and equivalents 6,006, free cash flow 1,029 (+7), capex payments -976, depreciation and amortization 916.
Clean three-column comparison table with red outline on the current period
Opens the full-year forecast section covering April 2026 to March 2027.
Red-panel section divider
FY2026 end-market assumptions (October vs July): smartphones 1.16 billion units (-6.5% YoY, -2.5% vs prior), mainly mid/low-end, with 5G share 70.3%; autos 91.40 million (-0.8% YoY, +1.2% vs prior, ~1.04 million raised on ICE as Middle East impact proved limited) with xEV share 50.0%; PCs 350 million (-12.1% YoY) on memory supply constraints. Smartphones and PCs on component-intake basis, autos on production basis.
Three commentary bullets above a table comparing FY2025 actual, July forecast and October forecast (red outline) with change columns
Full-year forecast records on all lines, raised on AI-server-led data center demand: revenue ¥22,600 億円 (H1 actual 10,908 + H2 11,692), operating profit ¥5,200 億円 (23.0% margin), pre-tax ¥5,320 億円, net profit ¥3,960 億円 (17.5%), versus July's 21,100 / 4,300 / 4,510 / 3,380. ROIC (after tax) 16.6% vs 13.9%. Assumed rate ¥157.19/USD (July ¥156.12). Ex-FX, revenue +¥1,404 億円 and operating profit +¥852 億円 vs July.
Three bullets over a wide table: July forecast columns, October forecast columns (red outline), and change columns incl. FX effect
Side-by-side July vs October assumptions. Sales: data center demand now growing beyond prior forecast; mobility risk from the Middle East eased; price declines moderate; ¥155/USD from Q3. Production: inventory built in H1 for future demand, H2 production in line with sales so inventory rises only slightly. Costs: higher personnel costs including bonuses, and capacity expansion for ceramic capacitors to build the global production base (July had cited precious-metal costs and Strait of Hormuz closure effects).
Two-column comparison (grey July header, red October header) across three row bands: sales, production, costs
October full-year segment forecast (¥億円): Capacitors 12,762 (+10.3% vs July), Inductors/EMI 2,743 (+7.7%), Components 15,505 (+9.8%), High-frequency & Communications 3,797 (-0.2%), Energy & Power 1,842 (+2.9%), Functional Devices 1,220 (+2.3%), Devices & Modules 6,859 (+1.1%), Other 236, total 22,600. H2 forecast vs H1: Components +9.4%, Energy & Power +34.1%, High-frequency -8.7%.
Wide forecast table: July full-year, H1 actual, H2 forecast, October full-year, change vs July, H2 vs H1
Capacitors (+10.3%): MLCC up on strong data center demand. Inductors/EMI (+7.7%): EMI filters up, mainly data center. High-frequency (-0.2%): resin multilayer substrates down on smartphones. Energy & Power (+2.9%): Li-ion batteries up on power tools, power modules down for data centers. Functional Devices (+2.3%): actuators up on HDD demand.
Two-column grid: grey segment cells with % change, white commentary cells with ○/▲ markers
October full-year forecast (¥億円): Communications 6,741 (+1.5% vs July), Mobility 5,363 (+4.1%), Computers 5,636 (+12.3%) including data-center-related 4,250 (+14.7%), Home electronics 1,428 (+10.9%), Industrial & other 3,433 (+14.4%). H2 data-center sales forecast at 2,601, up 57.7% on H1.
Wide forecast table with shaded data-center row
Communications: capacitors up for smartphones and base stations. Mobility: capacitors and EMI filters up for autos. Computers: capacitors up for data centers. Home electronics: Li-ion batteries up for power tools. Industrial & other: capacitors and EMI filters up via distributors.
Five-row grey/white commentary grid
Full-year operating profit forecast raised from ¥4,300 億円 to ¥5,200 億円: rationalization +10, utilization +800, price +160, FX +50, depreciation -40, semi-variable/fixed costs -130, other +50. Rate ¥156.12 to ¥157.19/USD; production value ¥21,300 億円 to ¥22,780 億円.
Waterfall chart with red endpoints and assumption box
From ¥2,459 億円 in H1 to ¥2,741 億円 forecast for H2: rationalization +40, utilization +540, price 0, FX -100, depreciation -20, semi-variable/fixed costs -340, other +162. Rate ¥159.37 to ¥157.19; production value ¥11,080 億円 to ¥11,700 億円. No one-offs assumed for H2.
Waterfall chart with assumption box and one-off callout
FY2026 H1 actual / H2 forecast / full year: depreciation ¥916 / ¥944 / ¥1,860 億円; R&D ¥881 / ¥899 / ¥1,780 億円; capex ¥865 / ¥1,835 / ¥2,700 億円; USD rate ¥159.37 / ¥155.00 / ¥157.19.
Simple four-row table with forecast columns outlined red
Quarterly revenue line FY25 Q1-Q4 ¥4,162 / 4,866 / 4,675 / 4,606 億円, FY26 Q1 5,023, Q2 5,885, with forecasts Q3 5,740 and Q4 5,952; clustered bars show operating, pre-tax and net profit, peaking in FY26 Q2.
Dual-axis combo chart: clustered profit bars on the left axis, revenue line on the right, forecast quarters boxed in red
Announces the Murata Value Report 2026 (integrated report) published September 29, 2026, and Murata IR Day 2026 business briefing on November 30, 2026, 14:00-15:30 via Zoom webinar with materials at 13:00. Speakers: President Norio Nakajima and heads of the ceramic capacitor, energy, communications and sensor, and component business units.
Two side-by-side cards: report announcement with cover image, and event details table with speaker list
Standard Japanese cautionary statement: forecasts are based on currently available information; risks include economic conditions and electronic component market trends, raw material prices and supply, exchange rates, ability to keep developing new products, fair value changes in financial assets, regulatory and social changes, and contingencies. Murata assumes no duty to update.
Single bordered text block
Closing slide of the main presentation with 'Thank you'.
Red-panel template with centered English text
Opens the appendix (補足, supplementary materials).
Red-panel section divider
March 2026 vs September 2026 (¥億円): cash 6,537 to 6,006; trade receivables 3,282 to 3,923; inventories 5,205 to 5,342; current assets 15,814 to 16,264; PP&E 13,009 to 12,961; goodwill 995 to 980; total assets 31,991 to 32,492. Borrowings 33 to 26; total liabilities 4,813 to 4,912; equity attributable to owners 27,187 to 27,591. Period-end rate ¥159.93 to ¥157.33 (¥2.60 stronger).
Two side-by-side tables (assets; liabilities and equity) plus a small FX table
Detailed drivers: MLCC up in data center, distributors and mobility; inductors up in mobility, distributors and data center; EMI filters up in mobility and servers; resin multilayer substrates and RF modules down on smartphones; Li-ion batteries down on power tools; power modules up on data center; sensors up in mobility, distributors and smartphones; actuators up in computers.
Five-row grey/white commentary grid with YoY percentages
QoQ drivers: Capacitors +14.4% (data center, distributors, smartphones); Inductors/EMI +10.0% (mobility, PCs, data center); High-frequency +30.4% (smartphone seasonal increase in substrates and RF modules); Energy & Power +26.2% (Li-ion for data center and power tools, power modules for data center); Functional Devices +8.8% (sensors for smartphones and mobility, actuators for computers).
Same five-row commentary grid
Communications +5.6% (capacitors for smartphones and base stations); Mobility +14.6% (capacitors, EMI filters and inductors for autos); Computers +61.2% (capacitors, power modules and Li-ion batteries for data centers); Home electronics -2.4% (Li-ion for power tools down); Industrial & other +39.8% (capacitors via distributors).
Five-row commentary grid
QoQ: Communications +21.7% (substrates, RF modules and capacitors for smartphones); Mobility +4.3%; Computers +28.5% (data center capacitors, Li-ion and power modules); Home electronics +8.7% (Li-ion for power tools); Industrial & other +18.5% (capacitors via distributors).
Five-row commentary grid
Defines application buckets: Communications (smartphones, wearables, base stations); Mobility (autos, two-wheelers); Computers (PCs incl. tablets, and data centers including general servers, AI servers, HDDs and accelerator cards); Home electronics (power tools, AV, other appliances); Industrial & other (industrial equipment, distributors, healthcare, other). Data-center sales sit within Computers.
Color-coded two-column reference table
Operating profit rose from ¥985 億円 to ¥1,475 億円: rationalization +20, utilization +500, price -50, FX 0, depreciation -1, semi-variable/fixed costs -20, other +41. Rate ¥159.49 to ¥159.25; production value ¥5,190 億円 to ¥5,890 億円. One-offs: Q1 net +¥10 億円 (tariff +40, project-drop loss -30); Q2 net +¥10 億円 (reversal of project-drop provision).
Waterfall chart with assumption and one-off boxes
H1 operating profit beat the July forecast of ¥2,020 億円 at ¥2,459 億円: rationalization +10, utilization +290, price +30, FX +50, depreciation -8, lower semi-variable/fixed costs +60, other +7. Rate ¥157.25 to ¥159.37; production value ¥10,510 億円 to ¥11,080 億円.
Waterfall chart with assumption box
From ¥2,818 億円 in FY2025 to ¥5,200 億円 forecast: rationalization +310, utilization +2,700, price -390, FX +290, depreciation -80, semi-variable/fixed costs -1,000, other +552. Rate ¥150.78 to ¥157.19; production value ¥18,450 億円 to ¥22,780 億円. FY2025 one-offs totalled -¥438 億円 (SAW filter business goodwill impairment -438, fixed-asset impairment -45, environmental costs -15, micro primary battery divestiture gain +60, as listed on the slide); FY2026 forecast one-offs +¥20 億円.
Waterfall chart with assumption box and one-off callout
H2 operating profit forecast raised from ¥2,280 億円 to ¥2,741 億円: utilization +510, price +140, depreciation -30, semi-variable/fixed costs -190, other +31, with rationalization and FX at 0. Rate unchanged at ¥155.00; production value ¥10,790 億円 to ¥11,700 億円.
Waterfall chart with assumption box
Dividends rose from ¥445 億円 in FY15 to ¥1,186 億円 in FY25 and ¥1,263 億円 expected for FY26. Buybacks: ¥800 億円 (FY22), ¥800 億円 (FY24), ¥1,000 億円 (FY25), ¥1,500 億円 (FY26 expected). Total payout ratio about 69.8% for FY26; DOE 4.5% in FY25 and FY26 against a 5% target.
Stacked column chart (pink dividends, grey buybacks) with two line series on secondary axes for total payout and DOE
FY2025 Q1-Q4 and FY2026 Q1-Q2 (¥億円): revenue 4,162 / 4,866 / 4,675 / 4,606 / 5,023 / 5,885; operating profit 616 / 1,035 / 379 / 788 / 985 / 1,475; net profit 497 / 827 / 250 / 766 / 814 / 1,048; capex 347 / 407 / 888 / 836 / 410 / 455; depreciation 420-493; R&D 382-449; USD rate 144.60 to 159.25.
Six-quarter table with latest quarter outlined red
Quarterly revenue by segment and application for six quarters. Q2 FY2026: Capacitors 3,231, Inductors/EMI 707, Components 3,937, High-frequency 1,123, Energy & Power 439, Functional Devices 332, Devices & Modules 1,894; Communications 1,904, Mobility 1,372, Computers 1,322 (data center 952, up from 385 in FY25 Q1), Home 373, Industrial & other 914.
Two stacked tables (segment, application) sharing quarterly columns
Components operating margin rose from 26.0% (FY25 Q1) to 35.9% in FY26 Q2 (profit ¥1,420 億円 on ¥3,937 億円). Devices & Modules swung between losses and profit: -¥364 億円 in FY25 Q3, -¥129 億円 in FY26 Q1 and +¥81 億円 (4.3%) in Q2. Consolidated margin 25.1% in Q2.
Segment table with revenue, operating profit and margin rows per segment across six quarters
Murata logo with the 'Innovator in Electronics' tagline.
Centered logo on white
أسئلة شائعة حول هذه الشريحة ومحتوى العرض التقديمي الأساسي.
The original is a Japanese-language results briefing deck titled 2026年度 第2四半期決算説明会資料 (FY2026 Q2 earnings briefing materials), published by Murata Manufacturing on TDnet, the Tokyo Stock Exchange's timely-disclosure system, on October 30, 2026. This page provides an English page-by-page summary; the downloadable PDF and PPTX keep the original Japanese text.
Murata's fiscal year runs April to March, so FY2026 (2026年度) covers April 2026 to March 2027. The first half (H1) is April to September 2026, and Q2 is July to September 2026.
Revenue was ¥10,908 億円 (about ¥1.09 trillion), up 20.8% year on year, and operating profit was ¥2,459 億円 (about ¥246 billion), up 48.9%, both company records. Net profit attributable to owners was ¥1,862 億円. Q2 alone delivered ¥5,885 億円 revenue and a 25.1% operating margin.
The October forecast calls for revenue of ¥22,600 億円 (up ¥1,500 億円 from July) and operating profit of ¥5,200 億円 (up ¥900 億円), with net profit of ¥3,960 億円 and ROIC of 16.6%. Capex was raised to ¥2,700 億円, the dividend forecast was kept, and the ¥1,500 億円 buyback continues.
Murata plans roughly ¥1 trillion of investment from 2026 to 2030, about ¥3,500 億円 for buildings (three new plants in Japan and two overseas sites) and about ¥6,500 億円 for equipment, aiming to more than double MLCC sales from ¥0.9 trillion in FY2025. Spending ramps from FY2028 and is funded mainly from operating cash flow.
Very. Data-center-related sales doubled year on year to ¥1,649 億円 in H1 and are forecast at ¥4,250 億円 for the full year, and AI-server capacitor demand is the main reason for the guidance raise and the MLCC capacity expansion.
億円 (oku-en) means ¥100 million. Murata reports in this unit, so ¥10,908 億円 equals ¥1.0908 trillion. The summaries on this page keep the deck's own unit to avoid conversion errors.
Yes. The page offers the original PDF and an editable PPTX converted from it. The waterfall bridges, financial tables and segment commentary grids can serve as a template for your own earnings or results presentation.
Original Japanese-language deck as filed on TDnet

Create Your Own Slides
Turn your ideas into professional presentations in seconds with 2slides AI.
راجع التصاميم الاحترافية، اختر أسلوبك، وأنشئ شرائح بعرض نصي مثالي. مدعوم بـ Nano Banana—ابدأ في إنشاء عرضك التقديمي الآن.
وكيل الذكاء الاصطناعي الخاص بك للشرائح. وفر الوقت، أشرق بشكل أسرع مع إنشاء عروض تقديمية ذكية.


© 2026 2slides. جميع الحقوق محفوظة.