
ضمن مجموعة أمثلة عروض المستثمرين · أمثلة عروض المستثمرين من اليابان
Mitsubishi Heavy Industries (MHI, TSE: 7011) H1 FY2026 earnings presentation, the Japanese-language results deck (original title 2026年度第2四半期決算説明資料) dated November 6, 2026 and published on TDnet, the Tokyo Stock Exchange's timely disclosure system. It covers the six months to September 30, 2026 of MHI's fiscal year 2026 (April 2026 to March 2027): orders of ¥3,612.5 billion (36,125億円, +9%), revenue of ¥2,523.2 billion (25,232億円, +19%), business profit of ¥249.3 billion (2,493億円, +45%) and net profit attributable to owners of ¥203.2 billion (2,032億円, +77%), plus a full-year upgrade to ¥8 trillion of orders, ¥6 trillion of revenue and ¥600 billion of business profit and a new share buyback of up to ¥300 billion.
يستخدم غلاف هذا العرض مرجعًا للنمط لإنشاء شرائح من محتواك الخاص. أو اختر أي صفحة أدناه لاستخدام تخطيطها مرجعًا.
التنقل السريع
العلامات
مشاركة الشرائح
Mitsubishi Heavy Industries (MHI, TSE: 7011) H1 FY2026 earnings presentation, the Japanese-language results deck (original title 2026年度第2四半期決算説明資料) dated November 6, 2026 and published on TDnet, the Tokyo Stock Exchange's timely disclosure system. It covers the six months to September 30, 2026 of MHI's fiscal year 2026 (April 2026 to March 2027): orders of ¥3,612.5 billion (36,125億円, +9%), revenue of ¥2,523.2 billion (25,232億円, +19%), business profit of ¥249.3 billion (2,493億円, +45%) and net profit attributable to owners of ¥203.2 billion (2,032億円, +77%), plus a full-year upgrade to ¥8 trillion of orders, ¥6 trillion of revenue and ¥600 billion of business profit and a new share buyback of up to ¥300 billion.
عرض تفصيلي لكل صفحة شريحة، بما في ذلك التخطيط والمحتوى الرئيسي والعناصر المرئية.
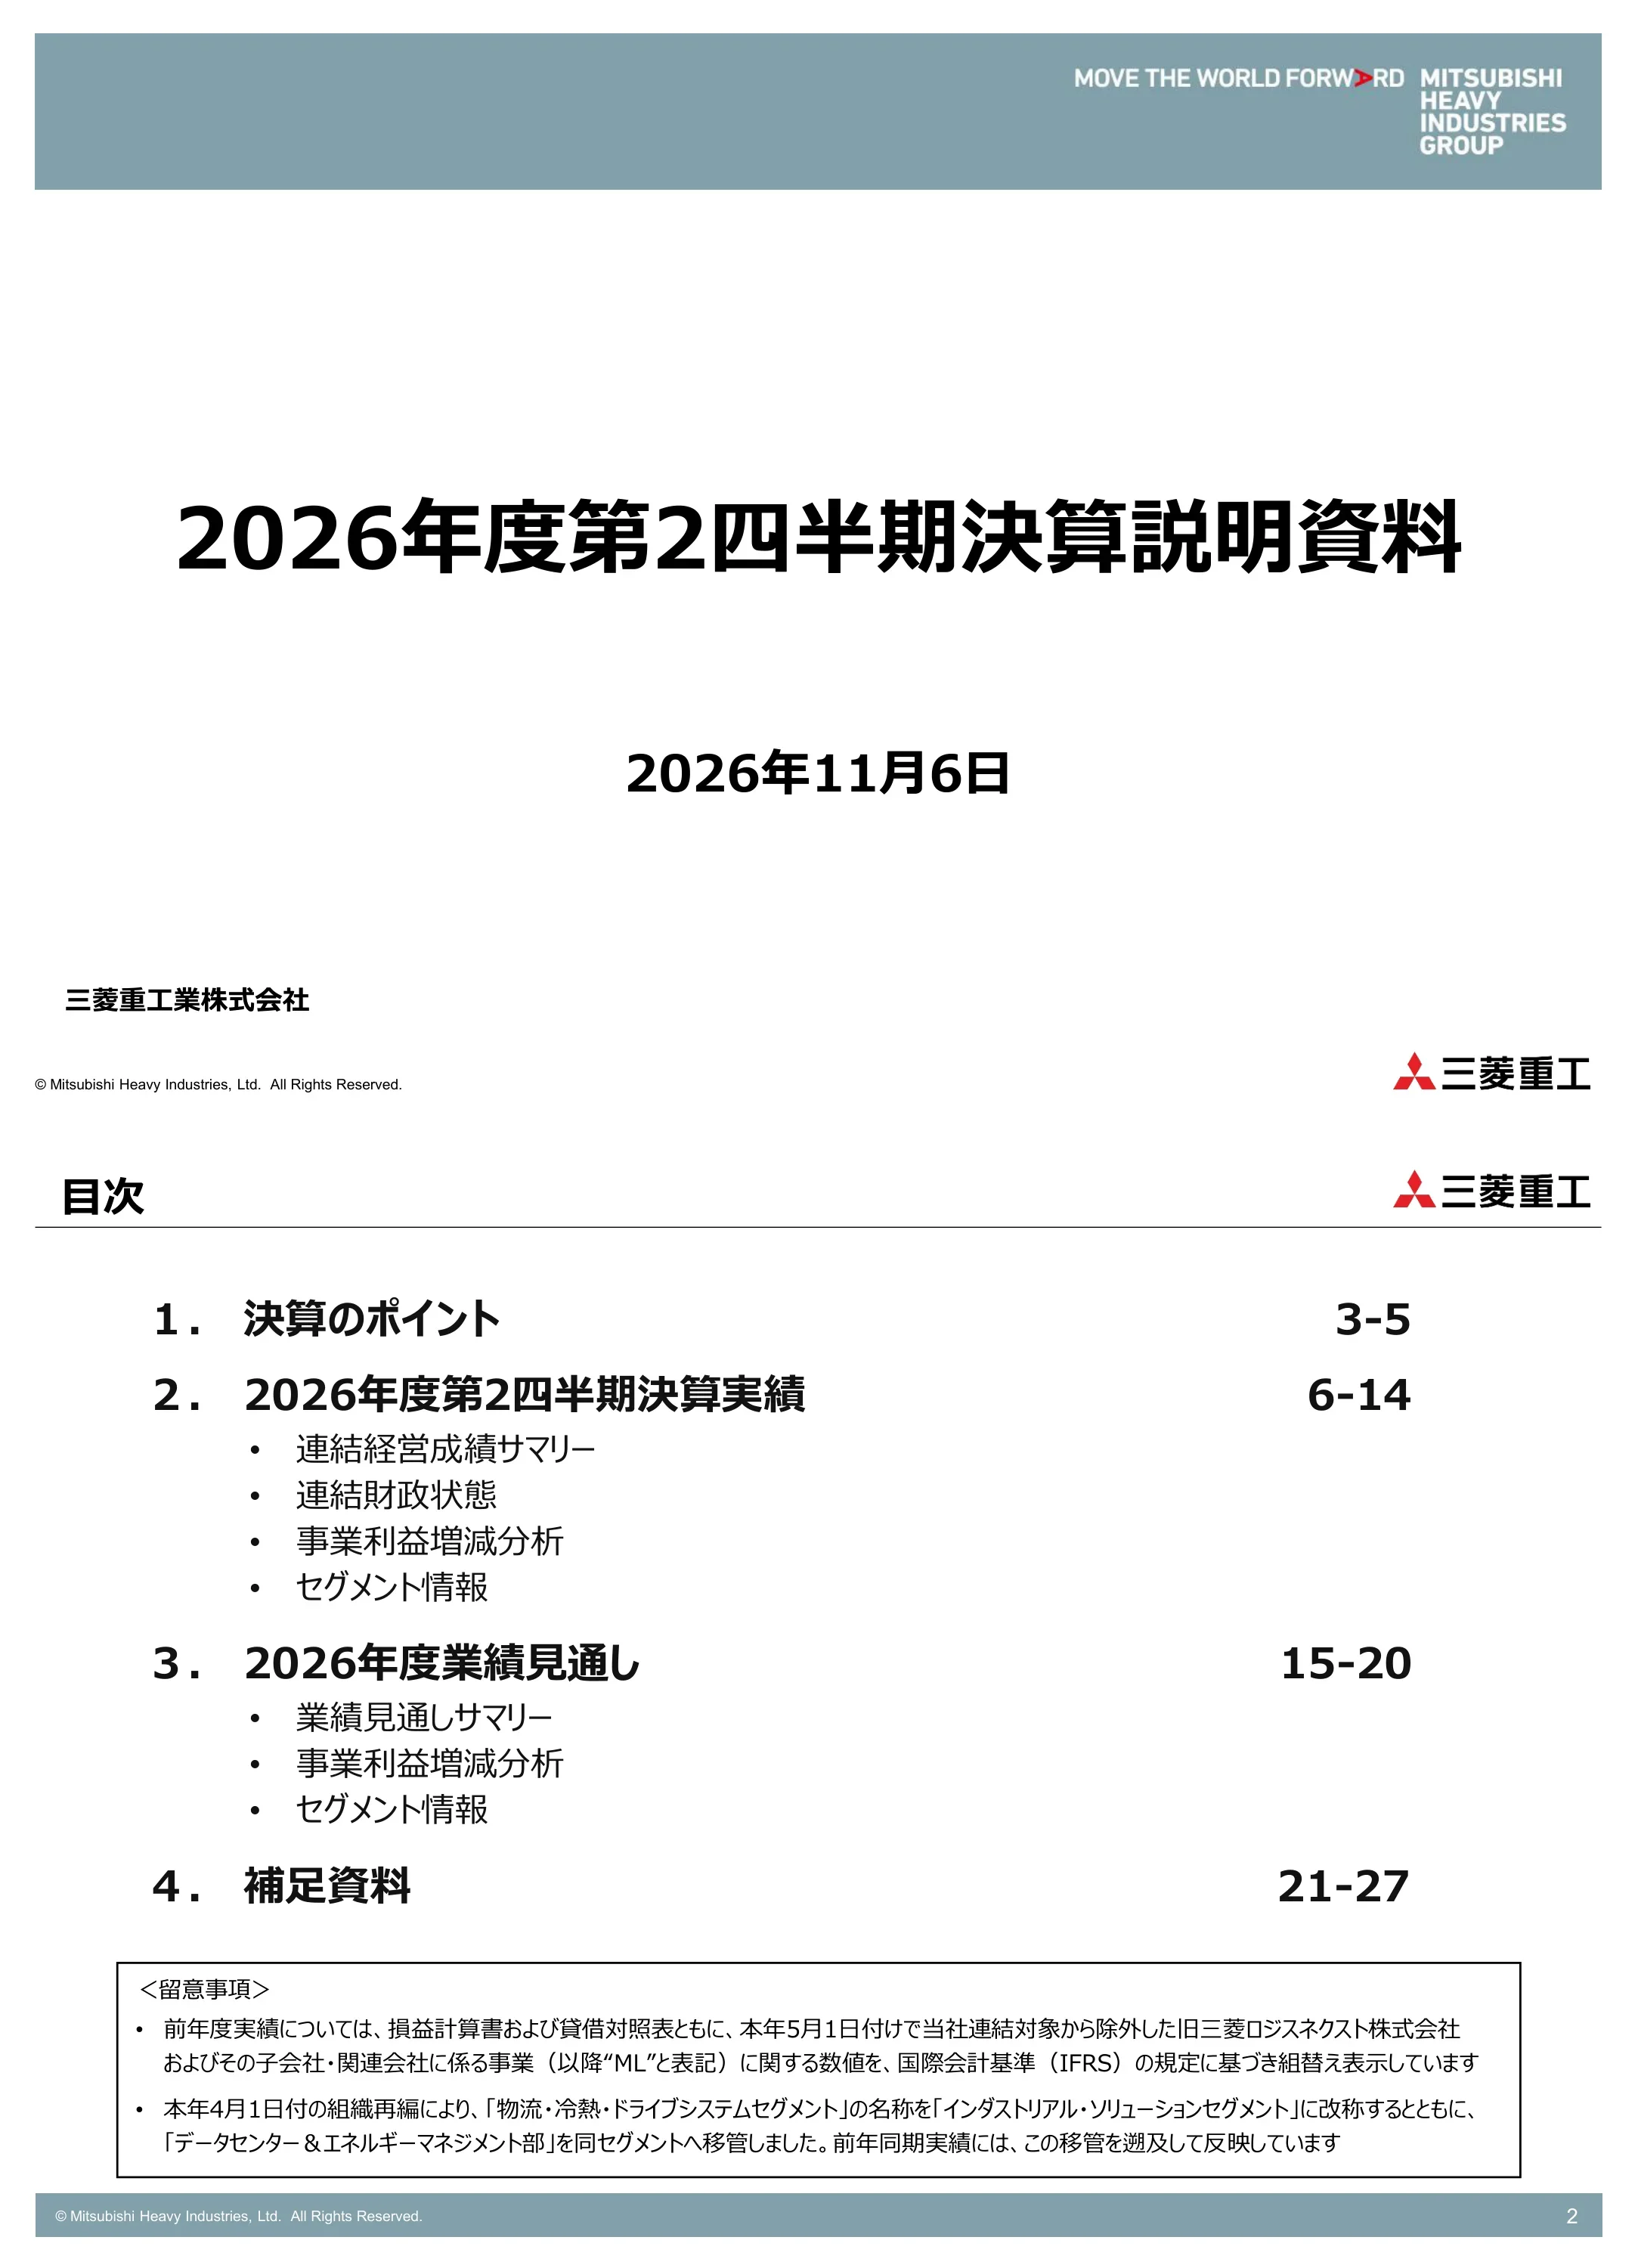
Title slide for Mitsubishi Heavy Industries' second-quarter (first-half) results for fiscal year 2026, dated November 6, 2026 (2026年11月6日). Issued by 三菱重工業株式会社 (Mitsubishi Heavy Industries, Ltd.). The 'Move the World Forward' tagline and Mitsubishi Heavy Industries Group wordmark sit in a grey-blue header band.
Full-width grey-blue header band with the brand tagline at top right; large centered Japanese title; date centered below; company name bottom left and the red three-diamond logo with 三菱重工 bottom right.
Agenda in four parts: 1. Results highlights (pp. 3-5); 2. FY2026 Q2 results (pp. 6-14), covering the consolidated summary, financial position, business profit bridge and segment information; 3. FY2026 forecast (pp. 15-20), covering the forecast summary, profit bridge and segment information; 4. Supplementary materials (pp. 21-27). A notes box explains two restatements: prior-year P&L and balance sheet figures are reclassified under IFRS to separate the business of the former Mitsubishi Logisnext and its subsidiaries and affiliates (labelled 'ML'), which left consolidation on May 1, 2026; and from April 1, 2026 the Logistics, Thermal & Drive Systems segment was renamed Industrial Solutions and absorbed the Data Center & Energy Management department, with prior-year figures restated retroactively.
Numbered agenda list with page ranges right-aligned and bulleted sub-items; a bordered notes box across the bottom.
Section break that opens the highlights part of the deck. No figures appear on this page.
Brand header band with large left-aligned section number and title on a white background.
KPI dashboard in ¥100 million (億円) comparing first halves FY24, FY25 and FY26. Orders: 33,835 (30,546 excluding ML) → 33,147 → 36,125, +9%, with an order backlog of ¥14.2 trillion (14.2兆円). Revenue: 22,981 (19,692 excl. ML) → 21,137 → 25,232, +19%. Business profit: 1,884 (1,680 excl. ML, 8.5% margin) → 1,715 (8.1%) → 2,493 (9.9%), +45%. Net profit attributable to owners of the parent: 1,071 → 1,149 → 2,032, +77%. Tiles on the right: EBITDA 3,134億円 (+837 YoY), EBITDA margin 12.4% (+1.6 pts); free cash flow 4,683億円 (+3,172), operating cash flow 3,945億円 (+1,866); interest-bearing debt 4,827億円 (down 1,249); net interest-bearing debt −12,239億円, i.e. a net cash position (down 11,156); D/E ratio 0.15 (down 0.09); equity ratio 38.7% (+3.1 pts).
Left two-thirds: four three-bar column charts (orders, revenue, business profit, net profit) with growth-rate bubbles and arrows to the latest value. Right third: six dark tiles with large headline figures for EBITDA, free cash flow, interest-bearing debt, D/E ratio and equity ratio.
Four narrative bullets. Orders of 36,125億円 (+2,978億円, +9%): Energy, Plant & Infrastructure and Industrial Solutions all grew, led by GTCC, nuclear and metals machinery; the order backlog rose 9,880億円 from the fiscal year-end to ¥14,225.6 billion (14兆2,256億円). Revenue of 25,232億円 (+4,095億円, +19%): all segments grew, led by GTCC, defense & space and nuclear. Business profit of 2,493億円 (+777億円, +45%): Energy, Industrial Solutions and Aircraft, Defense & Space improved, led by GTCC and nuclear. Net profit of 2,032億円 (+883億円, +77%): beyond the business profit gain, foreign exchange gains and financial income lifted the result substantially.
Single shaded panel with four square-bulleted blocks, each with a bold underlined headline figure and a two- or three-line explanation.
Section break that opens the detailed first-half results. No figures appear on this page.
Brand header band with large left-aligned section number and title.
Table in 億円 comparing FY2025-2Q [A] with FY2026-2Q [B]. Orders 33,147 → 36,125 (+2,978, +9.0%). Revenue 21,137 → 25,232 (+4,095, +19.4%). Business profit 1,715 (8.1%) → 2,493 (9.9%), +777 (+1.8 pts, +45.3%). Profit attributable to owners of the parent 1,149 (5.4%) → 2,032 (8.1%), +883 (+2.6 pts, +76.9%). EBITDA 2,296 (10.9%) → 3,134 (12.4%), +837 (+1.6 pts, +36.5%). Free cash flow 1,510 → 4,683 (+3,172), made up of operating cash flow 2,079 → 3,945 (+1,866) and investing cash flow −568 → +738 (+1,306).
Financial table with dark row-label column, prior-period, current-period (highlighted), change and change-rate columns; margins shown in parentheses under each profit line; separate blocks for EBITDA and cash flow.
Balance sheet in 億円, FY25 year-end vs. end of FY26-2Q. Trade receivables (incl. contract assets) 21,277 → 20,168 (−1,109); inventories 10,418 → 12,141 (+1,722); other current assets 22,707 → 21,912 (−794), of which cash and equivalents 13,348 → 17,067 (+3,718) and assets held for sale 5,484 → nil; fixed assets 9,783 → 9,884 (+101); investments 18,509 → 19,035 (+526); total assets 82,697 → 83,142 (+445). Liabilities: trade payables 10,008 → 9,484 (−523); contract liabilities 21,618 → 25,733 (+4,114); other 13,628 → 10,289 (−3,338), of which liabilities held for sale 2,819 → nil; interest-bearing debt 5,157 → 4,827 (−330); equity 32,284 → 32,807 (+523), of which equity attributable to owners of the parent 30,885 → 32,170 (+1,284). The held-for-sale lines fall to zero after the Mitsubishi Logisnext transfer.
Two stacked tables (assets above, liabilities and equity below) with three numeric columns: FY25 year-end, FY26-2Q end (highlighted) and change; sub-items shown in parentheses.
Waterfall from FY25-2Q business profit of 1,715億円 to FY26-2Q of 2,493億円 (+777億円, +45%). Drivers: revenue changes and margin improvement +1,030; foreign exchange +220; asset management +50 (50 in FY25-2Q vs. 100 in FY26-2Q); change in one-off costs −400 (FY25-2Q: South Africa and other −300; FY26-2Q: IGCC −700); wage increases and other −122. A footnote defines IGCC as the Integrated Coal Gasification Combined Cycle plant, referring to the Nakoso and Hirono IGCC plants delivered in 2021.
Horizontal waterfall chart with start and end columns, floating bars for each driver, callout boxes for asset management and one-off costs, and a long arrow labelled +777億円 (+45%).
Segment matrix in 億円, FY25-2Q (restated) vs. FY26-2Q. Energy: orders 19,812 → 23,042 (+3,230); revenue 8,710 → 11,225 (+2,515); business profit 807 → 1,451 (+643, +80%). Plant & Infrastructure: orders 4,906 → 6,895 (+1,988); revenue 4,159 → 4,298 (+138); profit 446 → 414 (−31, −7%). Industrial Solutions: orders 3,254 → 3,756 (+501); revenue 3,141 → 3,526 (+385); profit 67 → 147 (+80, +119%). Aircraft, Defense & Space: orders 5,450 → 2,968 (−2,481); revenue 5,388 → 6,334 (+946); profit 603 → 763 (+159, +27%). Other, corporate and eliminations: orders −277 → −537; revenue −262 → −152; profit −209 → −284. Totals: orders 33,147 → 36,125 (+2,978); revenue 21,137 → 25,232 (+4,095); profit 1,715 → 2,493 (+777, +45%). FY25 figures are restated as described on page 2.
Three grouped column blocks (orders, revenue, business profit), each with FY25, FY26 and change sub-columns; five segment rows plus a totals row.
Full-year row: FY25 actual orders 39,367 vs. FY26 forecast 44,000 (previously 35,500); revenue 20,626 vs. 26,500 (prev. 22,000); business profit 2,672 vs. 3,800 (prev. 3,400). Progress at end of Q2: orders 50% → 52%, revenue 42% → 42%, profit 30% → 38%. H1 orders 19,812 → 23,042 and revenue 8,710 → 11,225 in stacked bars; business profit 807 (9.3% margin) → 1,451 (12.9%), +80%. Sub-business H1 orders: GTCC 14,387 → 15,687; steam power 2,030 → 2,396; aero engines 1,311 → 1,821; nuclear 1,824 → 2,784. H1 revenue: GTCC 4,273 → 5,871; steam power 1,803 → 1,759; aero engines 1,257 → 1,713; nuclear 1,027 → 1,521. Profit up in GTCC, aero engines and nuclear; down in steam power. Key points: GTCC orders strong mainly in North America and Asia, with higher revenue and better project margins; steam power booked a loss on IGCC; aero engines grew orders and revenue mainly through MRO; nuclear orders and revenue steady; full-year orders, revenue and profit forecasts raised.
Top strip of full-year and progress-rate figures; three charts (stacked orders, stacked revenue, profit column with margin); sub-business tables bottom left; grey 'vs. prior year' panel and orange 'key points' box on the right.
Full-year: FY25 orders 11,580 vs. FY26 forecast 11,000 (prev. 10,000); revenue 8,808 vs. 10,000 (prev. 9,500); business profit 841 vs. 900. Q2 progress: orders 42% → 63%, revenue 47% → 43%, profit 53% → 46%. H1 orders 4,906 → 6,895; revenue 4,159 → 4,298; business profit 446 (10.7%) → 414 (9.6%). Sub-business orders: engineering 1,181 → 1,863; metals machinery 1,496 → 2,494; machinery systems 1,061 → 1,050. Revenue: engineering 704 → 901; metals machinery 1,916 → 1,899; machinery systems 798 → 808. Profit fell in engineering, metals machinery and machinery systems. Key points: orders strong in engineering, metals machinery and commercial ships (included in other); business profit dipped slightly as the prior year's high-margin projects did not repeat; full-year orders and revenue forecasts raised.
Same template as the Energy page: forecast strip, stacked order and revenue columns, profit columns with margins, sub-business tables, and a blue key-points box.
Full-year: FY25 orders 7,047 vs. FY26 forecast 7,500; revenue 6,999 vs. 7,500; business profit −20 vs. 300 (FY25 restated for the April 1, 2026 reorganisation). Q2 progress: orders 46% → 50%, revenue 45% → 47%, profit n/a → 49%. H1 orders 3,254 → 3,756; revenue 3,141 → 3,526; business profit 67 (2.1%) → 147 (4.2%), +119%. Sub-business orders: engines & turbochargers 1,261 → 1,393; HVAC & car air-conditioning 1,708 → 1,898. Revenue: engines & turbochargers 1,268 → 1,406; HVAC & car air-conditioning 1,596 → 1,709. Profit up in engines. Key points: engine orders strong in Asia and HVAC steady on air-conditioning engineering; profit improved on higher engine revenue and the weaker yen.
Segment template with forecast strip, stacked columns, profit columns with margin, two-row sub-business tables, and a green key-points box; footnote on restated FY25.
Full-year: FY25 orders 19,294 vs. FY26 forecast 18,000 (prev. 17,500); revenue 13,938 vs. 16,000 (prev. 15,000); business profit 1,515 vs. 1,800 (prev. 1,700). Q2 progress: orders 28% → 16%, revenue 39% → 40%, profit 40% → 42%. H1 orders 5,450 → 2,968; revenue 5,388 → 6,334; business profit 603 (11.2%) → 763 (12.1%), +27%. Sub-business orders: defense & space 4,276 → 1,538; commercial aircraft 1,173 → 1,429. Revenue: defense & space 4,193 → 4,896; commercial aircraft 1,194 → 1,438. Profit up in defense & space and commercial aircraft. Key points: defense & space orders fell against large prior-year contracts, but revenue and profit rose on steady project progress; commercial aircraft revenue and profit rose on more shipments; full-year orders, revenue and profit forecasts raised.
Segment template with forecast strip, stacked two-part columns, profit columns with margin, sub-business tables and a maroon key-points box.
Section break with a forward-looking-statements disclaimer: forecasts are based on information currently available, involve risks and uncertainties, and are not a commitment; actual results may differ materially due to the economy, the yen's exchange rate against the dollar and other currencies, and Japanese stock prices. An underlined note says the forecast does not include the impact of the Middle East situation; direct effects on current orders and the supply chain are limited, but the situation is fluid and MHI will keep monitoring it.
Brand header band, large section title, and a bordered disclaimer box with the Middle East note underlined.
Revised from the August 4, 2026 forecast; assumed rates ¥150/US$ and ¥180/euro; figures in 億円. FY2025 actual → previous FY2026 forecast → new forecast (change vs. FY2025): orders 76,536 → 70,000 → 80,000 (+3,463, +4.5%); revenue 49,741 → 54,000 → 60,000 (+10,258, +20.6%); business profit 4,322 (8.7%) → 5,400 (10.0%) → 6,000 (10.0%), +1,677 (+1.3 pts, +38.8%); net profit attributable to owners 3,321 (6.7%) → 3,800 (7.0%) → 4,400 (7.3%), +1,078 (+1.4 pts, +32.5%); ROE 12.2% → 12% → 14% (+1.8 pts); EBITDA 5,537 (11.1%) → 6,600 (12.2%) → 7,200 (12.0%), +1,662 (+0.9 pts, +30.0%); free cash flow 8,934 → 6,000 → 8,000 (−934). Dividend per share ¥25 (interim ¥12 / year-end ¥13) → ¥29 (¥14 / ¥15), unchanged in the new forecast, +¥4. A share buyback of up to 3,000億円 is newly announced, with details in a separate same-day notice on the buyback and cancellation of treasury shares.
Wide forecast table with FY2025 actual, previous and current forecast (blue underlined) and change columns; a framed banner at the top notes the revision; FX assumptions top left.
Headline: GTCC, nuclear and defense are progressing better than initially planned, which the company says confirms a foundation for continued growth beyond 7,000億円 of business profit. Waterfall from FY25 business profit of 4,322億円 to the FY26 forecast of 6,000億円: revenue and margin improvement +1,940 (+830 assumed at the start of the year); FX +250 (+60 at the start of the year); asset management +40; change in one-off costs −300 (+400 at the start of the year); wage increases and other −252. One-off costs: FY25 −600 (South Africa and other −300; Power Systems Solutions goodwill impairment −300); FY26 −900 (IGCC −700; risk buffer −200). The arrow is labelled +1,679億円 (+39%), slightly different from the +1,677 shown on pages 16 and 18.
Shaded headline banner above a waterfall chart with start and end columns (axis breaks shown), floating driver bars, a callout box on one-off costs and a long growth arrow.
Revised from August 4, 2026; figures in 億円 as FY25 actual (restated) / previous forecast / new forecast / change vs. FY25. Energy: orders 39,367 / 35,500 / 44,000 / +4,632; revenue 20,626 / 22,000 / 26,500 / +5,873; profit 2,672 / 3,400 / 3,800 / +1,127 (+42%). Plant & Infrastructure: orders 11,580 / 10,000 / 11,000 / −580; revenue 8,808 / 9,500 / 10,000 / +1,191; profit 841 / 900 / 900 / +58 (+7%). Industrial Solutions: orders 7,047 / 7,500 / 7,500 / +452; revenue 6,999 / 7,500 / 7,500 / +500; profit −20 / 300 / 300 / +320. Aircraft, Defense & Space: orders 19,294 / 17,500 / 18,000 / −1,294; revenue 13,938 / 15,000 / 16,000 / +2,061; profit 1,515 / 1,700 / 1,800 / +284 (+19%). Other and eliminations: orders −753 / −500 / −500 / +253; revenue −631 / 0 / 0 / +631; profit −685 / −900 / −800 / −114. Total: orders 76,536 / 70,000 / 80,000 / +3,463; revenue 49,741 / 54,000 / 60,000 / +10,258; profit 4,322 / 5,400 / 6,000 / +1,677 (+39%).
Three grouped blocks (orders, revenue, business profit), each with FY25 actual, previous and current forecast and change columns; revised values in blue underline; revision banner above.
Energy: orders 39,367 → 44,000 (prev. 35,500); revenue 20,626 → 26,500 (prev. 22,000); business profit 2,672 (13.0%) → 3,800 (14.3%; prev. 3,400), +42%. Revision points: orders raised in every sub-business, for example new prospects added in GTCC and more fuel-cycle-related work in nuclear; revenue raised on steady project progress and profit raised on better GTCC margins. Sub-business FY25 → FY26 forecast: GTCC orders 26,526 → 30,000 (prev. 24,000), revenue 9,922 → 12,800 (prev. 11,000); steam power orders 4,137 → 3,500 (prev. 3,300), revenue 3,675 → 4,000 (prev. 3,300); aero engines orders 2,917 → 3,300 (prev. 2,600), revenue 2,741 → 3,300 (prev. 2,600); nuclear orders 5,406 → 6,000 (prev. 4,500), revenue 3,611 → 5,500 (prev. 4,000). Plant & Infrastructure: orders 11,580 → 11,000 (prev. 10,000); revenue 8,808 → 10,000 (prev. 9,500); business profit 841 (9.5%) → 900 (9.0%), +7%. Revision points: orders raised for a large Middle East engineering order in Q2 and new metals machinery prospects; revenue raised on project progress. Engineering orders 3,819 → 2,500 (prev. 1,800), revenue 1,616 → 1,800; metals machinery orders 3,076 → 4,000 (prev. 3,500), revenue 3,656 → 4,000; machinery systems orders 1,952 → 1,800, revenue 1,819 → 1,800.
Two horizontal bands, one per segment, each with three FY25 vs. FY26 column charts on the left and a revision-points box plus sub-business table on the right; vertical segment labels on the far left.
Industrial Solutions: no change to the forecast. Orders 7,047 → 7,500; revenue 6,999 → 7,500; business profit −20 → 300 (4.0% margin), labelled a return to profit (黒字転換). Engines & turbochargers orders 2,850 → 3,000, revenue 2,856 → 3,000; HVAC & car air-conditioning orders 3,610 → 3,700, revenue 3,531 → 3,700 (FY25 restated for the reorganisation). Aircraft, Defense & Space: orders 19,294 → 18,000 (prev. 17,500); revenue 13,938 → 16,000 (prev. 15,000); business profit 1,515 (10.9%) → 1,800 (11.3%; prev. 1,700), +19%. Revision points: orders raised in both sub-businesses on first-half results; revenue raised on steady defense & space project progress and on commercial aircraft shipments and production plans, lifting the profit outlook. Defense & space orders 16,826 → 15,200 (prev. 15,000), revenue 11,445 → 13,200 (prev. 12,500); commercial aircraft orders 2,468 → 2,800 (prev. 2,500), revenue 2,492 → 2,800 (prev. 2,500).
Mirrors page 19: two segment bands with column charts on the left and revision-point boxes plus sub-business tables on the right; green box for Industrial Solutions and pink box for Aircraft, Defense & Space.
Section break that opens the reference data. No figures appear on this page.
Brand header band with large left-aligned section number and title.
Large gas turbine order units, FY25-2Q / FY25 full year / FY26-2Q: Americas 12 / 19 / 11; Asia 11 / 12 / 8; EMEA – / 4 / –; other – / – / –; total orders 23 (10GW) / 35 (16GW) / 19 (8GW). Contract backlog 67 units (29GW) / 74 (33GW) / 83 (37GW). Reference: orders at the Chinese partner company 4 / 13 / 4. Commercial aircraft shipsets delivered by quarter: Boeing 777 FY25 6, 8, 4, 5 = 23, FY26 7, 7 = 14 so far; 777X FY25 0, 3, 5, 1 = 9, FY26 1, 7 = 8; 787 FY25 18, 17, 16, 22 = 73, FY26 21, 22 = 43.
Left: gas turbine orders table by region with a backlog row and a small China partner table. Right: three quarterly delivery grids (777, 777X, 787) with diagonal strikes for future quarters.
Order backlog in 億円, FY25 year-end → FY26-2Q end: Energy 69,832 → 80,640; Plant & Infrastructure 21,028 → 23,270; Industrial Solutions 875 → 1,088; Aircraft, Defense & Space 40,632 → 37,247; other 8 → 10; total 132,376 → 142,256. Unhedged foreign currency (in 億 of currency units): business profit exposure US$22 / €5; financial income/expense exposure US$24 / –; assumed rates ¥150.0 and ¥180.0. Average revenue recognition rates: US$ ¥146.4 → ¥158.1; euro ¥165.8 → ¥183.7. R&D (broad definition, incl. contracted research) 1,041 → 1,414 (FY26 forecast 3,500); depreciation 580 → 641 (1,200); capex 695 → 780 (2,100). SG&A 2,983 → 3,341. Energy aftermarket service share of revenue (cumulative), FY25-2Q → FY26-2Q: GTCC 51% → 42%; steam power 78% → 82%; aero engines 78% → 76%; nuclear 71% → 71%; Energy total 64% → 59%.
Grid of five small tables with underlined headings (backlog, unhedged FX, FX rates on the left; R&D/depreciation/capex, SG&A and Energy service ratio on the right) and three footnotes.
Group revenue by region in 億円, FY25-2Q → FY26-2Q: Japan 9,137 (43%) → 10,273 (41%); Asia-Pacific 3,334 (16%) → 3,929 (16%); Americas 5,986 (28%) → 7,596 (30%); EMEA 2,678 (13%) → 3,433 (14%); total 21,137 → 25,232. Energy (8,710 → 11,225): Japan 2,889 → 3,314; Asia-Pacific 1,358 → 1,695; Americas 3,184 → 4,640 (41% of the segment); EMEA 1,277 → 1,574. Plant & Infrastructure (4,159 → 4,298): Japan 1,725 → 1,636; Asia-Pacific 832 → 976; Americas 1,004 → 762; EMEA 596 → 922. Industrial Solutions (3,141 → 3,526): Japan 710 → 791; Asia-Pacific 1,133 → 1,228; Americas 526 → 660; EMEA 770 → 846. Aircraft, Defense & Space (5,388 → 6,334): Japan 4,076 → 4,686 (75%); Asia-Pacific 8 → 27; Americas 1,270 → 1,529; EMEA 33 → 90. Some data labels overlap the bars in the segment charts but remain readable.
Left: group table and clustered column chart. Right: four smaller clustered column charts, one per segment, each with its own colour pair and totals in the legend.
Message: cash receipts are coming in ahead of schedule, mainly in growth businesses, so cash and deposits have risen sharply; the surplus will fund working capital for the high backlog and, together with cash earned from FY2027 onward, growth investment for a high-profit structure. Cash allocation outlook for the 2024 Medium-Term Business Plan period (FY24–FY26), in 億円: cash in 29,000 = growth businesses 17,500 + competitiveness-strengthening businesses 6,300 + logistics equipment 1,200 + asset sales etc. 4,000; cash out = increase in cash and deposits 13,000 + growth businesses 4,700 + competitiveness 5,500 + shareholder returns 5,800 (including the 3,000 buyback), with the last three totalling 16,000. From FY27: delivering the backlog (pre-received advances of ¥2.6 trillion at end of FY26-2Q) and capacity investments currently expected of about 5,000億円 for GTCC (hot-section parts etc.), 2,500 for defense equipment, 1,000 for nuclear (large machining equipment, with new plants in view), 1,000 for commercial ships (high-density outfitting and hull block capacity) and 1,000 for data-center power-generation engines, plus common manufacturing and talent infrastructure; also domain expansion, R&D (next-generation GTCC, unmanned aircraft, resilience technology, core parts) and M&A/investments.
Headline banner; left: two stacked columns (cash in and cash out) with a dotted 'cash increase' block and arrow; right: dark-headed panel listing investment categories with amounts; upward arrow labelled cash earned from FY27 onward.
Progress of ITO (Innovative Total Optimization) across three pillars. Total optimisation and domain expansion: advanced production processes that cut lead times through process improvement and automation (e.g. doubling new GTCC production capacity); concrete domain expansion using common platforms and combinations of businesses (e.g. steam generation using waste heat); faster North American expansion of the data-center business (orders for data-center equipment, North American certification for turbo chillers); active use of external partners (capital and business alliance with Preferred Networks, PFN). Business portfolio optimisation: transfer of Mitsubishi Logisnext completed and agreement to transfer the Bombardier-related business-jet Tier 1 business. Goal: a cycle of high profitability and investment in growth. Bottom banner: FY26 business profit forecast of 6,000億円 vs. the 2024 Medium-Term Business Plan target of 4,500億円 or more.
Two overlapping coloured headers (blue and pink) above a white initiatives panel on the left; plus sign, green portfolio box, downward arrow and dark-blue 'target state' panel on the right; ITO logo and target banner along the bottom.
Timeline from 2026 to 2050. Changes in society: international political instability, realistic progress towards carbon neutrality (CN), and advancing technological innovation, leading to large, previously unexpected changes. MHI's role: delivering the value society needs through social infrastructure and industrial machinery, framed as resilience. Six business opportunities: balancing economy and environment; safety and security; stable energy supply; diversifying social infrastructure needs; stronger business continuity management (BCM); and rebuilding the manufacturing industrial base.
Horizontal timeline at the top, a 'changes in society' band with a yellow glow, a long blue 'resilience' arrow, and six illustrated opportunity icons arranged around a central '6 business opportunities' label.
Closing page with the Mitsubishi Heavy Industries logo (三菱重工) and the 'Move the World Forward' Mitsubishi Heavy Industries Group wordmark. No figures.
White background with the large centered logo and the tagline at top right.
أسئلة شائعة حول هذه الشريحة ومحتوى العرض التقديمي الأساسي.
The original is a Japanese-language earnings presentation (決算説明資料) titled 2026年度第2四半期決算説明資料, dated November 6, 2026. Mitsubishi Heavy Industries (TSE code 7011) published it on TDnet, the Tokyo Stock Exchange's timely disclosure system. The slide-by-slide analysis on this page is an English reading of that deck, with yen amounts kept in the company's own units.
MHI's fiscal year 2026 runs from April 2026 to March 2027, so the second-quarter (first-half) results cover April 1 to September 30, 2026. The full-year forecast in the deck is for the year ending March 2027.
Most tables are in 億円, which is ¥100 million. For example, H1 revenue of 25,232億円 equals about ¥2.52 trillion, and business profit of 2,493億円 equals about ¥249 billion. 兆円 is ¥1 trillion, so the 14.2兆円 order backlog is ¥14.2 trillion. △ before a number means a negative value or a decrease.
Orders were 36,125億円 (+9%), revenue 25,232億円 (+19%), business profit 2,493億円 (+45%, 9.9% margin) and net profit attributable to owners 2,032億円 (+77%). EBITDA was 3,134億円 and free cash flow was 4,683億円. The order backlog reached 14兆2,256億円.
Compared with the August 4, 2026 forecast, orders were raised from 70,000 to 80,000億円, revenue from 54,000 to 60,000億円, business profit from 5,400 to 6,000億円, net profit from 3,800 to 4,400億円, EBITDA from 6,600 to 7,200億円 and free cash flow from 6,000 to 8,000億円. ROE guidance went from 12% to 14%. The dividend stays at ¥29 per share, and a share buyback of up to 3,000億円 was added.
Energy led: H1 business profit rose 80% to 1,451億円 on gas turbine (GTCC) growth in North America and Asia, nuclear and aero engine MRO, partly offset by an IGCC loss in steam power. Aircraft, Defense & Space profit rose 27% to 763億円 on defense project progress and more commercial aircraft shipments, and Industrial Solutions more than doubled to 147億円. Plant & Infrastructure profit dipped 7% to 414億円.
The supplementary page shows 19 large gas turbine orders (8GW) in H1 FY2026: 11 in the Americas and 8 in Asia. The contract backlog reached 83 units (37GW), up from 74 units (33GW) at the end of FY2025. The full-year GTCC order forecast was raised to 30,000億円.
Yes. The page provides the original PDF and an editable PowerPoint (PPTX) conversion. Because the source is in Japanese, the slide text in both files stays in Japanese; use the English analysis on this page alongside them.
Original Japanese-language filing dated November 6, 2026

Create Your Own Slides
Turn your ideas into professional presentations in seconds with 2slides AI.
راجع التصاميم الاحترافية، اختر أسلوبك، وأنشئ شرائح بعرض نصي مثالي. مدعوم بـ Nano Banana—ابدأ في إنشاء عرضك التقديمي الآن.
وكيل الذكاء الاصطناعي الخاص بك للشرائح. وفر الوقت، أشرق بشكل أسرع مع إنشاء عروض تقديمية ذكية.


© 2026 2slides. جميع الحقوق محفوظة.