
ضمن مجموعة أمثلة عروض المستثمرين
Lam Research Corporation's September quarter 2026 (fiscal Q1 2027) earnings presentation, dated October 21, 2026: record revenue of $8.22B and non-GAAP EPS of $2.20, non-GAAP operating margin above 40% for the first time (40.2%), CSBG revenue of $2.49B, a WFE outlook of a mid-$150B range for CY26 and a preliminary >$200B for CY27, and December 2026 quarter guidance of $8.60B +/- $400M revenue and $2.33 +/- $0.15 non-GAAP EPS.
يستخدم غلاف هذا العرض مرجعًا للنمط لإنشاء شرائح من محتواك الخاص. أو اختر أي صفحة أدناه لاستخدام تخطيطها مرجعًا.
التنقل السريع
العلامات
مشاركة الشرائح
Lam Research Corporation's September quarter 2026 (fiscal Q1 2027) earnings presentation, dated October 21, 2026: record revenue of $8.22B and non-GAAP EPS of $2.20, non-GAAP operating margin above 40% for the first time (40.2%), CSBG revenue of $2.49B, a WFE outlook of a mid-$150B range for CY26 and a preliminary >$200B for CY27, and December 2026 quarter guidance of $8.60B +/- $400M revenue and $2.33 +/- $0.15 non-GAAP EPS.
عرض تفصيلي لكل صفحة شريحة، بما في ذلك التخطيط والمحتوى الرئيسي والعناصر المرئية.
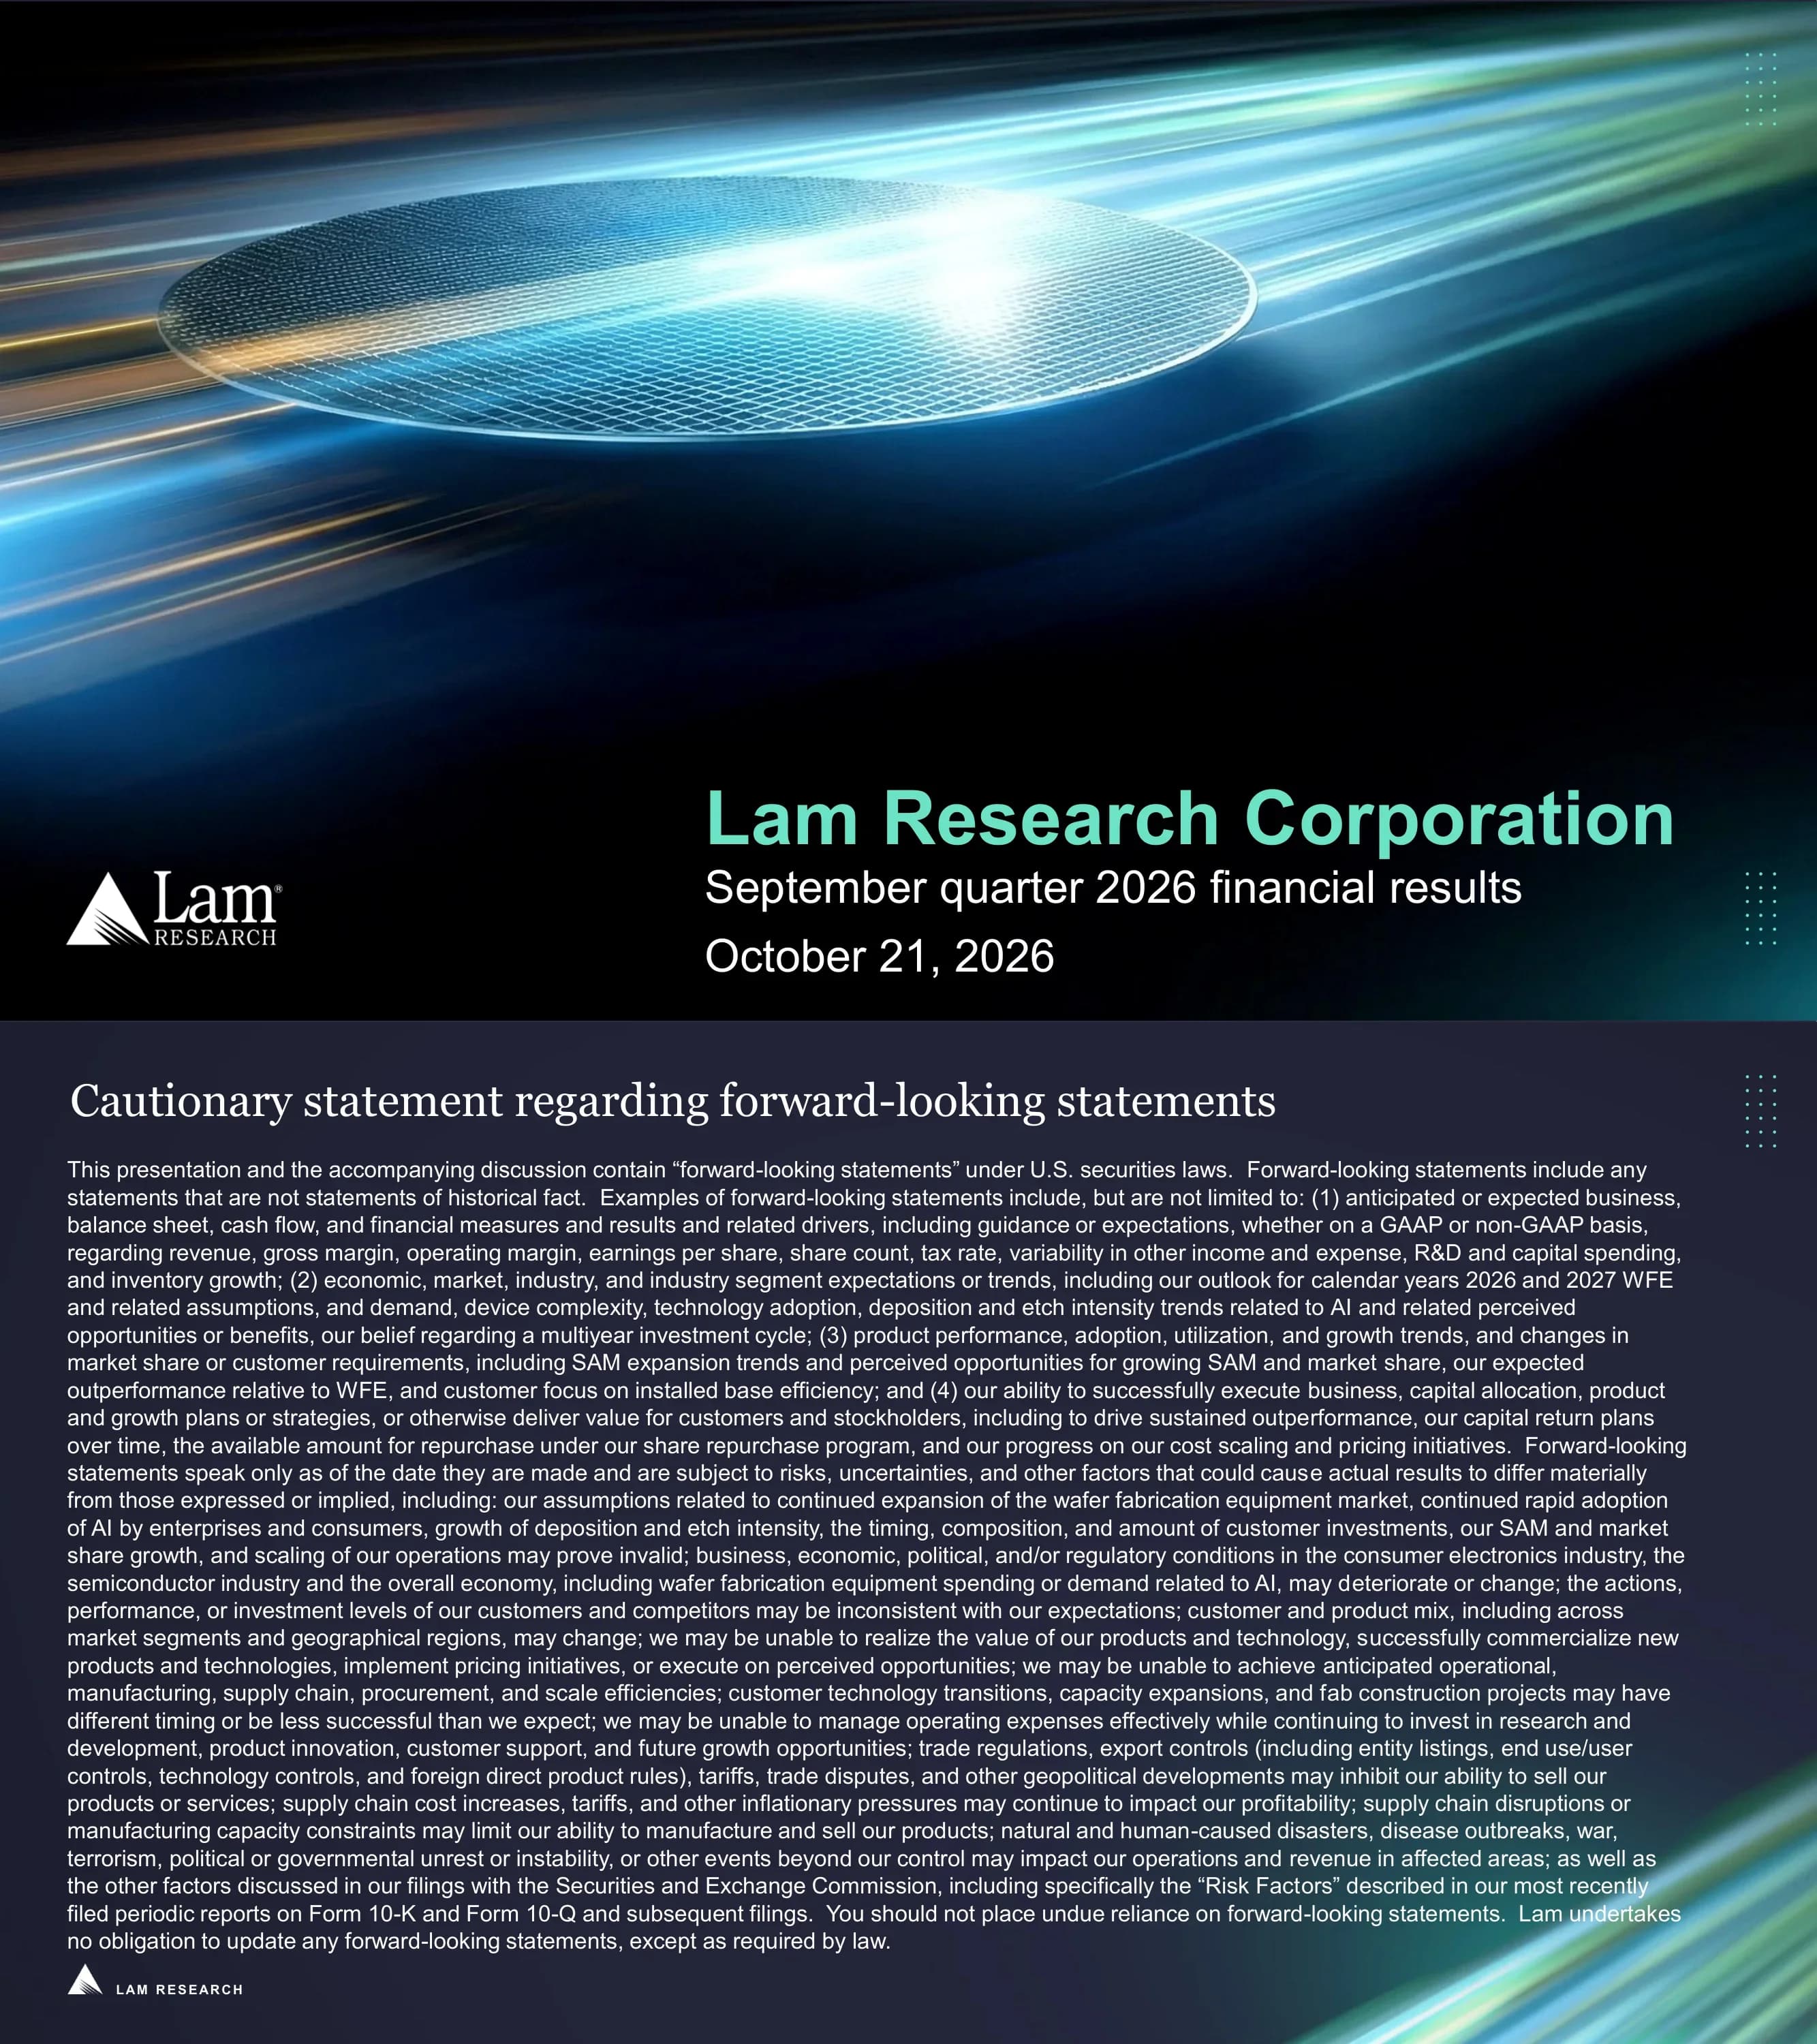
Cover slide announcing Lam Research Corporation's September quarter 2026 financial results, dated October 21, 2026.
Full-bleed hero image of a glowing silicon wafer amid blue and amber light streaks; large mint-teal company name and white subtitle/date set at the bottom right, white Lam Research logo at the bottom left.
Safe-harbor disclaimer listing forward-looking topics (guidance, CY26 and CY27 WFE outlook, AI-driven deposition and etch intensity, SAM expansion, capital return) and the risks that could cause results to differ, including export controls, tariffs and supply chain constraints.
Serif title at the top left over a single dense full-width paragraph of small body text on a dark navy background; logo footer at the bottom left.
Company snapshot showing fiscal 2026 GAAP revenue of $23.2B, R&D of $2.4B and ~24,300 employees as of September 27, 2026, with 14 primary locations from Fremont, CA to Batu Kawan, Malaysia. Awards include Forbes World's Best Employers, Fortune World's Most Admired Companies and Ethisphere World's Most Ethical Companies.
Left column with a large white logo and mint-teal serif tagline; right side with three KPI tiles across the top, a location list beside a world map with teal pins, and a two-column awards panel below.
Section divider introducing the business review and industry outlook by Tim Archer, President and Chief Executive Officer.
Light-streak band across the top third; large white serif section title in the lower left with a mint-teal italic presenter line, flanked by a vertical dotted column.
September quarter set another record, with gross margin, operating margin and EPS at record levels and non-GAAP operating margin above 40% for the first time. Lam expects CY26 systems revenue to grow well over 40%, a third consecutive year of WFE outperformance, and sees AI adoption underpinning CY27; WFE is put at a mid-$150B range for CY26 and a preliminary >$200B for CY27, with cleanroom space and component supply limiting the industry.
Three equal translucent cards, each topped by a teal rule, with mint-teal serif headings and white body text; a full-width outlined banner below carries the bold WFE outlook and a supply-constraint note.
Lam expects QLC, TLC and SLC-class NAND storage tiers to all grow as each is optimized for different AI workloads, and notes that SLC adoption could become a meaningful driver of wafer capacity because it needs more capacity for the same bit demand. Lam says it is well positioned with the industry's largest NAND installed base and a comprehensive deposition and etch portfolio.
Two-tone headline (white roman plus mint-teal italic); a large close-up wafer photo on the left half and three stacked text cards with teal top rules on the right.
Under advanced patterning, Akara conductor etch has been adopted by multiple chipmakers and Aether dry resist is ramping in HBM high-volume manufacturing, with ~$2.5B cumulative revenue expected by the end of the decade. Under backside power, the slide lists production-proven VECTOR, SABRE and Flex, Halo gaining traction in emerging moly applications, and tool-of-record wins at a leading customer.
Two side-by-side columns, each with a cropped 3D chip render banner above an outlined card holding a mint-teal serif heading, bold product subheads and bullets.
In TSV and bonding, Syndion won four new positions in advanced logic and HBM TSV applications, Striker ALD won multiple TSV liner positions, and VECTOR and TEOS 3D won high-energy bonding film and inter-die gap fill applications. In panel-level packaging, panel plating systems have shipped to >20 customers, and Lam expects its panel-level position to surpass its wafer-level packaging position.
Left outlined panel with an isometric 3D package render and a serif callout statement; right side has two stacked cards (TSV & bonding, Panel-level packaging) with mint-teal serif headings and bullets.
The Customer Support Business Group expects CY26 revenue to grow >30% YoY, with broad-based growth across upgrades, spares and services. Equipment Intelligence and Dextro cobots helped secure performance-based service contracts with multiple memory manufacturers, and CSBG expects >15% revenue growth in CY27.
Large outlined text panel on the left two-thirds with a two-tone serif headline and plus-sign bullets (first bullet highlighted in bold mint-teal); right third is a black background with a glowing Lam triangle bursting with teal-green light rays.
Closing thesis of the CEO section: Lam sees the early stages of a multiyear investment cycle with customer visibility through 2028, rising deposition and etch intensity from manufacturing complexity, new materials and advanced packaging, and positioning from technology leadership, a growing installed base and investments in products and capacity.
Italic mint-teal serif title over a darkened circuit-board photo; three equal outlined cards, each with a thin-line teal icon at the top and white text below.
Section divider introducing the financial results and outlook by Doug Bettinger, Executive Vice President and Chief Financial Officer.
Same template as page 4: light-streak band at the top, large white serif two-line title at the lower left, mint-teal italic presenter credit, vertical dotted column.
Headline results: September quarter 2026 revenue of $8.22B vs $6.72B in the June quarter, and non-GAAP EPS of $2.20 vs $1.82, based on about 1.256 billion diluted shares in both quarters.
Product photo of a white Lam process tool on the left half; right half has two stacked KPI cards with teal caps labels, oversized mint-teal serif figures and the prior-quarter comparison beneath.
Systems revenue by segment: Foundry 46%, Memory 46% (NVM 26%, DRAM 20%) and Logic/Other 8%. Revenue by region: China 35%, Korea 20%, Taiwan 18%, Japan 9%, US 8%, SEA 6% and Europe 4%.
Two pie charts side by side separated by a thin vertical divider, each with an uppercase heading and outside data labels; a highlighted teal 'Memory 46%' callout groups the two memory slices.
CSBG revenue was $2.49B in the September quarter 2026, compared with $2.47B in the June quarter 2026 and $1.78B in the September quarter 2025.
Cleanroom photo of two engineers in bunny suits on the left half; a single KPI card on the right with a teal caps label, large mint-teal serif figure and two comparison lines.
Comparison of QSep'26 vs QJun'26: revenue $8,219M vs $6,722M, non-GAAP gross margin 52.4% vs 52.0%, non-GAAP operating expenses $1,004M vs $916M, non-GAAP operating income $3,301M vs $2,581M (40.2% vs 38.4% of revenue), non-GAAP tax rate 16.5% vs 11.0%, GAAP diluted EPS $2.19 vs $1.81 and non-GAAP diluted EPS $2.20 vs $1.82, on 1,256M diluted shares.
Full-width two-period financial table: line items on the left, the current-quarter column filled solid mint-teal with bold black figures, and the prior quarter in white on navy; teal rules at the top and bottom.
Share repurchases rose to $1,011M from $246M and dividends were $325M; gross cash reached $7,451M, DSO improved to 63 days from 72, inventory turns rose to 3.4 from 3.0, and deferred revenue was $2,661M. Capex was $258M and headcount ~24,300, with estimated future revenue from Japan shipments of about $468M noted in the footnote.
Same comparison-table template as page 15 with 13 rows: label column, highlighted mint-teal QSep'26 column, plain QJun'26 column, and a two-line footnote.
Guidance for the December 2026 quarter: revenue of $8.60B +/- $400M, non-GAAP gross margin of 52.5% +/- 1%, non-GAAP operating margin of 40.5% +/- 1%, and non-GAAP EPS of $2.33 +/- $0.15 based on about 1.253 billion diluted shares.
Serif title at the top left over a black background with diagonal blue-amber light streaks; four stacked translucent guidance bars on the right, each with a large mint-teal figure and white label.
Q&A divider slide for the analyst question-and-answer session.
Centered oversized white serif 'Q&A' over a dark full-bleed blue light-streak background.
Reconciles U.S. GAAP net income of $2,753,138K to non-GAAP net income of $2,768,417K for the September 2026 quarter ($2,277,282K to $2,279,968K for the June quarter), adjusting for intangible amortization, EDC valuation items, workforce optimization charges and $11,454K of tax expense from a change in tax law. Results are non-GAAP EPS of $2.20 vs GAAP EPS of $2.19.
Serif 'Appendix - reconciliation' title with a centered table caption; dense accounting table with indented line items and two right-aligned period columns, single and double underlines on totals.
GAAP gross margin of $4,298,853K (52.3%) reconciles to non-GAAP $4,305,019K (52.4%); GAAP operating expenses of $1,015,126K reconcile to non-GAAP $1,004,280K; GAAP operating income of $3,283,727K (40.0% margin) reconciles to non-GAAP $3,300,739K (40.2%). June quarter comparatives are shown alongside.
Same appendix template: title, centered caption, two-period accounting table with subtotal rules and percentage rows.
GAAP other income, net of $28,493K reconciles to non-GAAP other income of $16,131K in the September quarter after note-discount amortization and a $12,870K gain on the EDC-related asset; the June quarter moves from $41,654K to ($19,167K).
Short four-row reconciliation table placed in the upper half under the appendix title and centered caption, leaving generous negative space below.
Operating cash flow of $3,497,652K less $257,697K of capex and intangibles gives free cash flow of $3,239,955K for the September quarter; calendar year to date, $6,096,300K of operating cash flow less $778,102K gives free cash flow of $5,318,198K.
Three-row table with 'Three Months Ended' and 'Calendar Year to Date' columns under the appendix title and caption.
GAAP income before taxes of $3,312,220K and tax expense of $559,082K give a 16.9% GAAP tax rate; after non-GAAP items, non-GAAP pre-tax income of $3,316,870K and tax expense of $548,453K give a 16.5% non-GAAP rate. June quarter rates were 10.9% GAAP and 11.0% non-GAAP.
Long accounting table filling the slide under the appendix title, with indented pre-tax items, dollar-sign columns and rule lines on subtotals.
Reconciles GAAP to non-GAAP guidance for the quarter ending December 27, 2026: revenue $8.60B +/- $400M, gross margin 52.5% +/- 1% ($2.7M reconciling item), operating margin 40.5% +/- 1% ($3.0M), EPS $2.33 +/- $0.15 ($3.3M) and 1.253 billion diluted shares. A paragraph explains the estimate's limitations and itemizes the reconciling amounts.
Three-group table (U.S. GAAP, Reconciling Items, Non-GAAP) in the upper half, followed by an explanatory paragraph and three bullets.
Defines 24 acronyms used in the deck, including WFE (wafer fabrication equipment), SAM (served available market), CSBG, HBM, TSV, ALD, QLC/TLC/SLC, NVM, Moly (molybdenum) and KV-cache.
Two side-by-side acronym tables with ACRONYM and DEFINITION headers; acronym cells filled solid mint-teal with bold dark text, definitions in white on navy.
Closing slide with the Lam Research logo.
Centered white logo over a full-bleed dark background with diagonal blue light streaks.
أسئلة شائعة حول هذه الشريحة ومحتوى العرض التقديمي الأساسي.
The 26-page deck, dated October 21, 2026, covers Lam's results for the September 2026 quarter (fiscal Q1 2027). It includes a company snapshot, a CEO business review on NAND, foundry/logic, DRAM, advanced packaging and the Customer Support Business Group, then CFO financial results, December 2026 quarter guidance, Q&A, five GAAP-to-non-GAAP reconciliation appendices and a glossary.
Revenue was a record $8.22B ($8,219M), up from $6.72B in the June quarter. Non-GAAP gross margin was 52.4%, non-GAAP operating margin was 40.2% (above 40% for the first time), non-GAAP EPS was $2.20 and GAAP EPS was $2.19. CSBG revenue was $2.49B, and quarterly free cash flow was about $3.24B.
Lam guided to revenue of $8.60B +/- $400M, non-GAAP gross margin of 52.5% +/- 1%, non-GAAP operating margin of 40.5% +/- 1%, and non-GAAP EPS of $2.33 +/- $0.15, based on about 1.253 billion diluted shares. The deck puts WFE at a mid-$150B range for CY26 and a preliminary >$200B for CY27.
It uses a dark navy background with mint-teal accents, elegant serif headlines paired with clean sans-serif body text, and a small dotted-grid motif in the top-right corner. Cover and divider slides use dramatic blue light-streak photography. Content slides use translucent cards with teal top rules, oversized serif KPI numerals, pie charts in a teal-yellow-orange palette, and tables whose current-quarter column is filled solid mint-teal.
Yes. This page offers the original PDF and an editable PPTX download. Lam Research publishes the deck as a PDF; the PPTX is a conversion of that PDF, so every slide's text, charts and layout can be edited in PowerPoint, Keynote or Google Slides. You can also use the Create Slides Like This flow on 2Slides to generate a new deck in the same style with your own content.
Follow its flow: cover, safe-harbor statement, company snapshot, a CEO section (record highlights in three cards, market and technology slides, closing thesis), a CFO section (KPI highlight cards, revenue mix pie charts, a quarter-over-quarter results table, capital return metrics, a guidance slide), then Q&A, reconciliation appendices and a glossary. Keep one accent color for the current period so the latest numbers stand out, and only use numbers your filings support.
Systems revenue by market segment was Foundry 46%, Memory 46% (NVM 26% and DRAM 20%) and Logic/Other 8%. Total revenue by region was China 35%, Korea 20%, Taiwan 18%, Japan 9%, US 8%, Southeast Asia 6% and Europe 4%.
It comes from Lam Research's investor relations website, which posts quarterly earnings materials on its quarterly results page (investor.lamresearch.com/quarterly-results).
Official quarterly results page hosting Lam Research's earnings presentations, press releases and webcasts, including the September quarter 2026 materials.

Create Your Own Slides
Turn your ideas into professional presentations in seconds with 2slides AI.
راجع التصاميم الاحترافية، اختر أسلوبك، وأنشئ شرائح بعرض نصي مثالي. مدعوم بـ Nano Banana—ابدأ في إنشاء عرضك التقديمي الآن.
وكيل الذكاء الاصطناعي الخاص بك للشرائح. وفر الوقت، أشرق بشكل أسرع مع إنشاء عروض تقديمية ذكية.


© 2026 2slides. جميع الحقوق محفوظة.