
ضمن مجموعة أمثلة عروض المستثمرين · أمثلة عروض المستثمرين من الهند
Hindalco Industries' Q2 FY27 earnings presentation (quarter ended September 30, 2026; Indian FY27 runs April 2026 to March 2027), dated November 6, 2026 and filed with BSE/NSE. The 36-slide Aditya Birla Group deck covers safety and sustainability, the global and Indian macro backdrop, aluminium LME trends, domestic aluminium and copper demand, consolidated and India-business financials, segment results for Novelis, Aluminium Upstream, Aluminium Downstream and Copper, capital allocation, the Hindalco++ growth project pipeline and detailed annexure tables. Consolidated revenue reached ₹91,708 crore (+39% YoY), business segment EBITDA ₹13,869 crore (+52%) and PAT ₹7,533 crore (+59%). Amounts are in ₹ crore as the company reports them; Novelis operating metrics are shown in US$ under US GAAP.
يستخدم غلاف هذا العرض مرجعًا للنمط لإنشاء شرائح من محتواك الخاص. أو اختر أي صفحة أدناه لاستخدام تخطيطها مرجعًا.
التنقل السريع
العلامات
مشاركة الشرائح
Hindalco Industries' Q2 FY27 earnings presentation (quarter ended September 30, 2026; Indian FY27 runs April 2026 to March 2027), dated November 6, 2026 and filed with BSE/NSE. The 36-slide Aditya Birla Group deck covers safety and sustainability, the global and Indian macro backdrop, aluminium LME trends, domestic aluminium and copper demand, consolidated and India-business financials, segment results for Novelis, Aluminium Upstream, Aluminium Downstream and Copper, capital allocation, the Hindalco++ growth project pipeline and detailed annexure tables. Consolidated revenue reached ₹91,708 crore (+39% YoY), business segment EBITDA ₹13,869 crore (+52%) and PAT ₹7,533 crore (+59%). Amounts are in ₹ crore as the company reports them; Novelis operating metrics are shown in US$ under US GAAP.
عرض تفصيلي لكل صفحة شريحة، بما في ذلك التخطيط والمحتوى الرئيسي والعناصر المرئية.
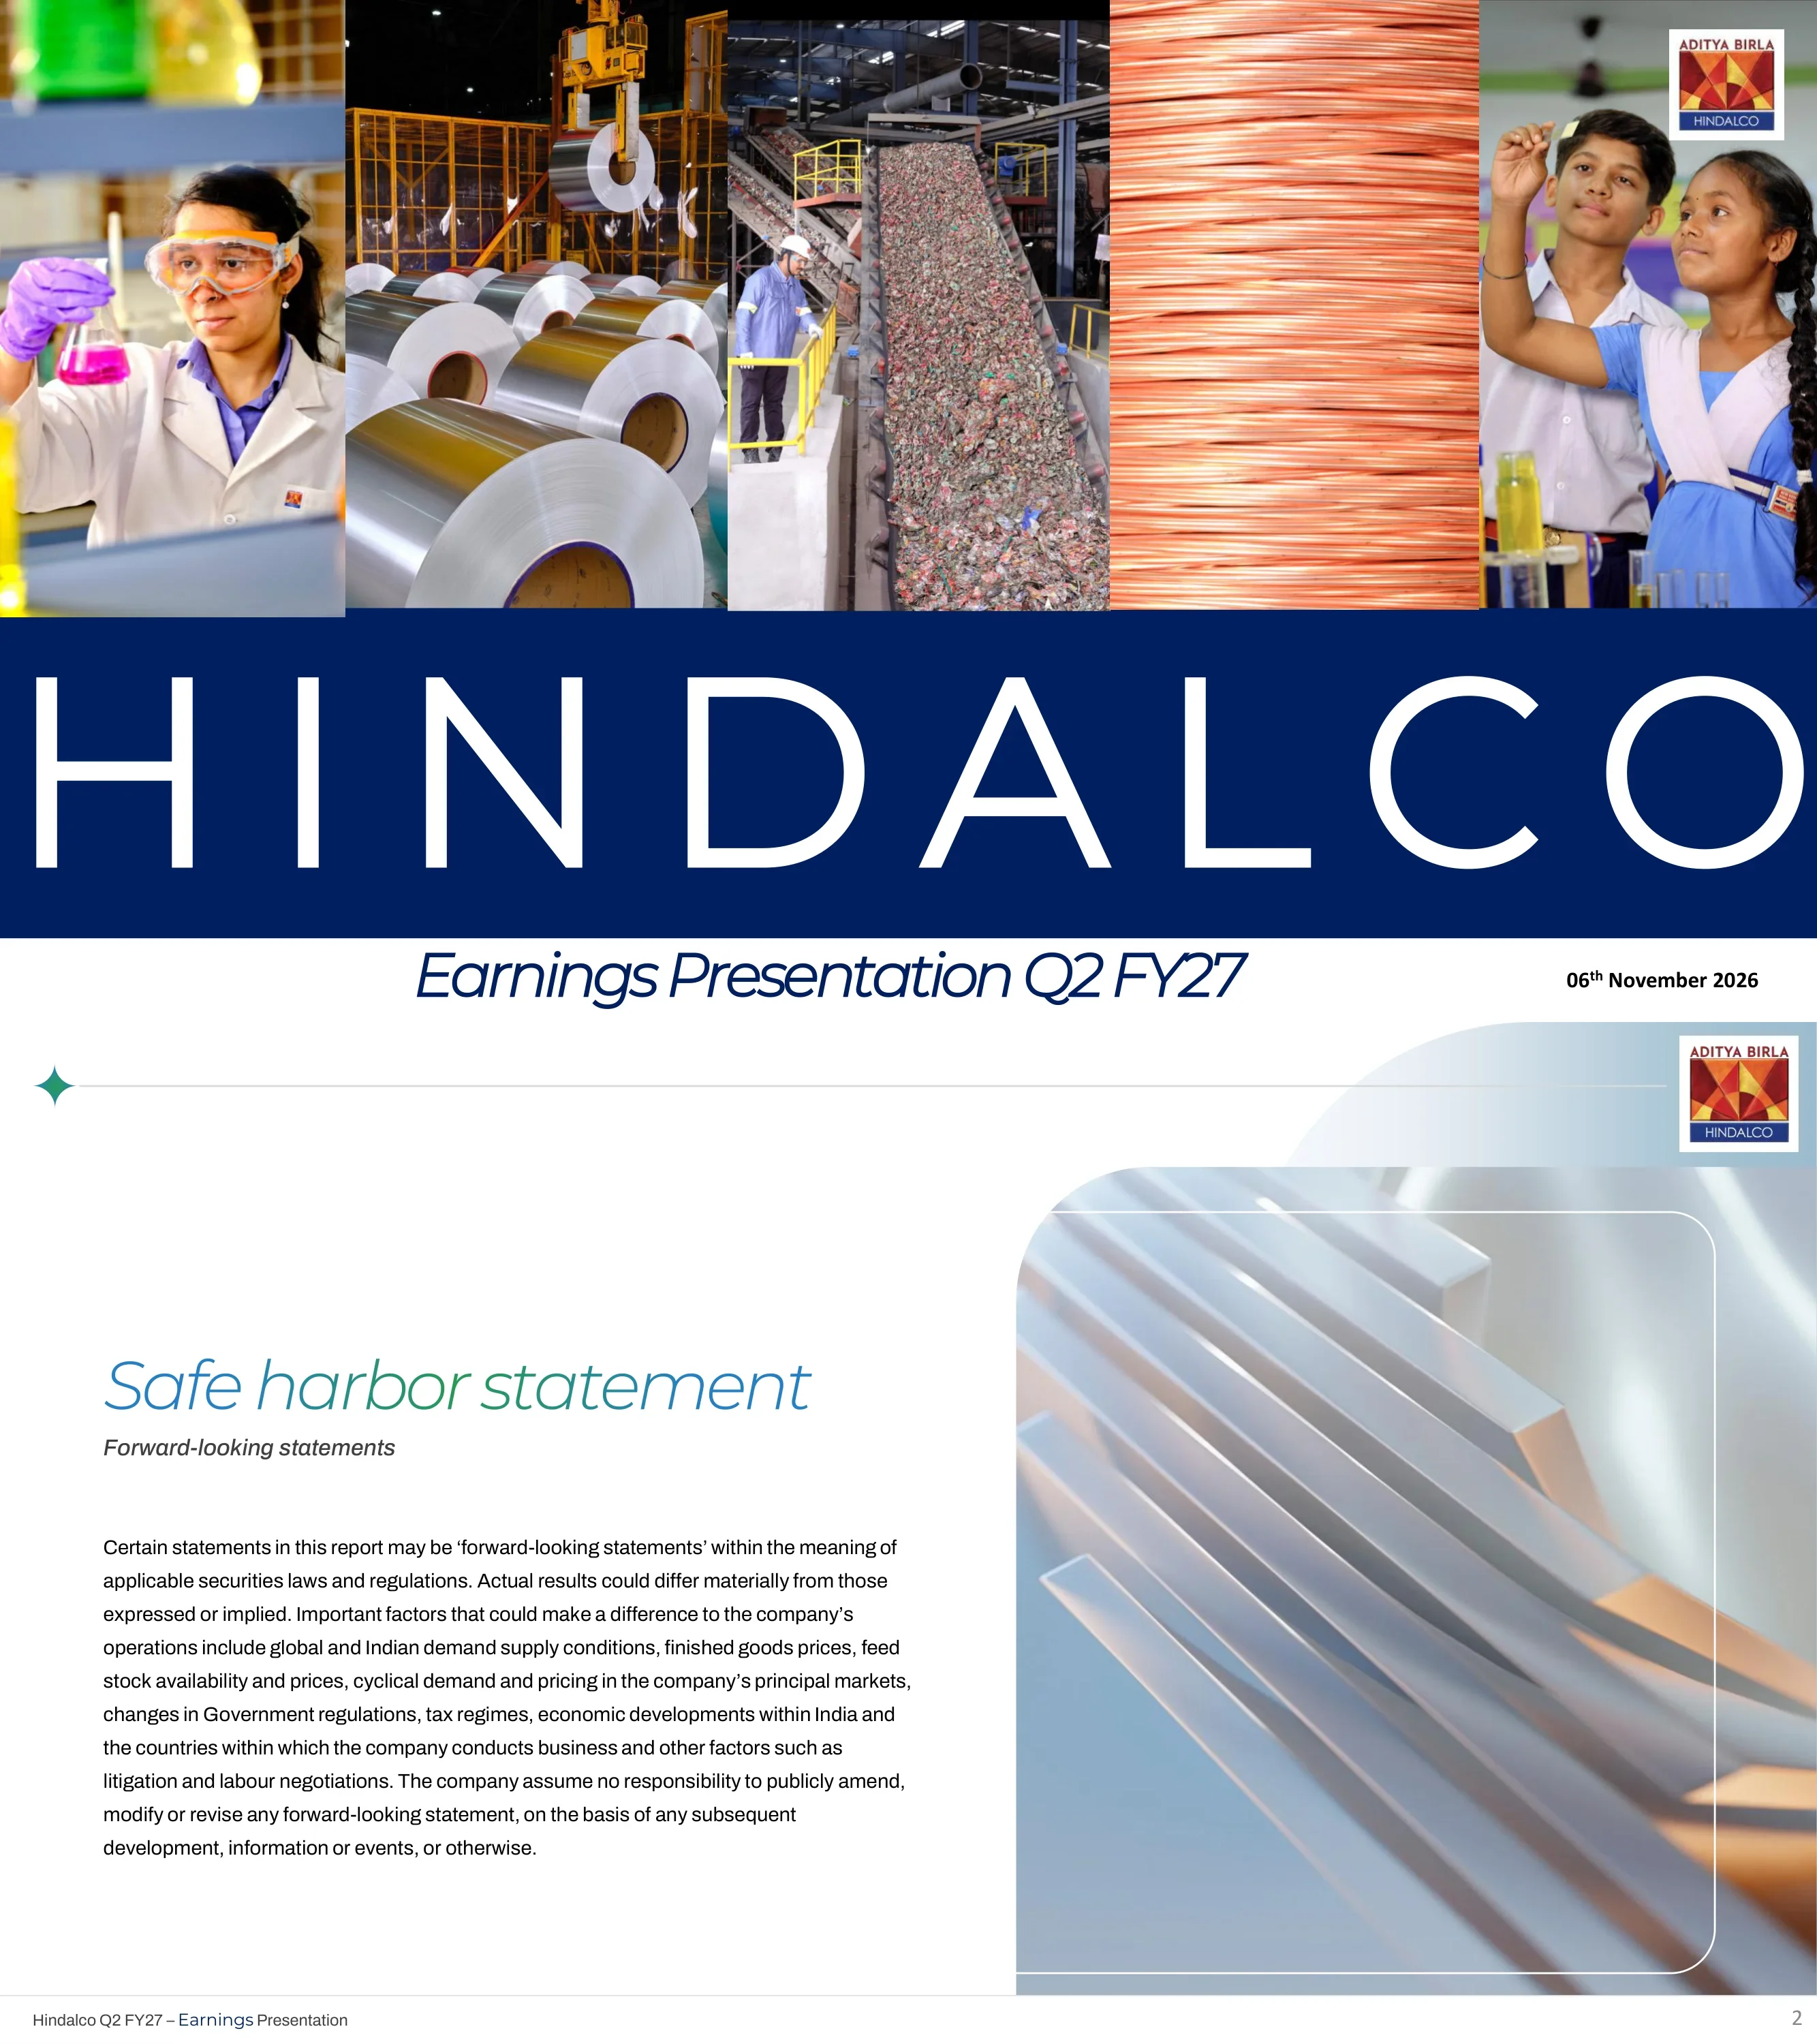
Title slide reading 'HINDALCO – Earnings Presentation Q2 FY27', dated 6 November 2026, with the Aditya Birla Hindalco logo.
Five-panel photo strip across the top half (lab scientist, aluminium coils, scrap recycling conveyor, copper wire, school children), large white 'HINDALCO' wordmark on a navy band, italic subtitle and date along the bottom.
Forward-looking statements disclaimer: results may differ materially due to global and Indian demand-supply conditions, finished goods prices, feedstock availability and prices, cyclical demand and pricing, government regulation, tax regimes, economic developments and litigation or labour negotiations; the company assumes no obligation to update.
Left text column with gradient italic heading and a paragraph of body copy; right half filled with an abstract metallic image inside a rounded frame.
Agenda with four sections: Safety & Sustainability Updates, Business Environment, Financial Performance, Key Summary.
Stacked list of four pale tiles on the left; large photo of operators at a rolling mill with an aluminium coil on the right.
Section break introducing the safety and sustainability updates.
Blue-to-green translucent vertical bands over a full-bleed aerial photo of a floating solar plant beside an industrial site; section title in a rounded outline box at lower left.
Hindalco (India) LTIFR fell to 0.16 in Q2 FY27 from 0.27 in Q2 FY26 (0.22 Q3 FY26, 0.18 Q4 FY26, 0.21 Q1 FY27). Fatality table: zero employee and contractor fatalities in Q2 FY27; one contractor fatality in Q3 FY26 and one employee fatality in Q4 FY26. Highlights: Aditya Alumina Refinery won the British Safety Council Award 2026; an AI-powered Behaviour Based Safety observation app launched in 22+ regional languages; 40 certified TapRooT investigation experts developed.
Three columns: italic headline with worker photo on the left, LTIFR bar chart above a fatality table in the centre, three text highlights on the right.
Total waste utilisation was 62% in Q2 FY27, hit by monsoons. Ash recycling fell to 77% (from 96% in Q2 FY26 and 95% in Q1 FY27) due to higher rainfall and logistics issues. Bauxite residue recycling (excluding Utkal) was 93% versus 104% a year earlier and 142% in Q1, as offtake moderated with monsoon and reduced rake availability. Copper slag recycling was 110% (119% in Q2 FY26), supported by abrasives and ready-mix concrete demand.
Headline banner across the top; three stacked five-quarter bar charts in the centre, each with an explanatory note to the right; italic title and aerial photo of a reclaimed mine site on the left.
Specific freshwater consumption (m3 per tonne of metal, including power plants, refineries, smelters and downstream). Aluminium: 28.75 in Q2 FY27 versus 33.49 in Q2 FY26 and 41.37 in Q1 FY27; recycling rate 33% vs 30%; rainwater harvesting met 22.8% of plant water demand. Copper: 6.75 versus 8.29 a year earlier (5.52 in Q1 FY27); recycling rate 24% vs 23%. Footnote: calculated on plant freshwater use, excluding colony, rainwater and desalinated water.
Two stacked bar charts (aluminium in blue, copper in green) with commentary to the right; italic title and reservoir aerial photo on the left; footnote at the bottom.
Cumulative trees planted rose from 4.05 million (Mar-23) to 4.88 million (Mar-24), 5.41 million (Mar-25), 6.26 million (Mar-26) and 6.80 million (Sep-26). About 0.54 million saplings were planted including Miyawaki plantations. A conservation programme for IUCN Red List rare, endangered and threatened species runs at 10 high-priority sites, and a No Net Loss project began at Belagavi covering 123 hectares of habitat restoration.
Green bar chart of cumulative plantations top centre, callout to its right, two text statements below; title and bird photo (bluethroat) on the left; definitions in footnotes.
Installed renewable capacity grew from 189 MW (Mar-25) to 292 MW (Sep-25), 470 MW (Mar-26) and 643 MW (Sep-26: solar 379, wind 260, hydel 4), with 884 MW targeted at the March 2027 exit (solar 501, wind 379, hydel 4) after adding solar +53 and wind +120. Hybrid pumped storage: 35 MW tied up plus 90 MW to tie up, 125 MW at FY27 exit. Aluminium specific GHG emissions were 19.4 tCO2e/t in Q2 FY27 versus 19.5 in Q2 FY26 and 19.0 in Q1 FY27.
Upper bar chart of renewable MW with a capacity breakdown under each period, pumped-storage line beneath, lower bar chart of GHG intensity; title and solar-farm photo on the left.
Section break introducing the economy and industry updates.
Translucent blue and green bands over a night-time city skyline photo with light trails; title in a rounded outline box at lower left.
Global GDP growth: 3.8% (CY22), 3.5% (CY23), 3.3% (CY24), 3.5% (CY25), projected 3.1% (CY26) and 3.4% (CY27); global inflation projected to rise from 4.1% in 2025 to 4.7% in 2026 before easing to 4.1% in 2027. India GDP growth: 8.1% (Q2 FY26), 7.7%, 8.6%, 7.8% (Q1 FY27), projected 7.2% (Q2 FY27) and 6.9% (Q3 FY27). RBI projects FY27 GDP growth of 7.1% versus 7.8% in FY26 and inflation rising from 2% to 5.2%; the slide states the Monetary Policy Committee raised the repo rate by 25 bps to 5.5% and moved to a 'calibrated tightening' stance.
Two horizontal bands: global GDP bar chart with commentary on top, India GDP bar chart with commentary below, separated by a green rule.
Aluminium LME (US$/tonne): FY25 average 2,526, FY26 average 2,772, Q1 FY27 3,576, Q2 FY27 3,227, Q3 FY27 to date 3,071. Q2 FY27 supply: global production -1% YoY (Yunnan increases offset by Shandong closures in China; Indonesia, India and Europe up, Middle East and Africa down). Demand: global consumption +1% YoY (China B&C and solar soft, offset by NEV; packaging and electrical recovery elsewhere offset by transport weakness). Medium term: global deficit likely to widen to ~0.8 mt in CY26 (pre-conflict 0.3 million), with FY27 supply additions in Indonesia, Vietnam and restored Middle East output.
Line chart of LME prices across five periods (dashed segment for the current quarter to date) across the top; supply, demand and medium-term text blocks below.
Indian aluminium demand (kilo tons) stacked by domestic primary, scrap imports and other imports: Q2 FY26 1,643 (669/527/447), Q3 FY26 1,555, Q4 FY26 1,457, Q1 FY27 1,427 and Q2 FY27 estimate 1,735 (735/556/444). Total demand is expected to reach 1,735 kt in Q2 FY27, up 6% YoY, led by auto and electricals.
Stacked bar chart with legend to the right; italic title and welding-robot photo on the left; summary sentence below the chart.
Indian copper market (kilo tons) by domestic refined, scrap and imported refined: 398 in Q2 FY26 (157/161/80), 380, 383, 359 in Q1 FY27 and 388 in Q2 FY27 (146/183/59). The market was down 3% YoY; B&C and power demand grew but consumer durables and electrical equipment were weaker. Key macro drivers versus Q2 FY26: sulphuric acid price up, TC/RC down.
Stacked bar chart centre, legend and 'Key Macro Drivers' arrow panel to the right, summary text below; title and copper-wire photo on the left.
Section break introducing the quarterly financial snapshots.
Translucent colour bands over a photo of aluminium ingots in a green rack inside a casthouse; title in a rounded box at lower left.
All businesses consolidated (₹ crore): revenue 91,708 (+39% from 66,058), business segment EBITDA 13,869 (+52% from 9,104), PAT 7,533 (+59% from 4,741; includes a ₹(106) crore AV Minerals impact). Hindalco (India): revenue 36,123 (+42% from 25,494), EBITDA 9,011 (+66% from 5,419), PAT 5,852 (+91% from 3,060), aided by the move to the new tax regime from 1 April 2026 (effective tax rate 25% vs 29%). Novelis (₹ crore): revenue 55,585 (+37% from 40,564), EBITDA 4,858 (+32% from 3,685; 20% in USD terms, helped by INR/USD moves), PAT 1,787 (+7% from 1,671).
Consolidated KPI strip on the left connected by bracket lines to two KPI strips on the right for Hindalco India and Novelis; prior-year values in grey rows; footnotes beneath each block; hard-hat photo lower left.
Non-LME linked EBITDA (Novelis, Aluminium Downstream and Copper) in ₹ crore: 3,930 in Q3 FY26 (-2% YoY), 5,364 in Q4 FY26 (+9%), 6,091 in Q1 FY27 (+37%) and an all-time high of 6,860 in Q2 FY27 (+50%). It rose 13% sequentially despite a 10% fall in LME prices, driven by Novelis recovery, operational excellence at Copper and product innovation in Aluminium Downstream.
Combo chart (bars for EBITDA, line for YoY growth) in the centre with 'All-time high' label, definition and drivers list on the right, title and worker photo on the left, takeaway sentence at the bottom.
Q2 FY27 vs Q2 FY26. Aluminium Upstream: shipments 345 kt (+1%), revenue ₹13,364 crore (+33%), EBITDA ₹7,009 crore (+55%), EBITDA US$2,125/t (+40% from 1,521). Aluminium Downstream: shipments 119 kt (+6%), revenue ₹5,511 crore (+45%), EBITDA ₹329 crore (+26%), US$289/t (+9%). Copper: shipments 116 kt (+2%), of which CCR 96 kt (flat), revenue ₹21,374 crore (+47%), EBITDA ₹1,673 crore (+164%), US$1,510/t (+136%).
Data table with UOM, Q2 FY26, Q2 FY27 and YoY columns grouped by segment on the right; three product photos (ingots, coils, copper wire) beside each group; title panel on the left.
Revenue (₹ crore): 66,058 Q2 FY26, 84,825 Q1 FY27, 91,708 Q2 FY27 (+39%, favourable macros); H1 130,290 vs 176,533. Business segment EBITDA: 9,104, 13,480, 13,869 (+52%); H1 17,643 vs 27,349. Profit before exceptional items: 6,722, 11,692, 10,310 (+53%); H1 12,398 vs 22,002. PAT: 4,741, 7,013, 7,533 (+59%, strong operations and Novelis Oswego recovery); H1 8,745 vs 14,546.
2x2 grid of bar charts (quarters then half-years separated by a divider) with short commentary beside each; title and worker photo on the left.
Net debt bridge (₹ crore): 64,841 at 31 March 2026, less net inflow from operations 10,231, plus Oswego impact net of insurance 2,015, capex 20,719 and others 3,091, giving 80,435 at 30 September 2026. Cash flow from operations ₹23,319 crore (+57% YoY); net cash inflow ₹10,231 crore (+14%) despite higher working capital from metal prices. Capex ₹20,719 crore (+83%). Net debt/EBITDA: 1.23 (Sep-25), 1.73, 1.83, 1.95, 1.80 (Sep-26). ROCE: 20%, 19%, 20%, 23%, 24%. Footnote: Oswego fire costs of ₹5,134 crore ($542 million) plus ₹143 crore ($15 million), partly offset by ₹1,451 crore ($153 million) property insurance and ₹1,811 crore ($190 million) tariff and freight recoveries.
Waterfall chart on the left with two bullet takeaways below; two line charts (net debt/EBITDA, ROCE) stacked on the right; three-line footnote across the bottom.
Section break introducing segment-wise performance.
Translucent colour bands over a photo of workers fitting an aluminium bonnet on a car body line; title in a rounded box at lower left.
US GAAP figures. Total shipments 919 kt in Q2 FY27 vs 941 in Q2 FY26 (-2%) and 916 in Q1; H1 1,835 vs 1,904; higher beverage packaging and aerospace offset by lower automotive and specialty. Adjusted EBITDA US$508 million vs 422 (+20%), including US$39 million of Oswego insurance recoveries, better scrap spreads and recycling; H1 1,024 vs 838. Adjusted EBITDA per ton US$553 vs 448 (+23%); H1 558 vs 440. Net income US$210 million vs 163 (+29%); H1 374 vs 259.
2x2 grid of green bar charts with commentary; left panel lists the four segments with 'Novelis' highlighted and a beverage-can photo below.
Shipments 345 kt (341 in Q2 FY26, 335 in Q1 FY27; +1% on domestic demand); H1 680 vs 666. Sales mix domestic 79% / export 21% in Q2 FY27 vs 75/25 a year ago; H1 78/22. EBITDA ₹7,009 crore vs 4,524 (+55%), margin 52% vs 45%; H1 14,399 vs 8,604. EBITDA US$2,125/t vs 1,521 (+40%) on favourable macros partly offset by input costs; Q1 FY27 2,331; H1 2,226 vs 1,495.
2x2 grid: shipments bars, domestic/export stacked percentage bars, EBITDA ₹ bars and EBITDA $/t bars, each with a note; segment navigator with 'Aluminium Upstream' highlighted and ingot photo on the left.
Shipments 119 kt vs 113 (+6%, domestic demand momentum), Q1 FY27 104; H1 223 vs 214. Product mix Q2 FY27: FRP and foils 95 kt, extrusion 24 kt (Q2 FY26: 90 and 22); extrusion +9% YoY, FRP and foils +5%. EBITDA ₹329 crore vs 261 (+26%, higher shipments and value addition); H1 627 vs 490. EBITDA US$289/t vs 265 (+9%, premiumisation and operating leverage); Q1 FY27 303; H1 296 vs 265.
2x2 grid of charts (shipments, stacked product mix, EBITDA ₹, EBITDA $/t) with notes; segment navigator with 'Aluminium Downstream' highlighted and coil photo on the left.
Metal shipments 116 kt vs 113 in Q2 FY26 and 105 in Q1 FY27 (up 10% QoQ); H1 221 vs 237. CC rod shipments 96 kt, flat QoQ (97 a year ago); H1 192 vs 201. EBITDA ₹1,673 crore vs 634 a year ago and 918 in Q1 (+82% QoQ, normalisation after the planned Q1 smelter shutdown); H1 2,591 vs 1,307. EBITDA US$1,510/t vs 641 and 926 in Q1 (+63% QoQ on higher LME and by-product realisation, including a one-time gain); H1 1,234 vs 637.
2x2 grid of copper-coloured bar charts with the current quarter in navy and commentary beside each; segment navigator with 'Copper' highlighted and copper coil photo on the left.
Section break introducing the key summary.
Colour bands over a photo of a smiling female worker in a hard hat beside large aluminium coils; title in a rounded box at lower left.
Novelis 3x30 goals by 2030: 75% average recycled content, emissions below 3 tonnes CO2e per tonne of FRP shipped, and leadership in ROIC. Guidance and updates: over US$240 million run-rate cost savings through Q2 FY27, targeting US$350-400 million by FY28 exit; Oswego hot mill production normalised with US$519 million cumulative insurance recoveries to September 2026; the 600 kt Bay Minette plant produced its first cold-rolled coil in September, with commercial shipments from Q1 FY28; long-term US$600+/ton EBITDA guidance intact, with positive free cash flow and deleveraging expected by FY27 exit.
Top half: Novelis 3x30 logo on the left, three goal headings with descriptions on the right. Bottom half: gradient 'Guidance and Updates' banner with four check-marked bullets on the left, rolling-mill photo on the right.
Strategy: 'Double Down' on upstream aluminium and copper; '4x by FY30' for downstream aluminium, copper, specialty alumina and recycling. Projects under execution (FY26-29) include Aditya smelter expansion 181 kt (FY28) and 193 kt (FY29), Chakla and Bandha coal mines 5 MTPA each (FY27) and Meenakshi 12 MTPA (FY29), Aditya refinery phase 1 850 kt (FY28), Aditya FRP phase 2A 170 kt, AC fins 26 kt and battery foils 20 kt (scaling up), smartphone casings 8 kt (FY29), copper smelter 300 kt and continuous cast rods 300 kt (FY29), copper and e-waste recycling 50 kt (FY27), Inner Grove tubes 25 kt, precipitate hydrate 20 kt and white fused alumina 90 kt (FY28). Under evaluation: Mahan 370 kt, Aditya refinery phase 2 850 kt, further FRP, copper and recycling capacity. Capacity post expansion: >2,000 ktpa upstream aluminium, >5,500 alumina, >800 downstream, >1,200 copper, >1,000 specialty alumina. Capex ~₹52,000 crore under execution and ~₹50,000 crore+ under evaluation.
Header with Hindalco++ logo and two arrow callouts; five-column table (segment, projects under execution, commissioning year, projects under evaluation, total capacity) with the capacity column outlined and a highlighted capex row at the bottom.
Closing slide for Hindalco Industries Limited (CIN L27020MH1958PLC011238) with Investor Relations contact Subir Sen, investor email and website, and the registered office at One Unity Centre, Prabhadevi, Mumbai.
Left two-thirds: vertical 'THANK YOU' text over a photo of a worker inside a coil of wire rod; right third: company name, CIN and contact panels.
Section break introducing the annexure tables.
Colour bands over a photo of an overhead crane above rows of aluminium coils in a large rolling plant; title in a rounded box at lower left.
Consolidated P&L (₹ crore) for Q2 FY26, Q1 FY27, Q2 FY27 and H1. Q2 FY27: revenue 91,708 (+39% YoY, +8% QoQ); segment EBITDA Novelis 4,858, Aluminium Upstream 7,009, Downstream 329, Copper 1,673, total 13,869 (+52%); EBITDA 13,757 (+42%, -8% QoQ); finance costs 933; PBDT 12,824; depreciation 2,524; profit before exceptional items 10,310 (+53%); exceptional income 284; PBT 10,594 (+62%); tax 3,061; PAT 7,533 (+59%, +7% QoQ); basic EPS ₹33.93. H1 FY27: revenue 176,533 (+35%), EBITDA 28,746 (+57%), exceptional items (2,015), PAT 14,546 (+66%), EPS ₹65.51. Novelis figures per US GAAP.
Full-width financial table with Q2 FY27 and H1 FY27 columns shaded blue and YoY/QoQ change columns in green or red.
India P&L (₹ crore). Q2 FY27: revenue 36,123 (+42% YoY, +17% QoQ); segment EBITDA 9,011 (+66%); EBITDA 8,765 (+70%); finance costs 30 (-81% from 157); PBDT 8,735; depreciation 914 (+34%); profit before tax 7,821 (+81%), no exceptional items; tax 1,969; PAT 5,852 (+91%, +10% QoQ). H1 FY27: revenue 67,108 (+33%), EBITDA 16,801 (+64%), PAT 11,154 (+89%) versus 5,906.
Full-width financial table with shaded current-period columns and coloured change columns.
Kt: upstream third-party sales 233 in Q2 FY27 (227 in Q2 FY26, 219 in Q1 FY27) plus intersegment sales 112 gives total upstream shipments of 345; downstream third-party sales 119; total third-party sales 352 (340 a year ago, 322 in Q1). H1 FY27: upstream third-party 452, intersegment 228, total upstream 680, downstream 223, total third-party 675 (660 in H1 FY26).
Single compact table occupying the upper half of the slide, current-period columns shaded blue.
Alumina production including Utkal (hydrate as alumina): 980 kt in Q2 FY27 vs 926 in Q2 FY26 (+6%) and 943 in Q1 FY27; H1 1,923 vs 1,884. Utkal Alumina refinery produced 670 kt in Q2 FY27, up 3%.
Bar chart centre with headline growth note to the right, Utkal statement in a grey banner below, title and alumina-pellet photo on the left.
Aluminium upstream production 338 kt in Q2 FY27 (336 in Q2 FY26, 334 in Q1), in line with last year; H1 672 vs 668. Aluminium downstream (FRP and extrusions) 126 kt vs 116 (+9%, led by FRP); H1 240 vs 221. Copper cathode 99 kt vs 107 (-8%); Q1 83; H1 182 vs 209. Copper rods (including fixed-term contract volumes) 104 kt vs 122 (-15%); H1 211 vs 255. Footnote: prior quarters restated for comparability.
2x2 grid of bar charts (two blue for aluminium, two orange for copper) with growth notes; title and coil photo on the left; footnotes along the bottom.
The earnings conference call was scheduled for 4:30 PM IST on 6 November 2026. Table of dial-in numbers for India (primary and secondary) and international toll-free numbers for the USA, UK, Singapore and Hong Kong, plus links for online pre-registration, the investor presentation and the post-call recording on Hindalco's Reports and Presentations page.
Title and one-line schedule at the top, two-column access table below with blue header row and hyperlinked cells.
أسئلة شائعة حول هذه الشريحة ومحتوى العرض التقديمي الأساسي.
Hindalco's fiscal year runs April to March, so FY27 covers April 2026 to March 2027 and Q2 FY27 is July to September 2026. The deck is dated 6 November 2026 and also shows H1 FY27 (April to September 2026) figures.
Hindalco Industries filed the presentation with the Indian stock exchanges (BSE and NSE) alongside its quarterly results. The original PDF is available on BSE's corporate filings site; this version omits the exchange cover letter.
Consolidated revenue was ₹91,708 crore (+39% YoY), business segment EBITDA ₹13,869 crore (+52%) and PAT ₹7,533 crore (+59%). The Indian business earned PAT of ₹5,852 crore (+91%), helped by a lower effective tax rate under the new tax regime.
Novelis, Hindalco's US subsidiary, reports under US GAAP in US dollars, so its shipments, adjusted EBITDA (US$508 million) and net income (US$210 million) appear in US$. EBITDA per tonne figures for the Indian segments are also stated in US$/ton, while P&L amounts for the group and India business are in ₹ crore.
It is EBITDA from Novelis, Aluminium Downstream and Copper, businesses whose earnings have low correlation with LME aluminium prices. It reached an all-time high of ₹6,860 crore in Q2 FY27, up 50% YoY and 13% QoQ despite a roughly 10% fall in LME prices.
The Hindalco++ table lists about ₹52,000 crore of projects under execution (Aditya smelter and refinery expansions, coal mines, FRP, a 300 kt copper smelter, rods, recycling and specialty alumina) and about ₹50,000 crore+ under evaluation, with a goal to grow downstream businesses 4x by FY30.
The net debt bridge shows a ₹2,015 crore Oswego impact net of insurance recoveries in H1 FY27. Novelis says the Oswego hot mill has normalised production and it had received US$519 million in cumulative insurance recoveries by September 2026.
Investors and analysts following Indian metals and Aditya Birla Group companies, IR teams designing earnings decks for multi-segment industrial businesses, and ESG analysts looking for safety, water, waste and renewable energy KPIs from a large aluminium and copper producer.
Original exchange filing of the presentation, including the cover letter to the exchanges.

Create Your Own Slides
Turn your ideas into professional presentations in seconds with 2slides AI.
راجع التصاميم الاحترافية، اختر أسلوبك، وأنشئ شرائح بعرض نصي مثالي. مدعوم بـ Nano Banana—ابدأ في إنشاء عرضك التقديمي الآن.
وكيل الذكاء الاصطناعي الخاص بك للشرائح. وفر الوقت، أشرق بشكل أسرع مع إنشاء عروض تقديمية ذكية.


© 2026 2slides. جميع الحقوق محفوظة.