
ضمن مجموعة أمثلة عروض المستثمرين
Delta Electronics, Inc. 3Q 2026 Results (Q3 2026 earnings presentation), the investor conference deck dated 29 October 2026 and filed on Taiwan's Market Observation Post System (MOPS) for the company's 法人說明會 (investor conference). Delta Electronics (台達電) makes power electronics and power and thermal management products for data centres and EV systems. Amounts are in New Taiwan dollars (NT$) and quarters are calendar quarters.
يستخدم غلاف هذا العرض مرجعًا للنمط لإنشاء شرائح من محتواك الخاص. أو اختر أي صفحة أدناه لاستخدام تخطيطها مرجعًا.
التنقل السريع
العلامات
مشاركة الشرائح
Delta Electronics, Inc. 3Q 2026 Results (Q3 2026 earnings presentation), the investor conference deck dated 29 October 2026 and filed on Taiwan's Market Observation Post System (MOPS) for the company's 法人說明會 (investor conference). Delta Electronics (台達電) makes power electronics and power and thermal management products for data centres and EV systems. Amounts are in New Taiwan dollars (NT$) and quarters are calendar quarters.
عرض تفصيلي لكل صفحة شريحة، بما في ذلك التخطيط والمحتوى الرئيسي والعناصر المرئية.
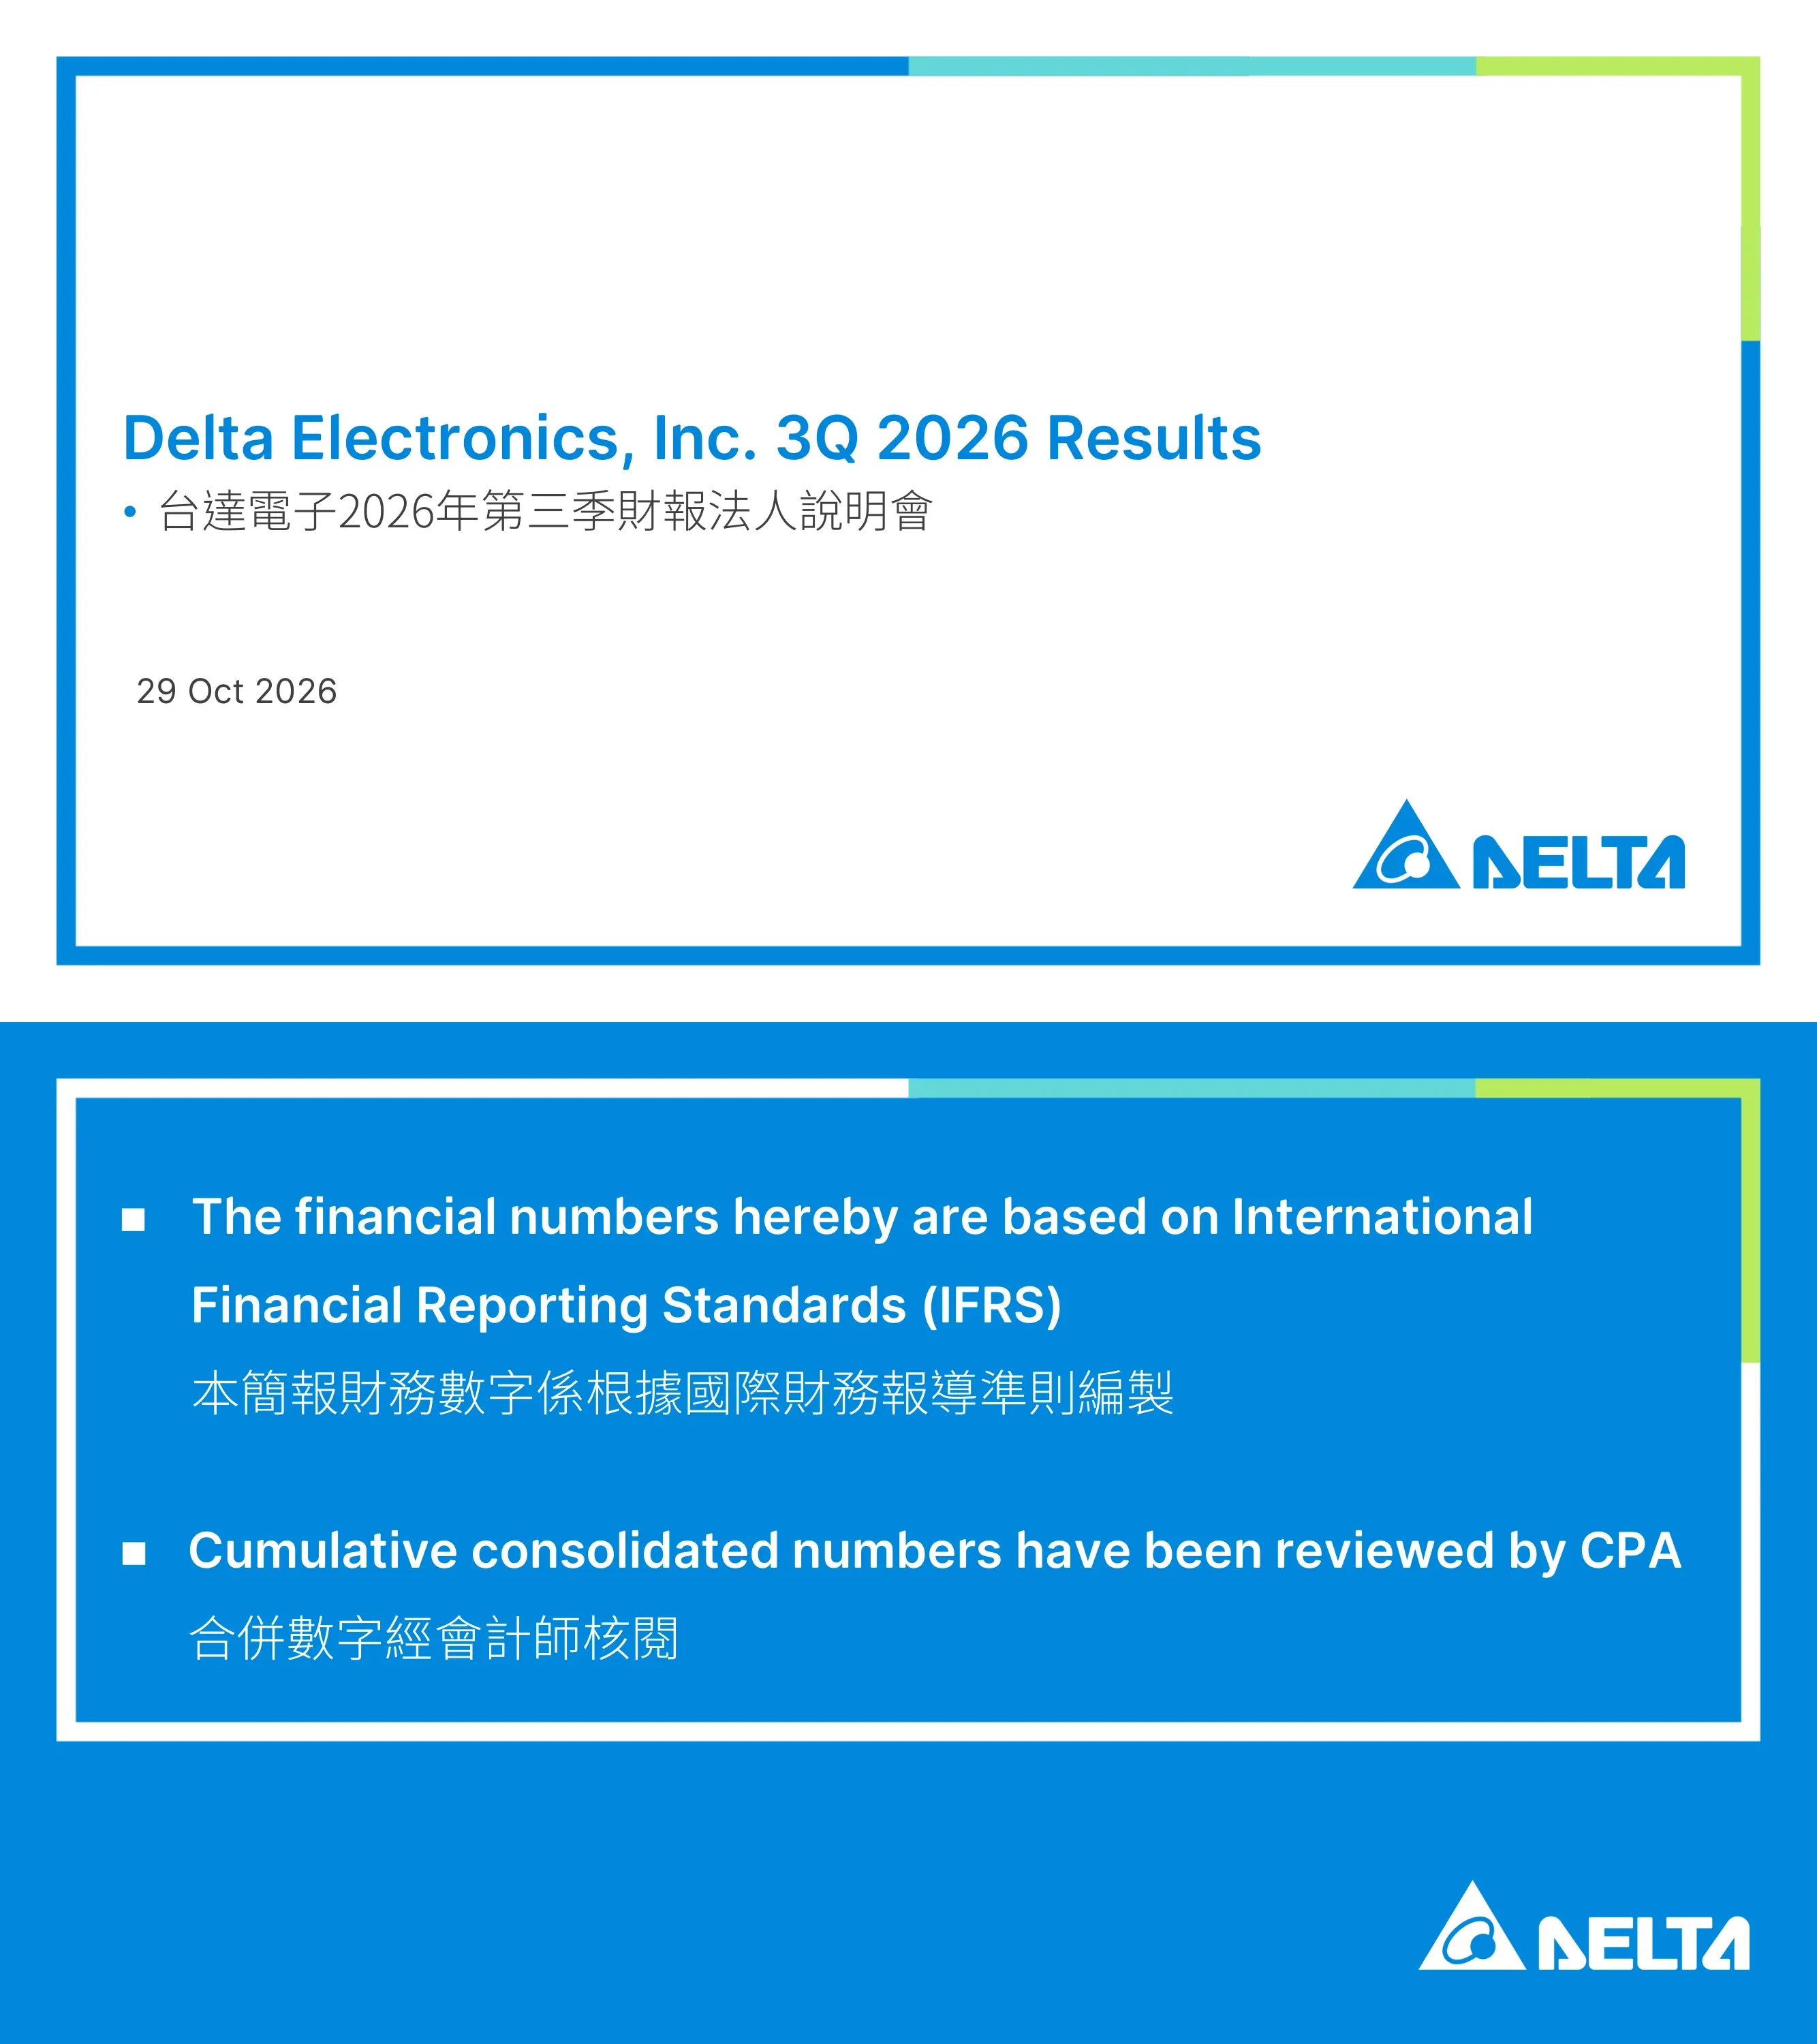
Title slide reading 'Delta Electronics, Inc. 3Q 2026 Results' with the Chinese subtitle 台達電子2026年第三季財報法人說明會 (Delta Electronics 2026 third-quarter financial results investor conference) and the date 29 Oct 2026. The Delta logo is at bottom right.
White slide with a thick blue border that turns teal and lime along the top right corner; left-aligned title and subtitle in the middle, date below, logo bottom right.
Two bullet statements, each with a Chinese translation: the financial numbers are based on International Financial Reporting Standards (IFRS), and the cumulative consolidated numbers have been reviewed by CPA (certified public accountants).
Solid blue slide with a white-bordered text panel holding two square-bullet statements in white; logo bottom right.
Section divider introducing the third-quarter results, titled '3Q 2026 Financial Results' with the Chinese subtitle 2026年第三季結算數字.
Mostly empty white slide with a centred blue title and grey Chinese subtitle; footer 'Delta Confidential', page number and logo.
Five-quarter bar charts in NT$ billion. Sales: 3Q25 150.3, 4Q25 161.6, 1Q26 159.4, 2Q26 183.2, 3Q26 197.1. Gross profit: 52.4, 55.9, 58.9, 65.3, 67.2, with gross profit margin (GPM) of 34.9%, 34.6%, 37.0%, 35.6% and 34.1%. Change table: sales +31% Y/Y and +8% Q/Q; gross profit +28% Y/Y and +3% Q/Q.
Two stacked bar charts on the left (blue for sales, teal for gross profit with a green GPM line), each with a data strip underneath; yellow-header Y/Y and Q/Q table on the right.
Stacked columns in NT$ billion for 3Q25 to 3Q26. R&D: 12.8, 13.1, 13.7, 15.7, 16.4. SG&A: 14.8, 16.4, 16.8, 19.0, 18.2. Operating profit (OP): 24.8, 26.4, 28.4, 30.6, 32.6. Percent of sales for 3Q26: R&D 8.3%, SG&A 9.2%, OPEX 17.5%, operating margin (OPM) 16.6%. Y/Y and Q/Q: R&D +28% and +4%; SG&A +23% and -4%; OPEX +25% and -1%; OP +31% and +7%.
Stacked bar chart with a legend on the left, a ratio table below it, and a four-row yellow change table on the right; negative changes in red.
Segment table in NT$ million (sales, Y/Y, Q/Q, profits, Y/Y, Q/Q). Power Electronics: sales 105,930 (+40% Y/Y, +10% Q/Q), profits 19,920 (+22%, -1%). Mobility: 9,071 (+7%, +10%), profits (137) loss. Automation: 15,900 (+19%, +2%), profits 769, marked 'n.m. (turned to profit)'. Infrastructure: 65,880 (+25%, +5%), profits 12,068 (+40%, +7%). A stacked sales-mix chart for 3Q25, 2Q26 and 3Q26 shows Power Electronics at 50%, 53% and 54%, and Infrastructure at 35%, 34% and 33%.
Wide yellow-header table on the left with bilingual row labels; rounded panel on the right with a stacked column chart and legend (Others, Infrastructure, Automation, Mobility, Power Electronics).
Non-operating profit in NT$ billion: 3Q25 2.2, 4Q25 (0.8), 1Q26 2.7, 2Q26 4.4, 3Q26 1.1, equal to 1.4%, -0.5%, 1.7%, 2.4% and 0.5% of sales. Table in NT$ million for 3Q25, 2Q26, 3Q26: investment gains 876, 1,880, 265; interest income 321, 398, 317; FX income and valuation of FX forwards 374, 735, 609; others 604, 1,416, (145); total 2,175, 4,429, 1,046. A footnote explains the investment gains item, in Chinese and English.
Bar chart with a line and data strip on the left, footnote text below it, and a yellow-header table on the right.
Profit before tax (PBT) in NT$ billion: 27.0, 25.6, 31.1, 35.0, 33.7 for 3Q25 to 3Q26, or 18.0%, 15.9%, 19.5%, 19.1% and 17.1% of sales. EBITDA: 35.4, 32.7, 39.4, 44.0, 43.7, or 23.5%, 20.2%, 24.7%, 24.0% and 22.2% of sales. Changes: PBT +25% Y/Y and -4% Q/Q; EBITDA +24% Y/Y and -1% Q/Q.
Two stacked bar charts with percent-of-sales lines and data strips on the left; yellow change table on the right.
Net profit after tax in NT$ billion: 18.6, 17.3, 20.6, 25.1, 23.5 for 3Q25 to 3Q26, or 12.4%, 10.7%, 12.9%, 13.7% and 11.9% of sales. Change: +26% Y/Y and -7% Q/Q. Bridge table in NT$ million for 3Q25, 2Q26, 3Q26: profit before income tax 26,983, 35,000, 33,667; income tax (6,061), (7,831), (7,608); non-controlling interest (2,316), (2,033), (2,564); net profit after tax 18,606, 25,136, 23,495.
Bar chart with data strip top left, teal-header change table below it, and a yellow-header bridge table on the right.
Earnings per share in NT$: 3Q25 7.16, 4Q25 6.67, 1Q26 7.92, 2Q26 9.68, 3Q26 9.04. Footnote: EPS is based on shares outstanding of 2,598 million (in Chinese, 25.98億股).
Single full-width column chart with values inside the bars and the footnote beneath.
Section divider introducing the year-to-date (first nine months) results: 'YT3Q 2026 Financial Results' with the Chinese subtitle 2026年前三季結算數字.
Mostly empty white slide with a centred blue title and grey Chinese subtitle; standard footer.
Year-to-date comparison in NT$ billion. Sales: YT3Q25 393.3, YT3Q26 539.7 (+37% Y/Y). Gross profit: 134.3 and 191.4 (+43% Y/Y), with gross margin of 34.1% and 35.5%.
Two stacked two-bar charts with data strips on the left; yellow Y/Y table on the right.
Stacked columns in NT$ billion, YT3Q25 versus YT3Q26: R&D 35.7 and 45.8; SG&A 41.1 and 54.0; OP 57.5 and 91.6. Percent of sales: R&D 9.1% and 8.5%; SG&A 10.4% and 10.0%; OPEX 19.5% and 18.5%; OPM 14.6% and 17.0%. Y/Y: R&D +28%, SG&A +32%, OPEX +30%, OP +59%.
Two stacked columns with a legend and ratio table on the left, four-row yellow Y/Y table on the right.
Segment table in NT$ million for YT3Q26 (sales, Y/Y, profits, Y/Y). Power Electronics: 287,848 (+44%), profits 58,928 (+48%). Mobility: 25,080 (-16%), profits (1,267) (-200%). Automation: 45,791 (+13%), profits 435 (-20%). Infrastructure: 180,154 (+47%), profits 33,512 (+92%). Sales mix chart: Power Electronics 51% in YT3Q25 and 53% in YT3Q26; Infrastructure 31% and 33%.
Yellow-header table on the left and a rounded panel with a two-column stacked mix chart on the right.
Non-operating profit of NT$4.7 billion in YT3Q25 (1.2% of sales) and NT$8.2 billion in YT3Q26 (1.5% of sales). Table in NT$ million, YT3Q25 and YT3Q26: investment gains 306 and 2,104; interest income 1,146 and 1,143; FX income and valuation of FX forwards 706 and 1,708; others 2,546 and 3,196; total 4,704 and 8,151. Bilingual footnote on the investment gains item.
Small bar chart with data strip and footnote on the left, yellow-header breakdown table on the right.
Profit before tax in NT$ billion: YT3Q25 62.2 (15.8% of sales), YT3Q26 99.8 (18.5%), +60% Y/Y. EBITDA: 85.2 (21.7% of sales) and 127.2 (23.6%), +49% Y/Y.
Two stacked two-bar charts with data strips on the left; yellow Y/Y table on the right.
Net profit after tax of NT$42.8 billion in YT3Q25 (10.9% of sales) and NT$69.2 billion in YT3Q26 (12.8%), +62% Y/Y. Bridge in NT$ million, YT3Q25 and YT3Q26: profit before income tax 62,217 and 99,759; income tax (13,918) and (22,697); non-controlling interest (5,514) and (7,876); net profit after tax 42,785 and 69,186.
Bar chart with data strip and a Y/Y box on the left, bridge table on the right.
Year-to-date EPS in NT$: YT3Q25 16.47 and YT3Q26 26.64, up 62% (orange arrow annotation). Footnote: EPS based on shares outstanding of 2,598 million.
Two large blue columns with an orange growth arrow and +62% label between them; footnote beneath.
Four business categories, each with an icon and a bullet list. Power Electronics: Components; Power & Systems; Fans & Thermal Management. Mobility: EV Powertrain Systems. Automation: Industrial Automation; Building Automation. Infrastructure: ICT Infrastructure; Energy Infrastructure; Display Solutions.
Four equal vertical columns over blurred dark photographs (an AI chip, an EV chassis, a factory floor, a server room), each with a circular white line icon, a heading and a bullet list.
Closing slide with Delta's tagline 'Smarter. Greener. Together.' and the Delta logo.
White slide with the blue, teal and lime frame, large tagline top left, logo bottom right.
أسئلة شائعة حول هذه الشريحة ومحتوى العرض التقديمي الأساسي.
It covers Delta Electronics' third-quarter 2026 results (3Q26) and the first nine months of 2026 (YT3Q26). Each period has slides for sales and gross profit, operating profit and expenses, performance by segment, non-operating profits, profit before tax and EBITDA, net profit after tax and EPS. It ends with a slide on Delta's four business categories.
Sales were NT$197.1 billion in 3Q26 (+31% Y/Y, +8% Q/Q) and gross profit was NT$67.2 billion with a 34.1% gross margin. Operating profit was NT$32.6 billion (16.6% of sales), net profit after tax was NT$23.5 billion (+26% Y/Y), and EPS was NT$9.04. For the first nine months, sales were NT$539.7 billion (+37% Y/Y) and EPS was NT$26.64 (+62% Y/Y). NT$ means New Taiwan dollars.
The deck uses calendar quarters: 3Q26 is the third quarter of 2026, 2Q26 the second quarter and 3Q25 the same quarter a year earlier. YT3Q26 means year to date through the third quarter, that is the first nine months of 2026, compared with YT3Q25. Y/Y is year over year and Q/Q is quarter over quarter.
It is the English version of the slides Delta Electronics (台達電) filed on Taiwan's Market Observation Post System (MOPS, 公開資訊觀測站) for its self-hosted investor conference (法說會) on 29 October 2026. Every TWSE-listed company files its investor conference materials there. A Chinese version is filed as well, and the English slides also carry Chinese subtitles.
Four: Power Electronics (components, power and systems, fans and thermal management), Mobility (EV powertrain systems), Automation (industrial and building automation) and Infrastructure (ICT infrastructure, energy infrastructure and display solutions). In 3Q26, Power Electronics had sales of NT$105,930 million and Infrastructure NT$65,880 million. Power Electronics was 54% of sales and Infrastructure 33%.
Page 2 states that the financial numbers are based on International Financial Reporting Standards (IFRS) and that the cumulative consolidated numbers have been reviewed by CPA (certified public accountants). EPS is based on 2,598 million shares outstanding.
The deck is available as a 20-page PDF with page images and as an editable PPTX. You can use it as a layout reference for your own results presentation, for example the bar chart, data strip and Y/Y and Q/Q table pattern. The Delta logo, trademarks and all figures belong to Delta Electronics and should not be reused as your own.
No. Delta makes power electronics and power and thermal management products, including solutions for data centres and EV systems. Its results deck groups the business into Power Electronics, Mobility, Automation and Infrastructure.

Create Your Own Slides
Turn your ideas into professional presentations in seconds with 2slides AI.
راجع التصاميم الاحترافية، اختر أسلوبك، وأنشئ شرائح بعرض نصي مثالي. مدعوم بـ Nano Banana—ابدأ في إنشاء عرضك التقديمي الآن.
وكيل الذكاء الاصطناعي الخاص بك للشرائح. وفر الوقت، أشرق بشكل أسرع مع إنشاء عروض تقديمية ذكية.


© 2026 2slides. جميع الحقوق محفوظة.