
Applied Materials Q3 Fiscal 2026 Earnings Presentation
التنقل السريع
العلامات
مشاركة الشرائح
Applied Materials Q3 Fiscal 2026 Earnings Presentation
عرض تفصيلي لكل صفحة شريحة، بما في ذلك التخطيط والمحتوى الرئيسي والعناصر المرئية.
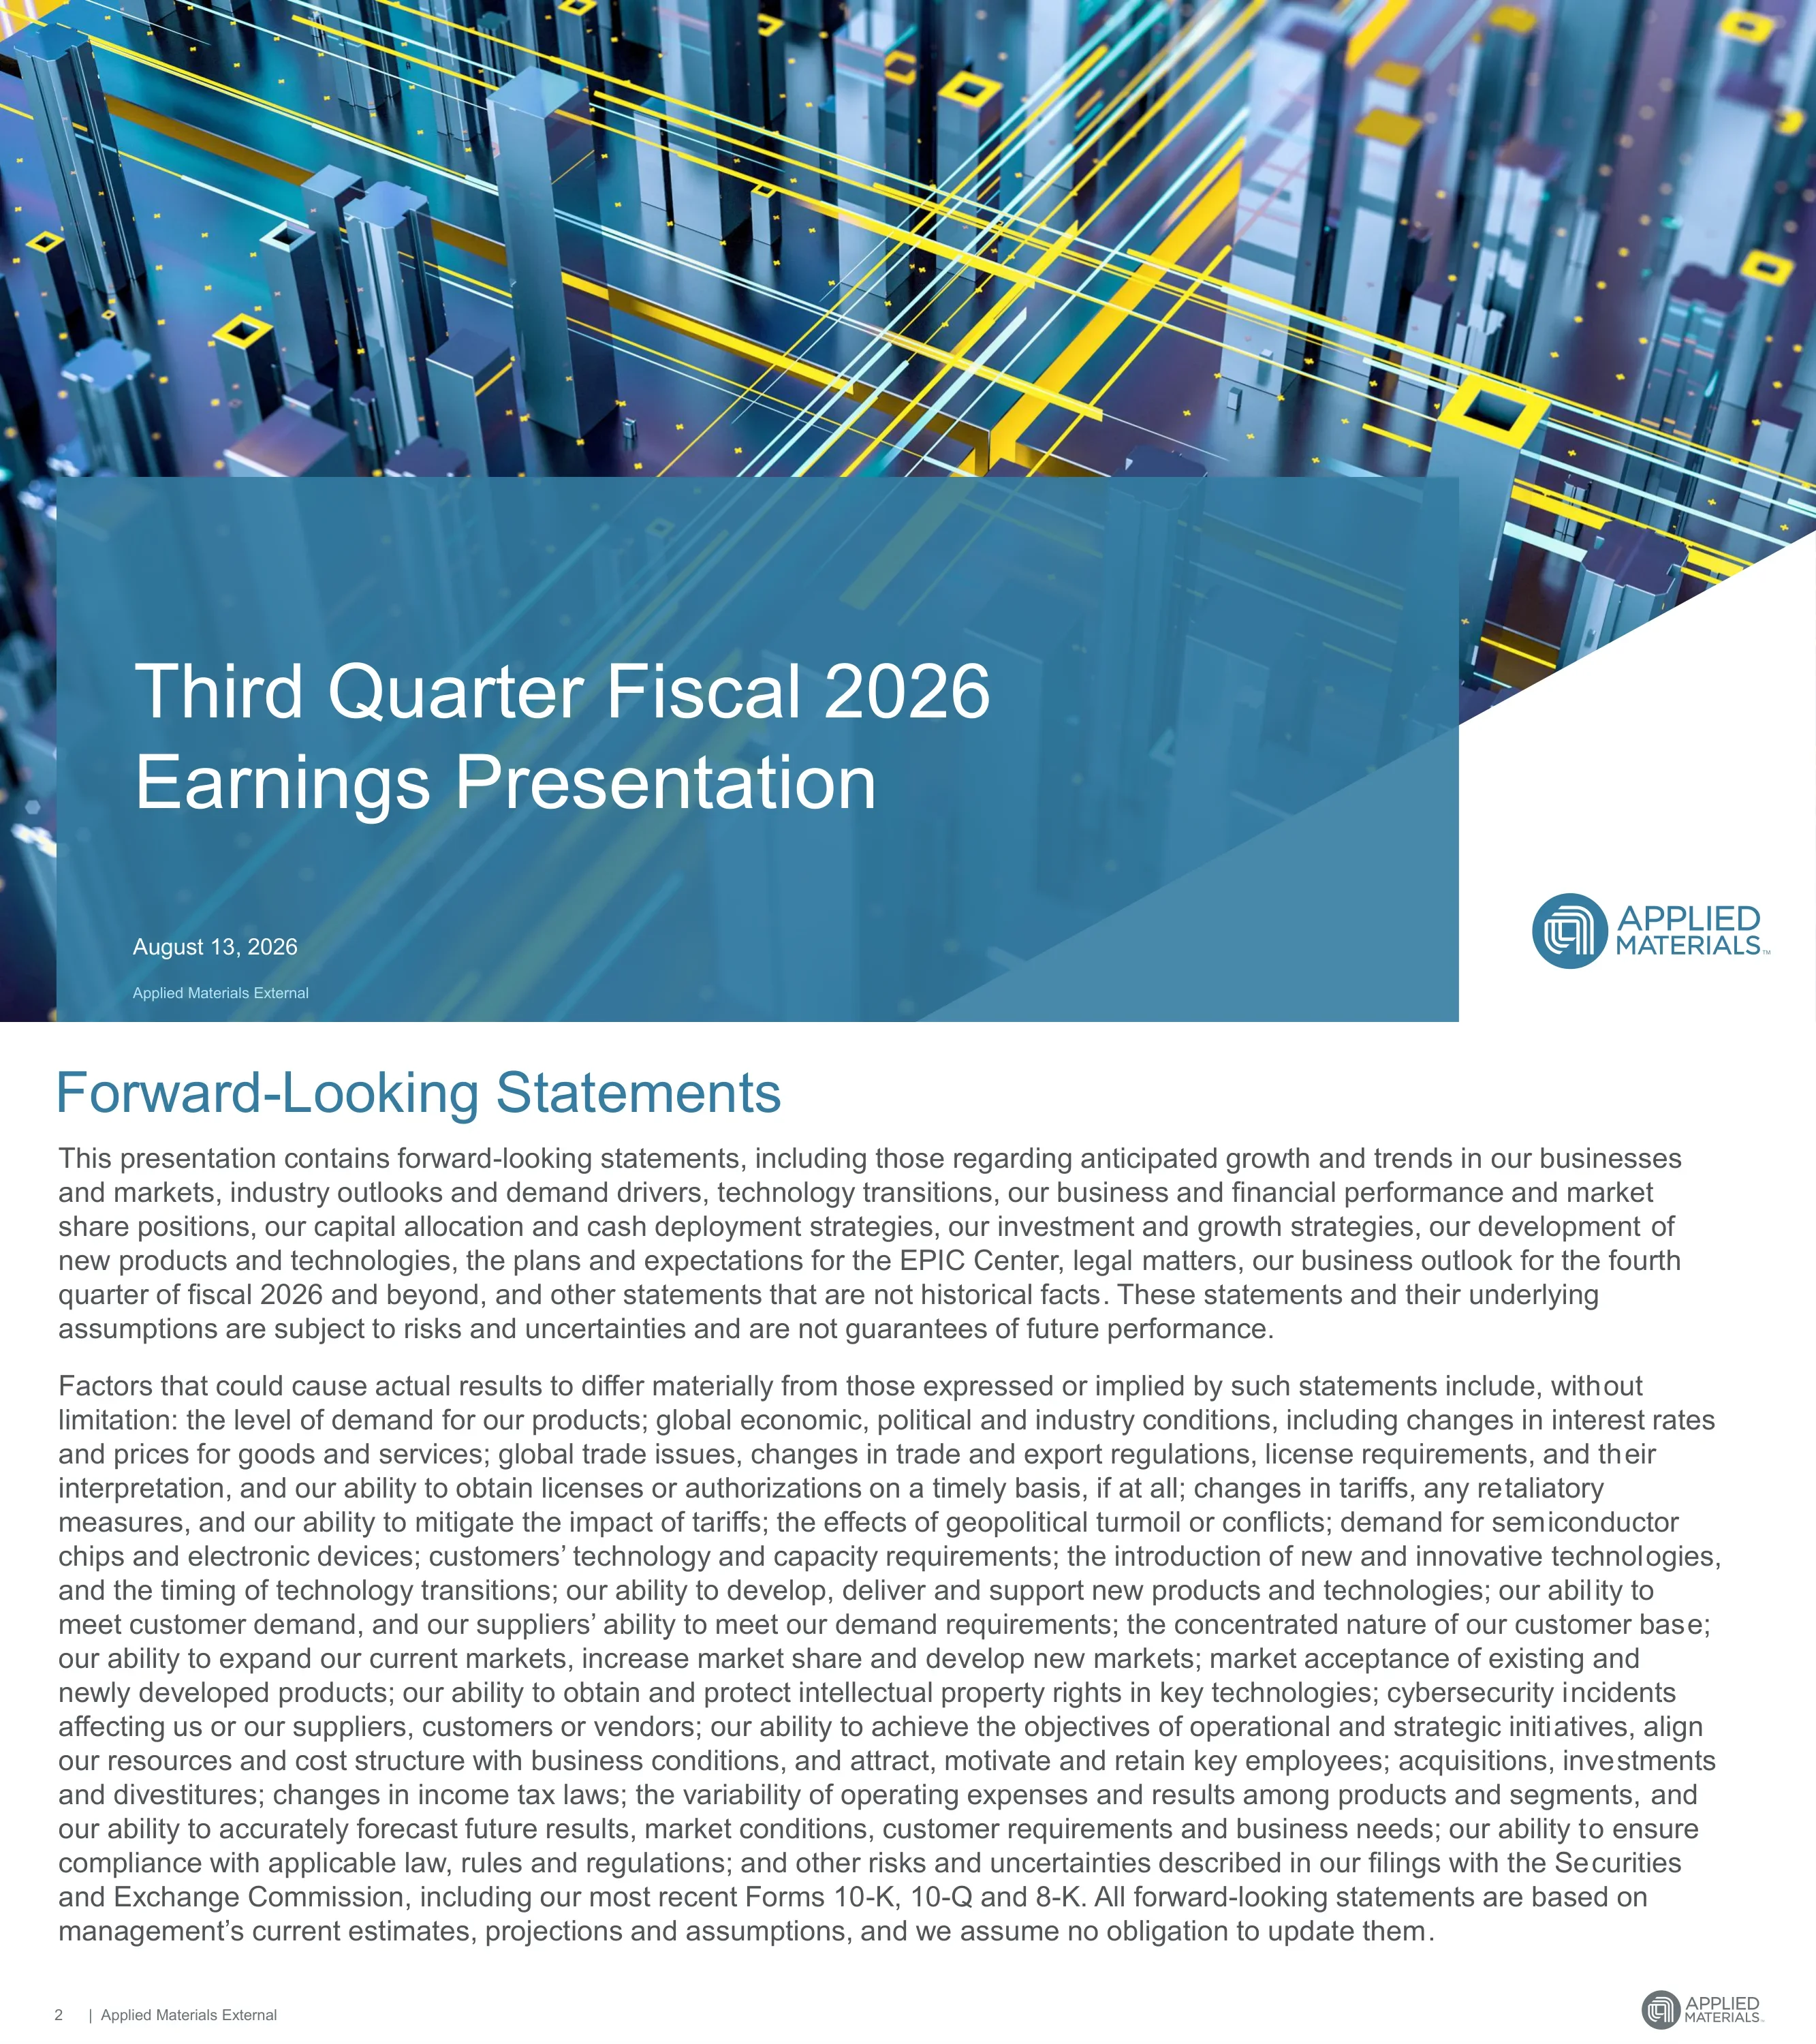
Cover slide for Applied Materials' Q3 fiscal 2026 earnings presentation, dated August 13, 2026 and marked 'Applied Materials External'.
Full-bleed 3D render of a futuristic circuit 'city' of steel-blue pillars crossed by glowing yellow and cyan lines; a large translucent steel-blue panel in the lower two-thirds holds the white title and date; a white diagonal corner at lower right carries the circular Applied Materials logo.
Legal safe-harbor text covering forward-looking statements about growth, the EPIC Center, Q4 fiscal 2026 outlook and more, with risk factors such as trade and export regulations, tariffs, geopolitical conflict, customer concentration and cybersecurity, plus references to Forms 10-K, 10-Q and 8-K.
White background, steel-blue slide title at top left, two dense full-width paragraphs in gray sans-serif, standard footer with page number, 'Applied Materials External' and small logo.
Upcoming events: EPIC Center unveiling on October 12 (Sunnyvale, CA), an Investor Breakfast Presentation on October 13 (San Francisco, CA and webcast), and the projected Q4 2026 earnings call webcast on November 12.
Dark teal photo background of a spiral desk calendar on the right; left column lists three events, each with the date in golden-yellow caps above a white event name and location.
Speaker divider opening the CEO section, introducing Gary Dickerson, President and CEO.
Reuses the cover's circuit-city image and translucent blue panel; speaker name and title in white on the left, square headshot on the right, logo in the white lower-right corner.
FQ3 was a record-breaking quarter with the highest QoQ revenue growth in company history; the CY26 Semi Systems revenue outlook was raised again and is expected to outgrow the market, AGS is growing >20% in CY26, and increased visibility supports another strong growth year in CY27. Footnote: CY26 refers to FQ2'26-FQ1'27, and FQ1'27 will be a 14-week quarter.
Faceted steel-blue background; oversized white 'CEO' and 'PERSPECTIVE' lettering on the left above yellow and navy diagonal ribbons; large white card on the right with four square-bullet points and two '»' sub-bullets.
A case study on how Applied uses AI internally: in R&D and services to create differentiated products, speed up development and build new service solutions; in operations to ramp faster, improve productivity and grow revenue faster than headcount. Tagline: AI investments accelerating revenue growth and operating profit margins.
White slide with blue title and a 'CASE STUDY' subtitle; two stacked horizontal bands, each with a photo on the left (cleanroom engineers; red autonomous robots) captioned by a dark label bar, and three bullets on a light-gray gradient on the right; bold blue takeaway line at the bottom.
Race 1, technology leadership: AI datacenter returns depend on tokens per second and energy use, and tokens-per-second-per-watt gains come from semiconductor and systems innovation. Race 2, capacity: demand for advanced chips far exceeds supply, and chipmakers are optimizing existing fabs while ramping new ones. Both races create opportunities for Applied.
Two-column comparison around a central infographic of two large curved arrows (blue on the left, burnt orange on the right) rising to meet at a shared peak; blue heading and bullets on the left, orange on the right; gray banner at the bottom with a bold blue conclusion.
Three pillars: leading-edge foundry/logic (new Centris Spectral SiN ALD), DRAM (enhanced Centura Prime epitaxy; Producer Avila 2 for higher-layer-count HBM) and advanced packaging (revenue expected to grow >70% in CY26; new Nokota VMax 2 plating, Opta Quad CMP and two eBeam systems). These segments drive ~80% of WFE growth.
Glowing blue circuit-board chip photo across the top; three equal white cards with blue header bars and bulleted text; gold 'NEW' seal badges beside the product launches; product names underlined as hyperlinks; bold white takeaway on a blue band at the bottom.
Advanced services: >37,000 chambers connected to AIx software, with AGS expected to grow >20% in CY26 and a mid-teens long-term CAGR. Process diagnostics and control: #1 in eBeam and expected to grow >50% in CY26. Output innovation products raise wafers per square foot, for example a new epitaxy system that uses 20% less cleanroom space.
Mirrors page 8 in burnt orange: a cleanroom fab photo fading into an orange gradient, three white cards with orange header bars, orange headline and bullet markers, and a bold white takeaway about output, yield and new-fab ramps at the bottom.
EPIC Center partners: founding partners Micron, Samsung, SK hynix and TSMC; innovation partners Advantest, Broadcom and SCREEN; research partners ASU, RPI, Stanford and UC Berkeley. That makes 11 announced EPIC engagements, with operations beginning in the fall.
Aerial architectural rendering of the EPIC Center building in the top half with a white 'EPIC CENTER' logotype; a blue band with widely letter-spaced white caps; light-blue lower panel split into three columns of white rounded name tiles separated by vertical dividers; blue summary line.
Recap: demand for advanced semiconductors and equipment keeps strengthening, the CY26 Semi Systems outlook is raised, and the company is on track for growth and margin expansion in 2027 and beyond. Leading-edge foundry-logic, DRAM and advanced packaging have the greatest impact on AI computing, and eight new products were introduced this quarter. Applied is helping customers increase output and yield in the race for capacity.
Same template as page 5: large white 'CEO SUMMARY' lettering and yellow/navy ribbon on the left, a wide white card on the right with three main bullets and '»' sub-bullets.
Speaker divider opening the CFO section, introducing Brice Hill, SVP and Chief Financial Officer.
Identical to page 4: circuit-city background, translucent blue panel with white name and title, square headshot on the right, logo in the lower-right white corner.
Demand: cloud providers are earning positive returns on AI infrastructure, fab utilization is rising, customers announced more than 10 new fab projects, and ICAPS demand is strong in power and optical chips. Scaling: manufacturing space has nearly doubled, quarterly system manufacturing capacity will double by 2028, the next expansion is being planned for 2030, and more than 1,500 people were added in manufacturing and AGS support this quarter.
Two stacked horizontal rows on a faceted blue background; each row has a navy tab with a clipped corner and bold white right-aligned heading, a vertical golden-yellow divider bar, and a white bullet panel.
R&D has increased every year since 2012, and investment covers better chips (materials engineering), better systems (advanced packaging R&D plus two recent acquisitions), better fab returns, and the EPIC Center. Value-based pricing is driving gross margin expansion to >50% for Applied and >55% for Semi Systems, with higher pricing on both new and existing products.
Navy diagonal parallelogram on the left carrying the white bold title, with a yellow ribbon below; large white card on the right with three square bullets and five '»' sub-bullets.
FQ3'26 compared with FQ3'25 and FQ2'26: revenue $9,115M (+25% YoY, +15% QoQ), gross margin 50.4% (+150bps / +40bps), opex $1,501M, operating income $3,096M (+38% / +22%), operating margin 34.0% (+330bps / +190bps), EPS $3.50 (+41% / +22%). Highlights: 13th consecutive quarter of YoY gross margin expansion; opex as a percentage of revenue at its lowest in nearly four years; G&A as a percentage of opex at a company low.
Six-row financial table: row labels on the left, two gray prior-period columns, a green-headed FQ3'26 column with light-green cells, and two blue-headed YoY/QoQ columns with light-blue cells; light-gray side panel on the right with 'Year-over-year highlights' bullets; reconciliation footnote.
Semiconductor Systems revenue over five quarters: $5,564M, $4,879M, $5,141M, $5,965M, $7,040M, with non-GAAP operating margin going 33%, 30%, 33%, 35%, 38%. Applied Global Services revenue: $1,463M, $1,506M, $1,559M, $1,665M, $1,781M, with margin going 27%, 29%, 28%, 29%, 30%. A note explains the recast after moving 200mm equipment into Semi Systems.
Two side-by-side gray panels, each with a white combo chart: steel-blue vertical bars with rotated white data labels for revenue, and a green line with dot markers and bold green percentage labels for operating margin; Q3F25-Q3F26 x-axis; footnotes at the bottom.
FQ3'26 operating cash flow was $3,037M and free cash flow $2,330M (FQ2'26: $845M and $210M). Shareholder distributions were $860M, made up of $440M in buybacks and $420M in dividends. The company commits to distributing 80-100% of FCF over time and had $12.8B remaining on its repurchase authorization.
Five-quarter table with gray column headers for prior quarters and a steel-blue header plus light-blue cells for FQ3'26; two sections (Cash Flows, Shareholder Distributions) with blue uppercase labels; bold blue commitment statement across the bottom.
Fourth quarter fiscal 2026 guidance: total revenue ~$10.250B ± $500M and non-GAAP EPS ~$4.02 ± $0.20; Semiconductor Systems ~$7.900B, AGS ~$1.840B, Other ~$510M; non-GAAP gross margin ~50.4%, opex ~$1.580B, tax rate ~11%.
Steel-blue left column with a large white 'Fourth QUARTER' and light-blue 'FISCAL 2026'; on the right, three grouped white tables on a gray background labeled OUTLOOK, REVENUE and OTHER in blue caps, each row listing a metric and its value.
AI adoption is driving record revenue and profitability; Applied is enabling better chips, systems and fab returns while raising pricing and margins; record performance continues into 2H CY26 with sizeable DRAM and leading-edge foundry-logic increases; unprecedented visibility supports a record CY27; and the company is investing in operations and capacity through 2030.
White chevron-shaped panel on the left with large blue 'CFO SUMMARY' lettering and a yellow diagonal stripe; white bullet card with five square bullets on a faceted blue background.
Divider slide marking the question-and-answer session of the earnings call.
Full-bleed faceted steel-blue background with a very large centered white 'Q&A' in a thin sans-serif; no other elements.
Recast vs previously reported segment data for FY24 and Q1-Q4 FY25. Examples: recast FY24 Semi Systems revenue $21,014M (previously $19,911M) with a foundry/logic/DRAM/flash mix; recast AGS FY24 revenue $5,122M (previously $6,225M); Other revenue $1,040M. The recast reflects moving 200mm equipment to Semi Systems and fully allocating corporate costs.
Dense two-panel table on a gray background: left 'RECAST' block with blue column headers, right 'PREVIOUSLY REPORTED' block with dark-gray headers; sub-sections for Semiconductor Systems, AGS and Other / Corporate and Other; explanatory footnotes below.
Two priorities: invest in R&D and infrastructure, and grow the dividend while using buybacks to return excess FCF. Over 10 fiscal years through FY25, Applied reinvested nearly $25B in R&D and >$8B in capital additions, distributed nearly 90% of FCF, grew dividend per share at a 16% CAGR and cut shares outstanding by ~32%. The quarterly dividend rose to $0.53, more than doubling in 4 years.
Gray top band with two numbered priorities joined by dotted connector lines to four '»' proof points; below, two bar charts side by side: blue bars for quarterly dividend per share FY05-FY26 with labels $0.26-$0.53 and a dotted 'doubled' callout arrow, and green bars for shares outstanding FY15-FY25 in millions; bold commitment headline at the bottom.
Total cash and investments grew to $14,501M in FQ3'26 (cash $7,037M, short-term $2,196M, long-term $5,268M), up from $11,147M a year earlier. Total debt was $6,544M (short-term $1,299M, long-term $5,245M), with ratings of P-1/A-1 for short-term and A2/A for long-term debt (Moody's/S&P).
Five-quarter table matching page 17: gray prior-quarter headers, blue FQ3'26 header with light-blue cells, darker bold total rows, and blue uppercase section labels for Cash and Investments and Debt, with credit ratings in small text under the row labels.
Sustainability slide promoting the Net Zero 2040 Playbook, with a link to the 2025 Impact Report and third-party ESG ratings: CDP Climate B, CDP Water A-, MSCI AAA, Sustainalytics Risk Rating Low, ISS (E/S/G) 1/3/1.
Full-bleed photo of green mountains with wind turbines under a blue sky; large white 'NET ZERO 2040 PLAYBOOK' logotype in the center-left; semi-transparent white ratings table on the right with a blue header and divider lines.
Links to the Investor Relations home page, the Newsroom, the 2026 DRAM and Advanced Packaging Master Class, the 2026 Logic Master Class, the 2026 SPIE Advanced Lithography + Patterning Conference and the 2025 SEMICON West Technology Breakfast.
Light-sky-blue flat-lay photo background with a laptop, coffee cup and plant at upper right; large blue title; white list card with six resource names on the left and underlined blue 'LINK' hyperlinks right-aligned.
Section divider opening the appendix of GAAP to non-GAAP reconciliations.
Faceted steel-blue background with a two-line white title anchored in the lower left; standard white footer strip.
Explains which items non-GAAP measures exclude (M&A items, restructuring, legal settlements, impairments, strategic investment gains and losses, certain tax items), why management uses them, and their limitations compared with GAAP.
White text slide with blue title and two long gray paragraphs; standard footer.
Five-quarter reconciliation of gross profit, operating income and net income. FQ3'26 GAAP gross profit of $4,586M becomes non-GAAP $4,597M (50.4%); GAAP operating income of $3,075M becomes $3,096M (34.0%); GAAP net income of $2,538M becomes $2,795M after adjustments including a $220M unrealized loss on strategic investments. Footnotes cover the $253M BIS export-controls settlement and the FQ3'25 $410M valuation allowance.
Gray background with a gray uppercase title; wide white accounting table with right-aligned numbers, single and double underlines for subtotals, bold section labels, and a narrow footnote column on the right.
EPS bridge: FQ3'26 GAAP diluted EPS of $3.17 becomes non-GAAP $3.50, driven mainly by a $0.31 unrealized loss on strategic investments; prior quarters show non-GAAP EPS of $2.48, $2.17, $2.38 and $2.86. Weighted average diluted shares were 800M in FQ3'26. A footnote notes a $0.51 impact from the FQ3'25 valuation allowance.
Same gray appendix style: white table in the upper portion with per-share adjustments by quarter, double-underlined non-GAAP EPS row, footnote below, large empty gray area underneath.
Segment reconciliations: Semiconductor Systems non-GAAP gross margin rose from 53.5% to 55.4% and operating margin reached 38.0% ($2,673M) in FQ3'26; AGS gross margin reached 35.6% and operating margin 30.1% ($536M). The $253M legal settlement is excluded from FQ1'26 Semi Systems results.
Gray appendix template with a two-line uppercase title; a full-width white table with four blocks (Semi Systems and AGS gross profit and operating income); footnotes on the left and a note on the right at the bottom.
GAAP opex of $1,511M in FQ3'26 becomes $1,501M non-GAAP after acquisition-related items and deal costs; FQ4'25 excluded a $41M goodwill impairment and $181M in restructuring, and FQ1'26 excluded the $253M legal settlement.
Gray appendix template; a compact white table across the top with five quarterly columns and parenthetical deductions; three numbered footnotes below.
Quarterly FCF equals operating cash flow minus capex: FQ3'26 $3,037M - $707M = $2,330M; earlier quarters were $2,050M, $2,043M, $1,040M and $210M.
Gray appendix template with a single three-row white table and a one-line definition footnote; most of the slide is empty gray space.
Ten years of FCF: FY2016 $2,313M, FY2017 $3,444M, FY2018 $3,165M, FY2019 $2,806M, FY2020 $3,382M, FY2021 $4,774M, FY2022 $4,612M, FY2023 $7,594M, FY2024 $7,487M, FY2025 $5,698M (FY25 capex of $2,260M).
Gray appendix template with two stacked white tables (FY2016-FY2020 and FY2021-FY2025), each with operating cash flow, capex and FCF rows, plus a definition footnote.
Q4 FY26 non-GAAP guidance excludes ~$12M in acquisition charges, includes a ~$4M normalized share-based compensation tax benefit and a ~$38M net tax benefit from intra-entity intangible asset transfers, and does not reflect items that are currently unknown.
Gray appendix template with an uppercase title and a single white text box containing one paragraph.
Closing brand slide with the Applied Materials logo and the tagline 'Material Innovation'.
Solid steel-blue full-bleed background with a centered white circular logo mark, the 'APPLIED MATERIALS' wordmark and the tagline below.
أسئلة شائعة حول هذه الشريحة ومحتوى العرض التقديمي الأساسي.
The 35-page deck, dated August 13, 2026, opens with a cover, a forward-looking statements disclaimer and an event calendar. It then has a CEO section (AI strategy, the technology and capacity 'races', new products, EPIC Center partners) and a CFO section (non-GAAP results, segment charts, cash flow, Q4 guidance). Supporting slides cover the segment recast, capital allocation, balance sheet, ESG ratings and resources, followed by a Q&A divider and an 8-page GAAP-to-non-GAAP reconciliation appendix.
Page 15 shows record revenue of $9,115M (up 25% YoY and 15% QoQ), non-GAAP gross margin of 50.4%, operating income of $3,096M, operating margin of 34.0% and non-GAAP EPS of $3.50 (up 41% YoY). Semiconductor Systems revenue was $7,040M at a 38% operating margin, and AGS revenue was $1,781M at 30%. Free cash flow was $2,330M.
Page 18 guides to total revenue of about $10.250B ± $500M and non-GAAP EPS of about $4.02 ± $0.20. That includes Semiconductor Systems at ~$7.900B, AGS at ~$1.840B and Other at ~$510M, with a non-GAAP gross margin of ~50.4%, opex of ~$1.580B and a tax rate of ~11%. This is the company's own outlook, not investment advice.
It follows a classic earnings-call flow: disclaimer, CEO strategy narrative, CFO financials, guidance, then appendix. Useful techniques include highlighting the current quarter in a colored column beside YoY/QoQ deltas, using bar-plus-line combo charts to show revenue and margin together, repeating a section-summary template for the CEO and CFO, and putting dense reconciliations in a gray appendix so the main story stays clean.
It uses a corporate steel-blue palette with golden-yellow and navy diagonal ribbons, and burnt orange for 'capacity' content. Type is a clean white and gray sans-serif, content sits on white cards over a faceted blue background, and the cover image is a 3D circuit city. Gold 'NEW' badges mark product launches, and every slide shares a footer with the page number, 'Applied Materials External' and the logo.
The deck includes a six-metric results table with YoY/QoQ columns (page 15), two bar-and-line combo charts for the segments (page 16), five-quarter cash flow and balance sheet tables (pages 17 and 23), a grouped guidance table (page 18), a dividend-per-share bar chart for FY05-FY26 and a shares-outstanding bar chart for FY15-FY25 (page 22), and an ESG ratings table (page 24). It also has a split-arrow infographic comparing the two AI races (page 7).
Yes. The gallery page offers the original PDF and an editable PPTX. The PPTX was machine-converted from the PDF, so some fonts, charts and table spacing may need small adjustments before you reuse the slides as a template. The original deck is published on the Applied Materials investor relations site.
According to pages 3, 10 and 14, the EPIC Center is Applied Materials' R&D facility for co-innovation with customers and partners. Its founding partners are Micron, Samsung, SK hynix and TSMC; innovation partners are Advantest, Broadcom and SCREEN; and research partners are ASU, RPI, Stanford and UC Berkeley. The deck lists 11 announced engagements, operations starting in the fall, and an unveiling on October 12 in Sunnyvale, CA.
Official source of the Third Quarter Fiscal 2026 Earnings Presentation (August 13, 2026) and its GAAP to non-GAAP reconciliations.

Create Your Own Slides
Turn your ideas into professional presentations in seconds with 2slides AI.
راجع التصاميم الاحترافية، اختر أسلوبك، وأنشئ شرائح بعرض نصي مثالي. مدعوم بـ Nano Banana—ابدأ في إنشاء عرضك التقديمي الآن.
Your AI Agent for slides. Save time, shine faster with intelligent presentation creation.




© 2026 2slides. All rights reserved.