
수록 모음: 투자자 발표자료 사례
Vista Energy Q3 2026 Earnings Presentation: the Third Quarter 2026 Earnings Webcast deck of the Argentine Vaca Muerta shale oil producer, dated October 29, 2026 and filed with the SEC as an exhibit to Form 6-K. All amounts are in US dollars (US$, shown in the deck as $MM).
이 프레젠테이션의 표지를 스타일 참고 자료로 사용해 내 콘텐츠로 슬라이드를 만듭니다. 아래에서 원하는 페이지를 골라 그 레이아웃을 참고로 쓸 수도 있습니다.
빠른 탐색
태그
슬라이드 공유
Vista Energy Q3 2026 Earnings Presentation: the Third Quarter 2026 Earnings Webcast deck of the Argentine Vaca Muerta shale oil producer, dated October 29, 2026 and filed with the SEC as an exhibit to Form 6-K. All amounts are in US dollars (US$, shown in the deck as $MM).
레이아웃, 주요 콘텐츠 및 시각적 요소를 포함한 각 슬라이드 페이지의 상세 보기.
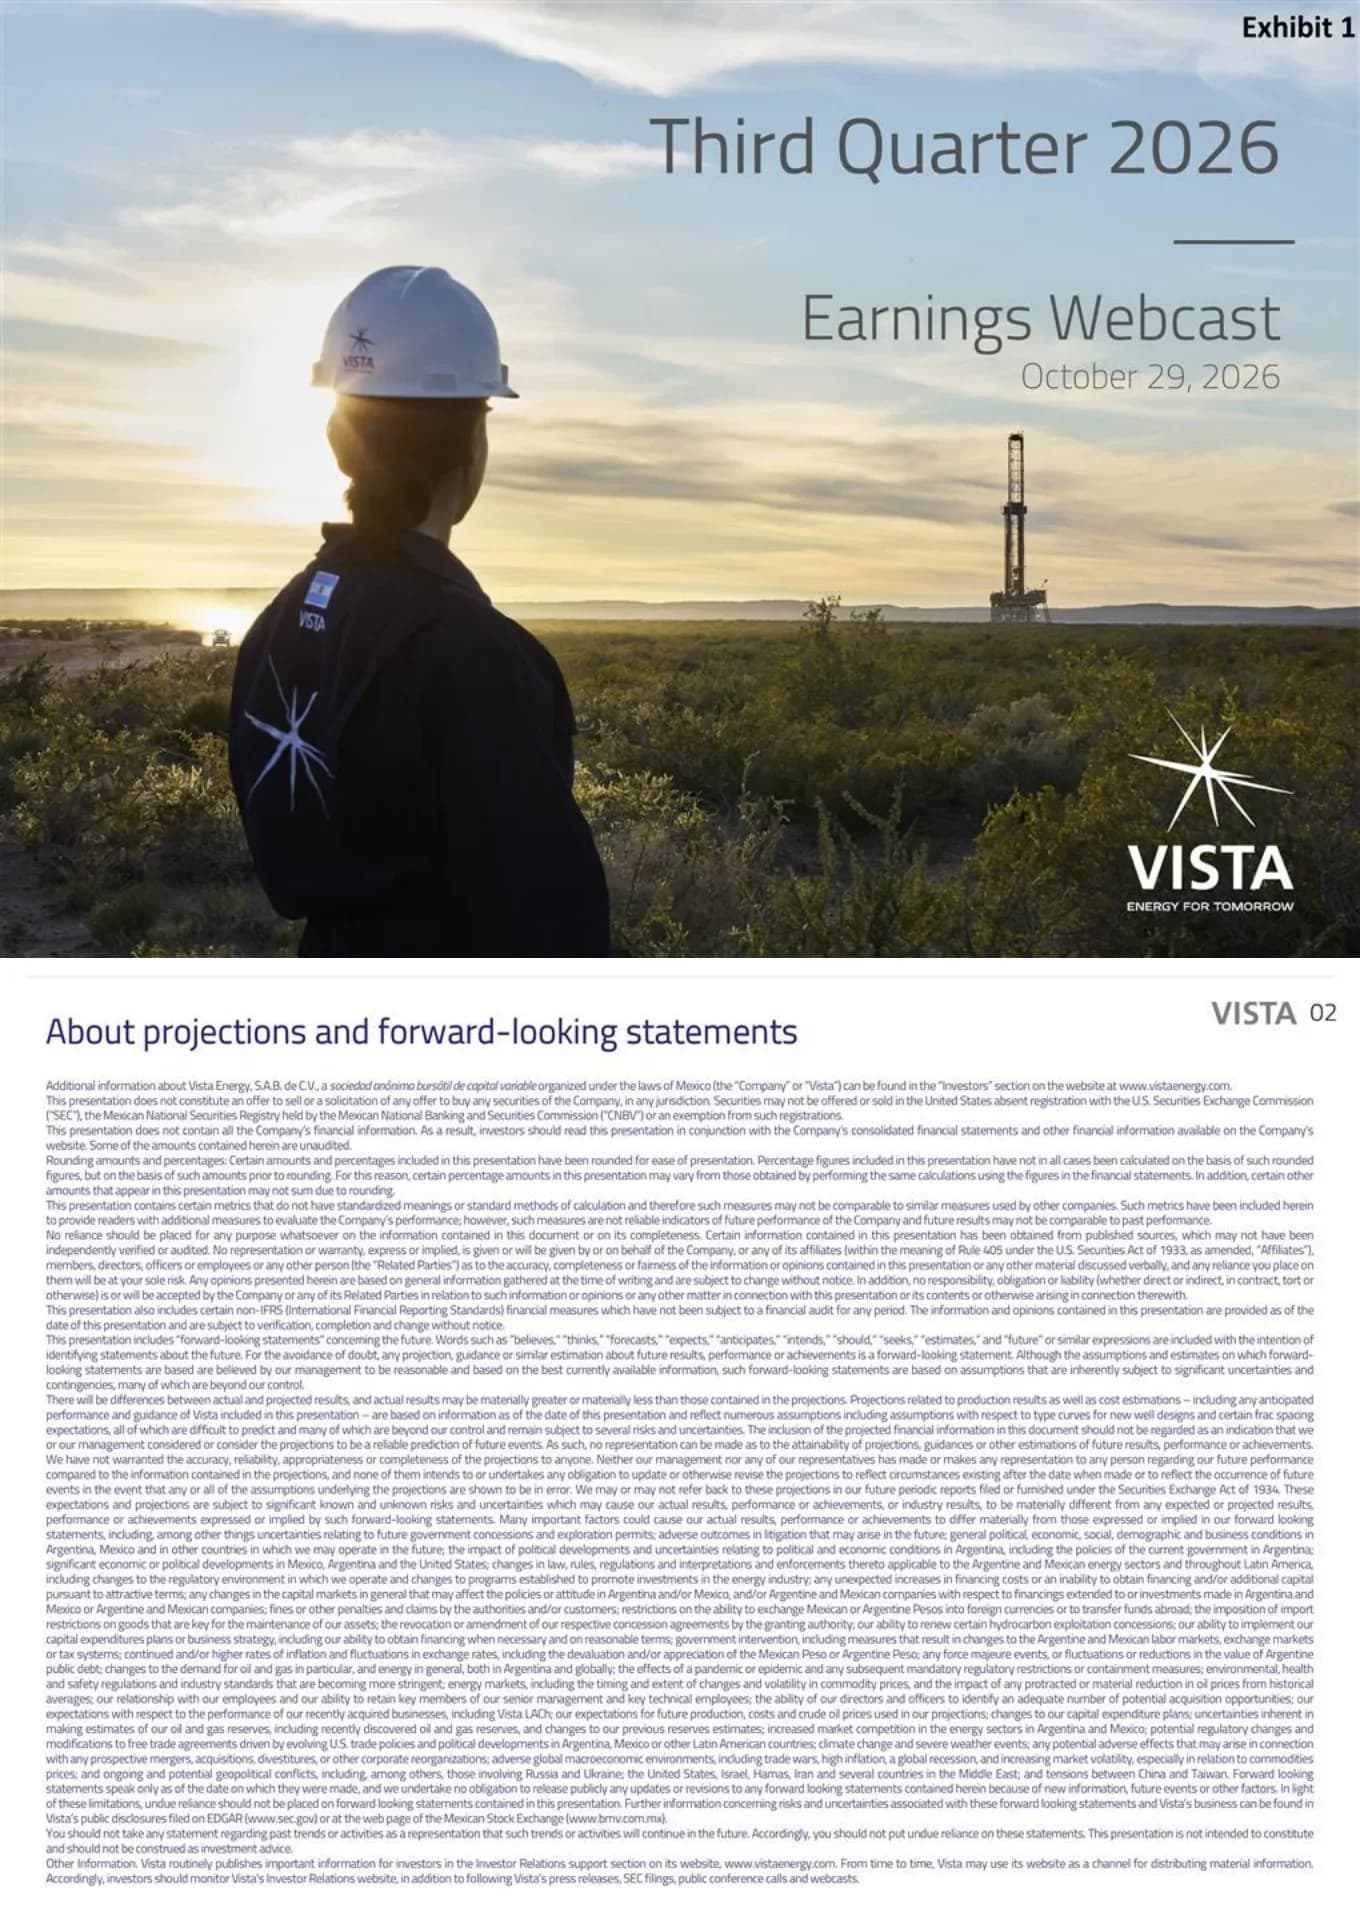
Cover slide titled 'Third Quarter 2026 Earnings Webcast', dated October 29, 2026, marked 'Exhibit 1' in the top-right corner as filed with the SEC, with the Vista 'Energy for Tomorrow' logo.
Full-bleed landscape photograph with right-aligned title, divider line and date in the upper right; logo in the lower right corner.
Legal disclaimer for Vista Energy, S.A.B. de C.V., a Mexican sociedad anónima bursátil de capital variable: the deck is not an offer of securities, some figures are unaudited and rounded, non-IFRS measures are used, and forward-looking statements are subject to risks including Argentine and Mexican political and economic conditions, commodity prices, FX controls, concessions, and integration of recently acquired businesses such as Vista LACh. It points readers to filings on EDGAR and the Mexican Stock Exchange (BMV) and to the investor relations website.
Title at top left with page number and Vista wordmark top right; dense full-width justified paragraph text in small type.
Ten KPI tiles: production 169 Mboe/d (+33% y-o-y, +8% q-o-q); oil production 147 Mbbl/d (+34%, +9%); revenues US$1,234 million (+75%, +7%); lifting cost US$4.7/boe (+6%, +5%); capex US$460 million (+31% y-o-y, -2% q-o-q); Adj. EBITDA US$841 million (+78%, +4%); net income US$293 million (-7%, -9%); EPS US$2.6 per share (-12%, -10%); free cash flow US$334 million (+US$363 million y-o-y); net leverage ratio 1.12x, or 1.04x pro forma. Footnotes explain that results exclude a 16.3% non-controlling interest in Bandurria Sur Participaciones S.A., that revenues are shown net of commodity risk management contracts and sea freight selling expenses (reported revenues US$1,265 million), and how the pro forma leverage ratio is calculated.
Grey header band with title and 'Q3 2026 HIGHLIGHTS' subtitle; two rows of five metric tiles each with a large number, unit and y-o-y / q-o-q deltas; landscape photo strip at the bottom carrying footnotes.
Three bar charts comparing Q3-25, Q2-26 and Q3-26: total production 126.8, 156.1 and 169.0 Mboe/d (+33% y-o-y, +8% q-o-q); oil production 109.7, 135.4 and 147.1 Mbbl/d (+34%, +9%); natural gas production 2.65, 3.17 and 3.43 MMm³/d (+29%, +8%). Growth came from new well activity, with 91 wells connected in the last 12 months and 25 net wells tied in during Q3-26 (14 in Bajada del Palo Oeste, 3 in Bajada del Palo Este, 6 at a 50% working interest in La Amarga Chica and 2 at a 25.1% working interest in Bandurria Sur). A footnote gives LPG production of 336 boe/d in Q3-26.
Title at top; three equal-width bar charts side by side with bracket arrows showing y-o-y and q-o-q growth; two check-mark bullets below; footnote at bottom.
Revenues rose from US$706 million in Q3-25 to US$1,154 million in Q2-26 and US$1,234 million in Q3-26 (+75% y-o-y, +7% q-o-q), with oil exports of 6.3, 8.6 and 9.9 MMbbl representing 62%, 72% and 73% of oil sales volume. Average realized oil price was US$64.6, US$89.4 and US$84.2 per barrel (+30% y-o-y, -6% q-o-q); oil made up 96-97% of net revenues and realized gas prices were US$3.3, 3.0 and 3.3 per MMBTU. Commentary: revenue growth driven by 34% higher oil production and 30% higher realized prices, all oil sold at export parity, and the price increase driven by higher Brent. Footnotes list export duties of US$50.2 million in Q3-26.
Two-column layout: revenue bar chart with a small data table of export volumes on the left, realized oil price bar chart with a table of oil share and gas price on the right; check-mark bullets under each chart; footnotes at bottom.
Lifting cost per boe was US$4.4, 4.5 and 4.7 in Q3-25, Q2-26 and Q3-26 (+6% y-o-y), overlaid with total production of 126.8, 156.1 and 169.0 Mboe/d; the increase reflects slightly higher costs of peso-denominated goods and services amid a flat FX rate. Selling expenses per boe fell from US$4.2 to 4.1 and 3.6 (-14% y-o-y), mainly from dilution of ship-or-pay costs in the Duplicar pipeline as volumes grew. Footnotes: Q3-26 operating costs of US$73.4 million over 15.6 MMboe produced; selling expenses of US$97.2 million, shown net of US$41.4 million of sea freight selling expenses.
Two side-by-side bar charts with legend under the left chart, one check-mark explanation under each chart, footnotes at bottom.
Adj. EBITDA was US$472 million in Q3-25, US$805 million in Q2-26 and US$841 million in Q3-26 (+78% y-o-y, +4% q-o-q). Adj. EBITDA margin was 67%, 70% and 68% (+1 p.p. y-o-y) against realized oil prices of US$64.6, 89.4 and 84.2 per barrel. Netback was US$40.5, 56.7 and 54.1 per boe (+34% y-o-y). Commentary: EBITDA growth driven by a 75% increase in total revenue amid flat operating unit costs, and sequential growth as production offset lower realized oil prices.
Three bar charts across the slide (Adj. EBITDA, margin with oil-price diamond overlay, netback), legend under the middle chart, two check-mark bullets and a footnote below.
Q3 2026 cash-flow waterfall: beginning cash of US$605 million, operating cash flow of US$773 million, investing cash flow of US$(439) million (free cash flow of US$334 million), financing cash flow of US$(164) million and ending cash of US$775 million. Operating cash flow reflects flat working capital and includes US$50 million of income tax payments; investing flows reflect accrued capex of US$460 million and a US$20 million decrease in capex-related working capital; financing flows reflect US$60 million of net debt repayments, US$55 million of share repurchases and US$24 million of interest payments. Net leverage ratio was 1.12x LTM Adj. EBITDA at quarter-end. A footnote notes reported ending cash of US$785 million including the Bandurria Sur non-controlling interest.
Full-width waterfall chart with a dotted callout box bracketing the FCF bars; four check-mark bullets below; two footnotes at bottom.
Four takeaways: robust production growth from new well tie-ins and full-quarter consolidation of new assets; strong financial performance driven by production growth, higher oil prices and cost efficiency; a stronger cash position and lower net leverage ratio; and the company is on track to deliver its 2026 guidance across all key operating and financial metrics.
Left two-thirds split into a 2x2 grid of purple tiles in graduated shades, each with a check icon and short statement; right third a portrait photo of a field worker in front of a drilling rig.
Closing slide with the Vista 'Energy for Tomorrow' logo, 'THANKS!' and 'Q&A', inviting questions at the end of the earnings webcast.
Full-bleed sunset landscape photograph with centered logo and text stack.
Definitions of units and metrics used in the deck: $ means US dollars and $MM million US dollars; $/bbl and $/boe per barrel of oil and oil equivalent; formulas for Adj. EBITDA, Adj. EBITDA margin, Adj. EPS and Adj. net income; bbl/d, boe/d, Mbbl, MMbbl and MMboe; abbreviations BS (Bandurria Sur), BdT (Bajo del Toro) and LACh (La Amarga Chica); FCF as operating plus investing cash flow; lifting cost scope; NLR as net financial debt over LTM Adj. EBITDA; netback as Adj. EBITDA over total production; Turnover Tax ('Ingresos Brutos'); Vista LACh, formerly Petronas E&P Argentina S.A.; WI as working interest.
Title at top left with page marker top right; single-column bulleted list of definitions in small type.
이 슬라이드 및 기본 프레젠테이션 콘텐츠에 대한 일반적인 질문.
It is the 11-page slide deck Vista Energy used for its Third Quarter 2026 Earnings Webcast on October 29, 2026. It covers production, revenues, realized prices, unit costs, Adj. EBITDA, free cash flow and closing remarks, followed by a glossary.
Vista Energy, S.A.B. de C.V. is incorporated in Mexico and listed in New York, so it filed the deck with the SEC as an exhibit to Form 6-K (the cover is marked 'Exhibit 1'). The slides in the filing are rasterised images, and the deck is also available on Vista's investor relations website.
All financial figures are in US dollars. The deck writes millions of US dollars as '$MM' and unit metrics as $/bbl and $/boe, as defined in the glossary on page 11.
Total production was 169 Mboe/d (+33% year over year), oil production 147 Mbbl/d, revenues US$1,234 million (+75%), Adj. EBITDA US$841 million (+78%), free cash flow US$334 million and lifting cost US$4.7/boe. Net leverage ratio was 1.12x, or 1.04x pro forma.
The highlights slide shows net income of US$293 million (-7% y-o-y) and EPS of US$2.6 (-12%) even as Adj. EBITDA rose 78%. The deck does not break down the below-EBITDA items on these slides, so refer to the full 6-K earnings release for the reconciliation.
Yes. You can download the original PDF and a PPTX version converted from it. Because the source slides are images, the PPTX is best used as a layout reference; charts and text may need to be rebuilt to edit them fully.
Yes, as a structural reference. Its flow (KPI dashboard, production, revenue, costs, EBITDA, cash-flow waterfall, takeaways, Q&A, glossary) suits any oil and gas or commodity producer reporting quarterly results. Replace Vista's data and branding with your own.
Vaca Muerta is a large shale formation in Neuquén, Argentina. Vista's blocks named in the deck, such as Bajada del Palo Oeste, Bajada del Palo Este, La Amarga Chica and Bandurria Sur, are located there and drive its production growth.
Original filing of this deck as an exhibit to Form 6-K

Create Your Own Slides
Turn your ideas into professional presentations in seconds with 2slides AI.
전문 디자인을 참조하고, 스타일을 선택하며, 완벽한 텍스트 렌더링으로 슬라이드를 생성하세요. Nano Banana로 구동—지금 프레젠테이션 만들기를 시작하세요.


