
수록 모음: 투자자 발표자료 사례 · 인도 기업 IR 자료 예시
Titan Company Limited's (Tata group) Earnings Presentation for the quarter and half year ended 30 September 2026 (Q2 FY27 / H1 FY27), filed with BSE and NSE on 5 November 2026. The 75-page deck covers the company profile, executive summary, segment results for Jewellery, Watches, EyeCare, Emerging Businesses and TEAL, consolidated financials, ESG updates and detailed annexures, with all figures in ₹ crore.
이 프레젠테이션의 표지를 스타일 참고 자료로 사용해 내 콘텐츠로 슬라이드를 만듭니다. 아래에서 원하는 페이지를 골라 그 레이아웃을 참고로 쓸 수도 있습니다.
빠른 탐색
태그
슬라이드 공유
Titan Company Limited's (Tata group) Earnings Presentation for the quarter and half year ended 30 September 2026 (Q2 FY27 / H1 FY27), filed with BSE and NSE on 5 November 2026. The 75-page deck covers the company profile, executive summary, segment results for Jewellery, Watches, EyeCare, Emerging Businesses and TEAL, consolidated financials, ESG updates and detailed annexures, with all figures in ₹ crore.
레이아웃, 주요 콘텐츠 및 시각적 요소를 포함한 각 슬라이드 페이지의 상세 보기.
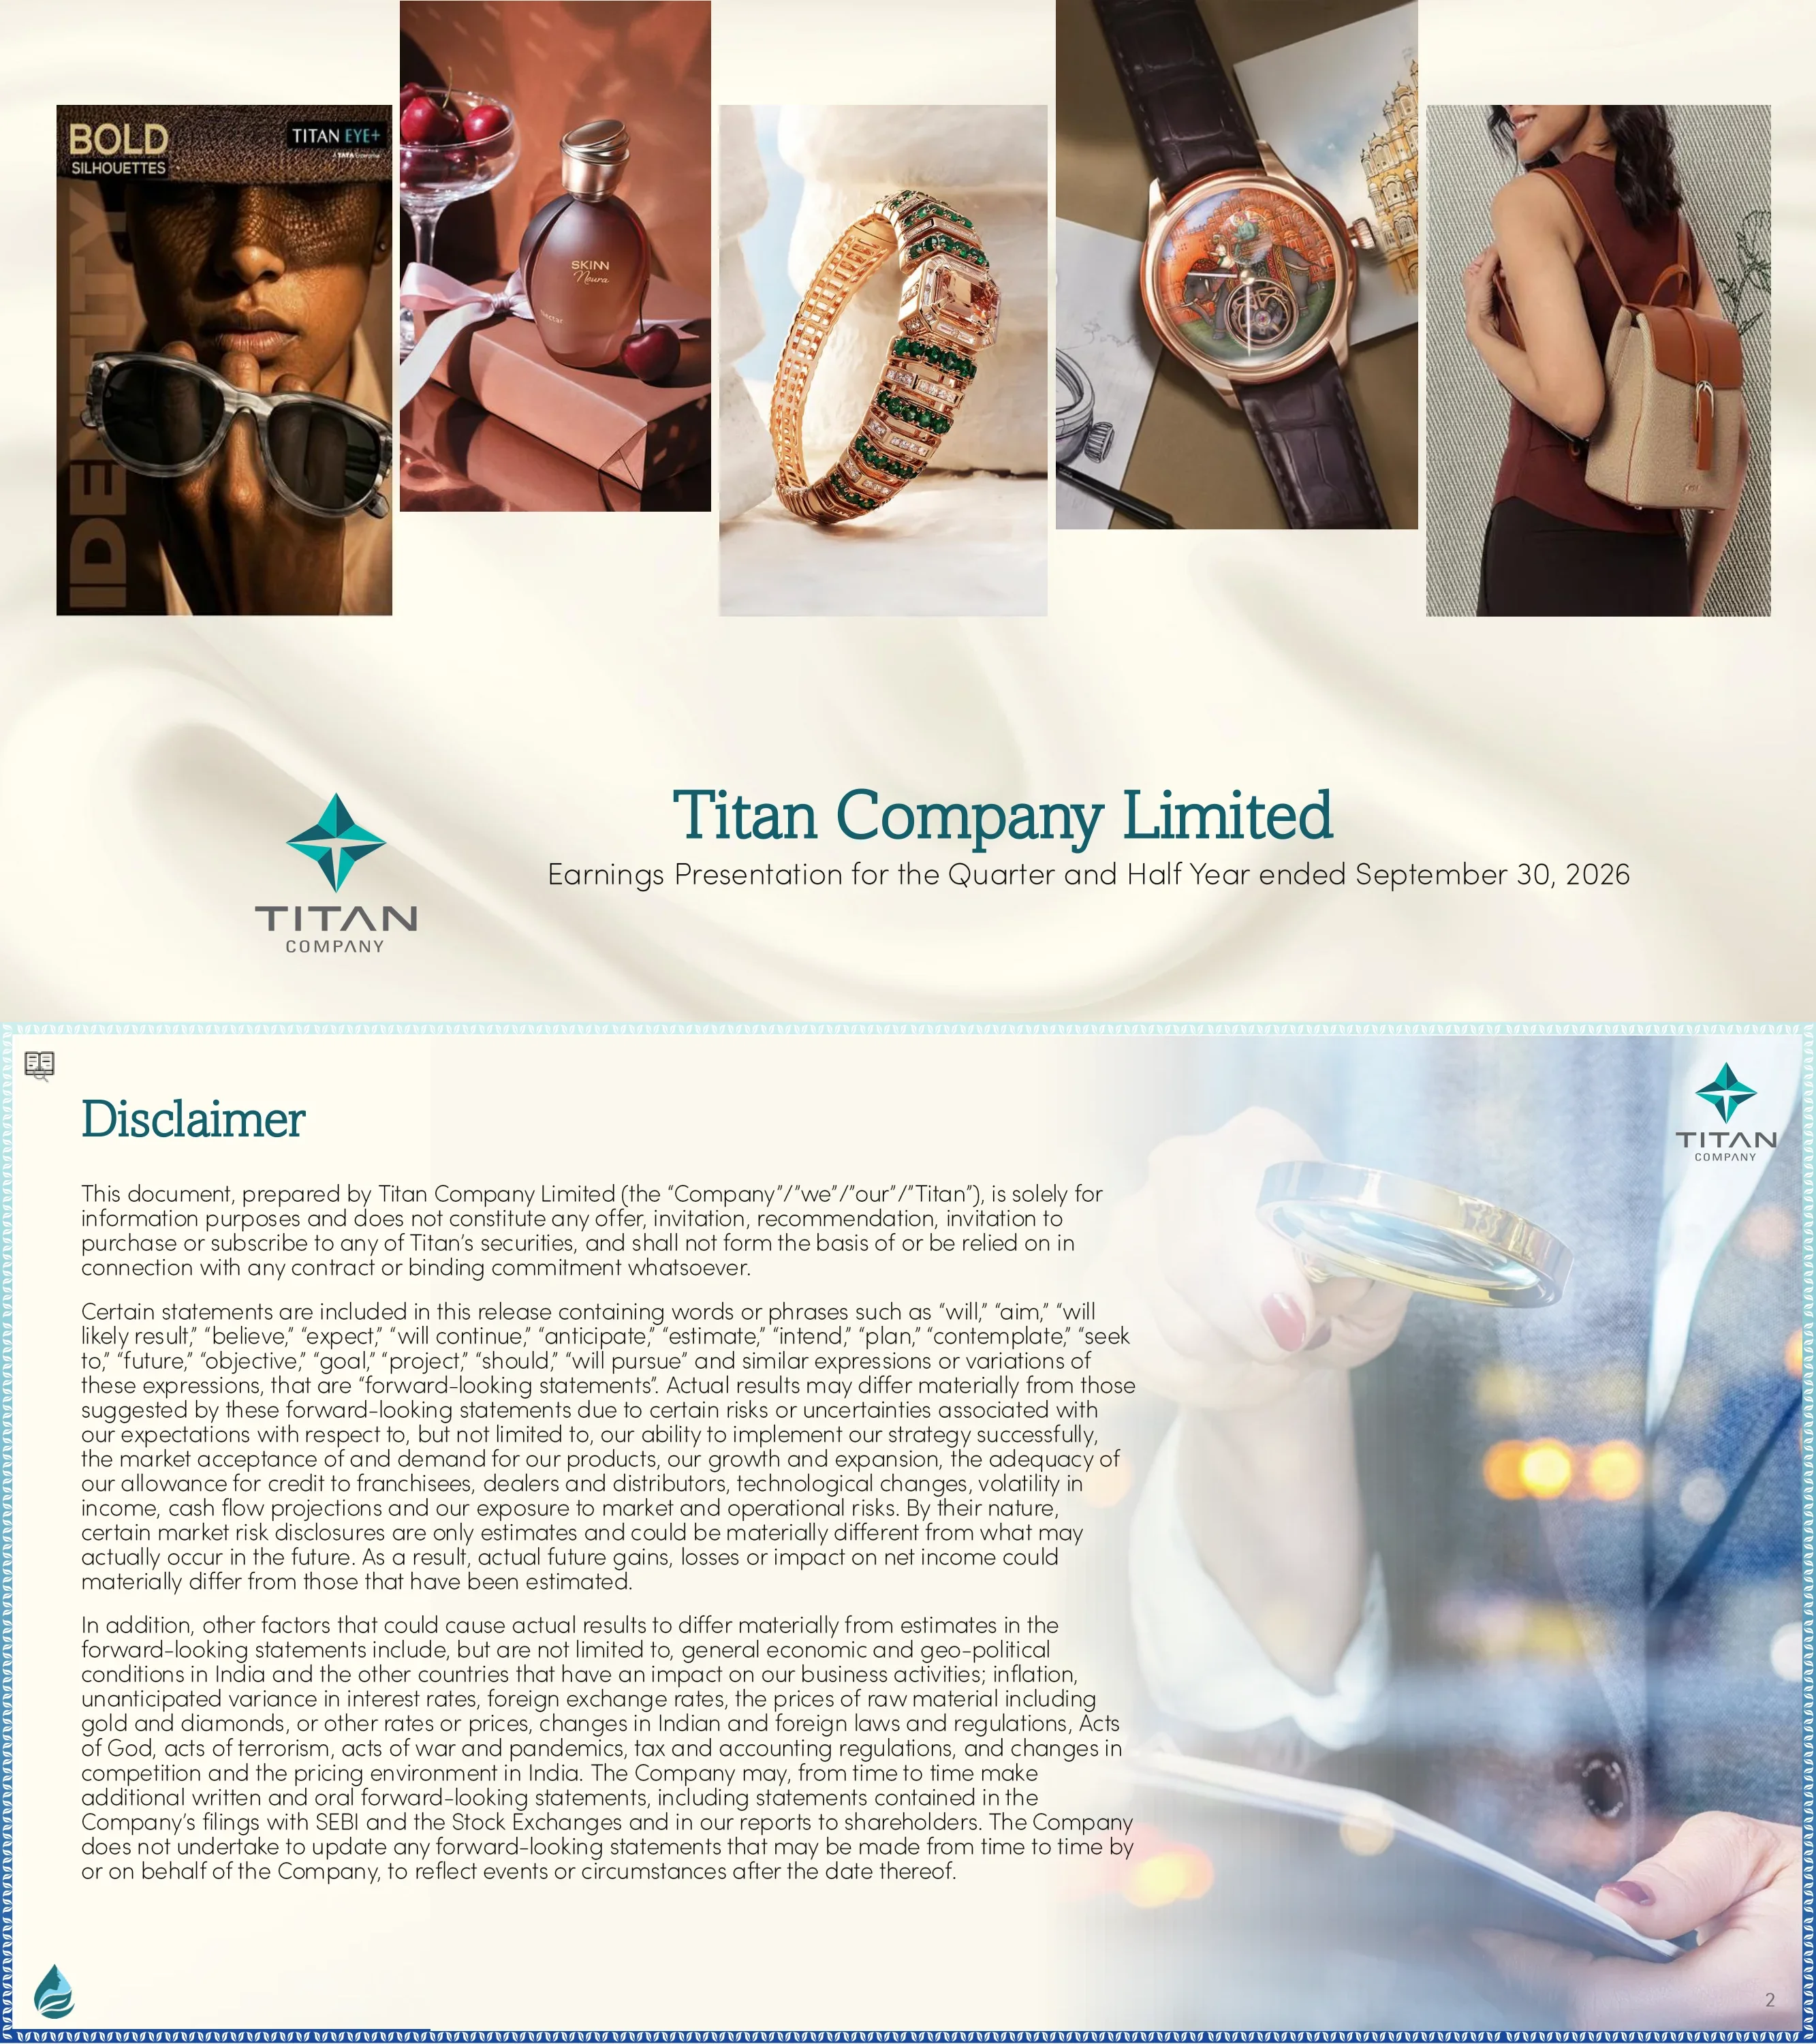
Cover for Titan Company Limited's earnings presentation for the quarter and half year ended September 30, 2026. Product photos of eyewear, perfume, jewellery, a watch and a bag represent the group's businesses.
Five product photo panels arranged over a silky ivory background, title text and Titan logo at bottom-left.
Forward-looking statements disclaimer covering risks such as gold and diamond prices, foreign exchange, regulation, and the company's filings with SEBI and stock exchanges.
Text-heavy left column with a single photo of a hand holding a magnifying glass on the right.
Opens the About the Company section with the tagline "Fuelled by Ideas. Scaling Frontiers." The agenda lists The Titan Story, Our Journey So Far, Our Business Segments, Titan Brands and Titan Company Structure, followed by Executive Summary, Business Performance, Financial Performance and Other Updates.
Left angled image with teal and blue diagonal stripes, right-hand agenda list with the current section highlighted in an orange arrow banner.
Iceberg infographic presenting the Vision ("We create elevating experiences for the people we touch") and Mission above the waterline, with six values below: Customer First, People Make the Brand, Culture and Teamwork, Passion for Excellence, Creativity and Innovation, Corporate Citizenship.
Central iceberg illustration split by a waterline, with vision and mission above and six value callouts below.
Staircase timeline from 1984 to 2026 marking milestones such as Titan (1987), Tanishq (1996), Sonata (1998), Titan Eye+ (2007), CaratLane acquisition (2016), Irth (2022) and beYon and Damas (2026). Revenue bars rise to ₹76,078 crore in FY26 (₹354 crore in FY96, ₹808 crore in FY03, ₹2,996 crore in FY08, ₹11,343 crore in FY16).
Ascending staircase timeline with brand-launch labels and revenue bars along the steps.
Three columns profile Jewellery (India's leading organised jeweller, about 8.5% market share, 20%+ digitally influenced sales), Watches (about 27% analog market share, 10,000+ touchpoints) and EyeCare (#2 in organised optical retail, 800+ exclusive outlets), with manufacturing locations noted.
Three columns, each with a colour-coded diamond-icon banner (Jewellery gold, Watches grey, EyeCare teal), two headline stats, a manufacturing-capabilities list and a factory photo at the bottom.
Profiles Taneira (100+ weaving clusters, 75+ exclusive outlets, Weavershala), Fragrances (3,400+ MBOs, 14 Skinn kiosks, 950+ touchpoints) and Women's Bags (17 Irth outlets, about 170 department stores).
Three columns with coloured diamond-icon banners (Taneira pink, Fragrances orange, Women's Bags yellow), stacked headline stats and a product photo at the bottom of each column.
Bubble chart positions brands by touchpoints (0 to 1,000+) and price band (Mass, Mid, Premium, Luxury). Tanishq is the largest bubble at about 550 touchpoints in premium; Zoya sits in luxury, and Sonata and Zoop in mass.
Bubble chart with touchpoints on the x-axis and horizontal price-band rows on the y-axis, bubble size showing brand scale.
Organisation chart as of 30 September 2026: Titan Company Ltd with 100% subsidiaries TEAL, CaratLane Trading, TCL North America, Titan Holdings International FZCO (Dubai), and Titan Commodity Trading, plus a 67% stake in Signature Jewellery Holding Ltd leading to Damas LLC.
Top-down hierarchical org chart with percentage-ownership connectors and nested step-down subsidiaries.
Opens the Executive Summary section; the agenda lists Titan at a Glance, Quarter Highlights, Management Commentary and Business Highlights.
Left angled photo of the Titan HQ building with pond, striped diagonal overlay, right-hand agenda with orange arrow highlight.
Headline KPIs: ₹868 bn TTM total income (excluding bullion and digi-gold), ₹70 bn TTM PAT and ₹4,075 bn market cap; 3,758 stores, 5.6 mn sq ft retail area, 500+ towns; 15,500+ employees, 51 mn Encircle members, 11 manufacturing facilities. Figures on this page are in ₹ bn.
Three rows of icon-led KPI tiles with large numerals and short labels.
Two highlights: Tanishq marks 30 years with the "Celebrating you for 30 years" campaign, and Titan introduces Vetra, its in-house automatic watch movement.
Two staggered feature blocks: a Tanishq 30-years group photo top-left with headline and text on the right, and Vetra headline text bottom-left with a watch-movement image on the right.
Quote from Mr. Ajoy Chawla, Managing Director: Q2 FY27 delivered c.25% consolidated operating growth YoY despite a strong base and the festive calendar shifting into Q3 FY27. Jewellery saw design-led growth, watches an excellent quarter on premiumisation, with EyeCare momentum, emerging businesses scaling and TEAL strong.
Circular portrait of the Managing Director on the left and the commentary quote inside a teal-bordered box on the right.
Q2 FY26 vs Q2 FY27 domestic income: Jewellery 13,532 to 16,343 (+20.8%), Watches 1,446 to 1,838 (+27.2%), EyeCare 215 to 277 (+28.4%), Emerging 142 to 171, total 15,335 to 18,629 (+21.5%). Total domestic EBIT rose 1,720 to 2,717 (+57.9%), margin 11.2% to 14.6%.
Five columns of paired bar charts (income and EBIT) with YoY growth callouts and margin labels, segment colour-coded.
Consolidated Q2 FY27 total income: Jewellery 14,092 to 17,495 (+24.1%), Watches 1,477 to 1,881, EyeCare 220 to 281, Other businesses 557 to 808 (+45.1%). Titan Company total income was 16,407 to 20,533 (+25.1%) and EBIT 1,799 to 2,865 (+59.3%), margin 11.0% to 14.0%, excluding the Damas option-liability credit.
Five-column bar chart panel with income and EBIT bars per segment and a navy Titan Company total column.
H1 FY27 domestic income: Jewellery 25,774 to 33,286 (+29.1%), Watches 2,685 to 3,349, EyeCare 449 to 562, Emerging 250 to 299, total 29,159 to 37,496 (+28.6%). Total EBIT rose 3,402 to 5,366 (+57.8%), margin 11.7% to 14.3%.
Five columns of paired bars comparing H1 FY26 and H1 FY27 with growth callouts.
H1 FY27 consolidated: Jewellery 26,890 to 35,748 (+32.9%), Watches 2,750 to 3,424, EyeCare 458 to 570, Other 972 to 1,374. Titan Company total income 31,186 to 41,286 (+32.4%), EBIT 3,550 to 5,647 (+59.1%), margin 11.4% to 13.7%.
Five-column bar chart panel mirroring the quarterly view for the half year.
Damas was acquired in two tranches completed in Q4 FY26: 67% for ₹1,190 crore, with the remaining 33% milestone-linked after CY29 and an option liability of ₹1,668 crore booked. Fair-valued quarterly under Ind-AS 109, the liability fell by ₹671 crore due to Middle East volatility, a non-operational credit in reported results.
Full-width text slide with structured bullet points and key figures in bold.
Opens the Jewellery section of the presentation.
Left angled bridal photo with gold-toned diagonal stripes and the agenda list on the right with Jewellery highlighted.
Domestic jewellery grew c.20% to ₹14,935 crore with SSSG c.15%; studded +c.32% on Festival of Diamonds, plain gold +c.20%, coins -c.7%. EBIT was ₹2,142 crore at 14.3% (₹1,652 crore, 11.1% excluding a ₹490 crore customs duty benefit); 29 net stores added.
Left bullet commentary with growth figures and right-hand campaign photo collage.
CaratLane grew c.31% to ₹1,408 crore, with studded +c.33% and gold +c.20%. EBIT was ₹138 crore at 9.8% (₹92 crore, 6.6% excluding a ₹46 crore customs benefit); 13 net stores added.
Bullet commentary alongside campaign photos such as Thursday trendsetters and Chandrakor.
Tanishq, Mia and CaratLane grew c.41% in North America and c.23% in GCC, with a new Los Angeles store and 33 international stores. Damas core revenue was ₹364 crore, converted Tanishq stores ₹110 crore, Damas entity revenue ₹474 crore; GCC demand was soft and Damas has 122 stores in 6 GCC countries.
Bullet commentary on the left in two blocks (Tanishq/Mia/CaratLane international, then Damas) with three framed campaign photos on the right and a footnote.
Revenue and EBIT by brand: Domestic 13,532 to 16,343, International 561 to 1,152 (+105%) including Damas core 364, total 14,092 to 17,495; total EBIT 1,506 to 2,300, margin 10.7% to 13.1%. Tanishq, Mia and Zoya secondary growth was 19% overall and 15% like-to-like; studded share in mix rose 32% to 35%.
Coloured-header financial table with adjacent product-mix pie charts.
Showcases campaigns across brands: Tanishq (Rivaah "One Wedding. Many Stories.", Festival of Diamonds), CaratLane (Chandrakor, Kaashika), Mia ("Make Your Sister Cry", "Big Bling Fest"), Zoya (Emergence) and Damas ("Her Nation, Her Strength", Nuqoosh).
Large jewellery hero photo with the oversized title 'Jewellery: Campaigns' on the left; a column of diamond-framed thumbnails on the right, each with a brand heading and campaign bullets.
Tanishq Rivaah Wedding Signatures campaign, "For Marriages Crafted by You", shown through five wedding photos.
Five polaroid-style photo cards arranged across the page with the campaign headline.
Damas Nuqoosh "Stories That Shape You" featuring the Hala pendant, shown as a storyboard on craftsmanship.
Row of five green panels forming a sequential storyboard with jewellery close-ups.
Store counts Jun'26 to Sep'26: Tanishq domestic 532 to 539 and international 31 to 32 (2,864k sq ft, 318 towns), Mia 299 to 317, Zoya 13, beYon 2 to 6, CaratLane 381 to 394 (plus 2 international), Damas 122.
Left retail-network table by brand with store, area and town columns; store interior photos on the right.
Opens the Watches section with an image of a Titan Automatic watch on the wrist and the line "Elegance of Intricacy".
Left angled watch photo with diagonal stripes and agenda list with Watches highlighted.
Domestic watches grew c.27% to ₹1,838 crore on premiumisation; analog grew in the late twenties and smartwatches in the late single digits. EBIT rose c.73% to ₹412 crore at 21.9%; 34 net stores added (17 Titan World, 7 Fastrack, 3 Helios, 6 Helios Luxe, 1 Nebula).
Left commentary bullets and right dual-time-zone watch campaign photos.
Domestic income 1,446 to 1,838 (+27.2%), International 31 to 43, total 1,477 to 1,881 (+27.4%). EBIT 238 to 412 (+73.1%), margin 16.1% to 21.9% (+579 bps); secondary UCP growth Titan World 26% (20% LTL), Helios 30% (22%), Fastrack 16% (7%), LFS 19% (18%).
Coloured-header financial table with secondary-growth metrics beside it.
Campaigns for Titan Edge (Squircle Titanium), Raga with Alia Bhatt, Nebula (Phool Chadar) with Tarun Tahiliani, Fastrack (Gelato Maxxing) with Siddhant Chaturvedi, and Sonata (Summit) inspired by Ladakh.
Large watch hero photo with the oversized title 'Watches: Campaigns' on the left; a column of four diamond-framed thumbnails on the right, each with a brand heading and campaign bullets.
Vetra, Titan's in-house movement, presented as "A New Era in Indian Watchmaking" via exploded movement imagery.
Row of five dark panels with exploded watch movement visuals and short captions.
Store counts Jun'26 to Sep'26: Titan World 764 to 781, Fastrack 267 to 274, Helios 304 to 307, Helios Luxe 10 to 16, Nebula 0 to 1. MBO presence covers 8,500+ multi-brand retailers and 600+ large format stores.
Retail network table on the left with a Helios Luxe store photo on the right.
Opens the EyeCare section with a Titan Eye+ portrait.
Left angled portrait photo with teal diagonal stripes and the agenda with EyeCare highlighted.
Domestic income 215 to 277 (+28.4%), total 220 to 281 (+27.7%); EBIT 12 to 23 (+91.7%), margin 5.3% to 8.2%. Secondary UCP growth was 23% omni-channel; no net stores added (27 openings offset by closures) and 32 renovations.
Table of quarterly metrics with commentary bullets and the Switchers campaign photo.
Myoslo lens for myopia management in children, shown through three Titan Eye+ campaign posters.
Three campaign posters side by side with a short headline.
Titan Eye+ has 838 domestic and 7 international stores covering 586k sq ft across 313 towns; Runway has 9 stores.
Retail network table beside storefront photos.
Opens the Emerging Business section with a photo of a woman carrying a tote bag.
Left angled photo with pink diagonal stripes and agenda with Emerging Business highlighted.
Revenue was ₹171 crore (+20.8% per the table) and the EBIT loss narrowed from (24) to (6). Women's bags grew high-teens, fragrances robustly, and Taneira high-single-digit with secondary UCP growth of 16% (13% LTL).
Commentary and compact results table with Taneira, Skinn Amalfi Bleu and Irth product photos.
Store counts: Taneira 77 to 76, Irth 19 to 21, Skinn 2.
Small retail network table beside an Irth store photo.
Titan Eye+ Myopia Excellence Centres, Skinn "Make Every Moment Special" with Ayushmann Khurrana and Sobhita Dhulipala, Taneira "Drapes of Gratitude", and Fastrack Bags "Carry More, Weigh Less".
Sunglasses hero photo with the oversized title 'Other Campaigns' on the left; four teal diamond-framed thumbnails on the right with category headings and campaign bullets.
Opens the TEAL (Titan Engineering and Automation Ltd) section with an automation assembly line photo.
Left angled factory photo with yellow-toned stripes and agenda with TEAL highlighted.
TEAL total income rose 415 to 636 (+53.3%) and EBIT 94 to 178 (+89.4%), margin 22.7% to 28.0%, with growth in Automation Solutions and Manufacturing Services and opportunities in aerospace, electronics, semiconductors and new energy.
Metrics table with commentary bullets and robot arm and factory photos.
Opens the Financial Performance section; the agenda lists Financials (Business and Reported), Capital Employed, and Financial Performance Trends.
Left angled photo with blue stripes and agenda with Financial Performance highlighted.
Consumer businesses income 15,931 to 19,828 (+24%), international 596 to 1,199 (+101%), TEAL 415 to 636, businesses total 16,346 to 20,465 (+25%) with EBIT 1,826 to 2,908 (+59%). Consolidated excluding bullion was 16,407 to 21,204 (+29%), EBIT 1,799 to 3,536 (+97%), margin 16.7%, including the ₹671 crore Damas credit; reported including bullion was 18,837 to 21,430 (+14%).
Large reconciliation table with coloured header rows moving from business view to reported totals.
H1 FY27 consumer businesses 30,347 to 40,041 (+32%), businesses total 31,068 to 41,115 (+32%) with EBIT 3,602 to 5,691 (+58%). Consolidated excluding bullion 31,186 to 41,957 (+35%), EBIT 3,550 to 6,318 (+78%); reported 35,465 to 42,932 (+21%).
Same reconciliation table format as the quarterly view, for the half year.
Stacked bars of liabilities, equity and assets per segment, Q2 FY26 vs Q2 FY27. Titan total assets rose 52,030 to 71,806, equity 12,803 to 18,263, liabilities 39,227 to 53,543; Jewellery assets 39,375 to 57,839.
Paired stacked bar charts per segment, colour-coded.
Total income bars Q1'24 to Q2'27 (Q2'27 ₹21,204 crore, +29%; FY24 47,454; FY25 57,338; FY26 76,078, +33%; H1 FY27 41,957) and PAT bars (Q2'27 ₹2,393 crore, 11.3% margin; FY26 5,073; H1 FY27 4,170, 9.9%).
Two chart rows: total income bars with a YoY growth line on top, PAT bars with a margin line below, quarters grouped by fiscal year with summary labels.
Jewellery income 24,478 to 67,602 with EBIT 3,069 to 7,209; Watches 2,317 to 5,267 with EBIT 100 to 824; EyeCare 517 to 916 with EBIT 56 to 77.
Three segment panels of bar charts with EBIT margin lines.
FY22 to FY26: total income 27,988 to 76,078; EBIT 3,176 to 8,082; PAT 2,198 to 5,074; total equity 9,333 to 15,703; ROCE 33% to 46%; ROE 26% to 37%.
Grid of six charts: bar charts for total income, EBIT and PAT with growth or margin lines on top; line charts for total equity, ROCE and ROE below.
TTM PAT rose from 693 (Sep-20) to 6,474 (Sep-26) and average equity from 7,087 to 15,251, lifting return on average equity from 14% (Mar-21) to 42% (Sep-26).
Two bar charts on top (TTM PAT and average equity) and a full-width return-on-average-equity line chart below.
Opens Other Updates; the agenda lists Dividend, Shareholding information, Awards and Recognition, and ESG at Titan.
Left angled gold trophy photo with diagonal stripes and agenda with Other Updates highlighted.
Dividend per share rose from ₹2.20 in FY16 to ₹15.00 in FY26, with a payout ratio of roughly 23 to 40% and total payout up to ₹1,332 crore in FY26.
Single bar chart of dividend per share FY16 to FY26 with a payout-ratio line and dashed orange boxes above the bars showing total payout.
As at 30 September 2026: promoters 52.90%, FIIs 16.37%, mutual funds 8.01%, insurance and banks 4.38%, retail 18.35%. Listed on BSE 500114 and NSE TITAN; market cap ₹4.07 lakh crore, 88.78 crore shares; market cap grew from 223,287 (Mar-23) to 407,494 (Sep-26).
Shareholding pie chart on the left and market-cap bar chart with listing details on the right.
Four recognitions: Volunteer Engagement Pinnacle Award (ICVS 2026), Tanishq Customer Jury Award at Making Customers Smile 2026, Jewellery ISCM Manufacturer of the Year at IIJA 2026, and Internal Audit recognition by TBEX.
Four award descriptions in text columns across the top with a strip of four award photos underneath.
ESG framework launched July 2025: Environmental goals for FY30 (water positive, net zero Scope 1 and 2, 50% plastic reduction), Social goals for FY27/28 (2.5 mn CSR reach, GPTW 85), Governance FY30 and Partners.
Four chevron panels (Environmental and Social on the left, Governance and Partners on the right) flanking a central illustration of a parent lifting a child above a green city.
Quarter highlights: c.76.8 crore kWh renewable energy, 5,000 saplings, 22+ crore litre water storage; 67,000+ girl students, 8K families (IVDP), LeAP in Meghalaya and Mizoram, 31% female employees, 73,395 acres under precision irrigation, plus a governance ethics rating.
Three large pin-shaped icons (Environment, Social, Governance) on the left with rows of metric tiles to the right and a strip of photos at the bottom.
Initiatives across Girl child and Education (Kanya+, PAL model in 500 Tamil Nadu schools), Skill development (8,000+ youth, LeAP), Affirmative Action, Footprints, and Design Impact (32 craft enterprises, 3,863 artisans).
Horizontal blue ribbon with five curled initiative icons, theme titles above and below, bullet notes at top and bottom, and photos at the ends.
Factory initiatives (500 TR maglev chiller in jewellery ISCM, 95% water recycling in watches), Planet (Akka Thangai waterbody restoration, 3L+ saplings near Hosur) and Safety (Suraksha Gurukul, 2,087 trained, 16,368 hours).
Factory-initiative text columns on the left, a central two-tone circle graphic, Planet and Safety columns on the right and a strip of photos along the bottom.
Opens the Annexures section containing detailed trends and financial statements.
Full-bleed photo of charts and a hand holding a pen, with the orange 'Annexures' title on the left.
Quarterly income Q1'24 to Q2'27; Q2'27 income ₹14,935 crore (+20%), FY26 59,643. EBIT Q2'27 ₹2,142 crore (14%); H1 FY27 EBIT 4,344 at 14.3%.
Two chart rows: total income bars with a YoY growth line on top, EBIT bars with a margin line below, with fiscal-year summary labels.
CaratLane Q2'27 income ₹1,408 crore (+31%), FY26 4,702; EBIT 138 (10%); H1 FY27 EBIT 304 at 10.7%.
Two chart rows: total income bars with a YoY growth line on top, EBIT bars with a margin line below, with fiscal-year summary labels.
All domestic brands Q2'27 income ₹16,343 crore (+21%), FY26 64,345; EBIT 2,281 (14%).
Two chart rows: total income bars with a YoY growth line on top, EBIT bars with a margin line below, with fiscal-year summary labels.
Consolidated jewellery Q2'27 income ₹17,495 crore (+24%), FY26 67,602; EBIT 2,300 (13%); H1 FY27 EBIT 4,660 at 13.0%.
Two chart rows: total income bars with a YoY growth line on top, EBIT bars with a margin line below, with fiscal-year summary labels.
Domestic watches Q2'27 income ₹1,838 crore (+27%), FY26 5,105; EBIT 417 (23%); H1 FY27 EBIT 712 at 21%.
Two chart rows in charcoal tones: total income bars with a growth line on top, EBIT bars with a margin line below.
Domestic EyeCare Q2'27 income ₹277 crore (+28%), FY26 898; EBIT 25 (9%); H1 FY27 EBIT 50 at 9.0%.
Two chart rows in teal tones: total income bars with a growth line on top, EBIT bars with a margin line below.
Bridge table from business income of 20,465 through international primary sales, bullion and digi-gold (226) and others to reported consolidated income of ₹21,430 crore; standalone income ₹17,945 crore.
Full-width reconciliation table with coloured header and subtotal rows.
Business EBIT of 2,908 plus adjustments of 628 (including the ₹671 crore Damas credit) gives reported group EBIT of ₹3,536 crore; standalone EBIT 2,574.
Reconciliation table with coloured header and subtotal rows.
Bridge from business income of 41,115 to reported consolidated income of 42,932; standalone income 36,187.
Full-width reconciliation table with subtotal rows.
Business EBIT of 5,691 reconciles to reported EBIT of 6,318; standalone EBIT 5,122.
Reconciliation table with coloured header and subtotal rows.
Q2 total income 16,643 to 17,945 (+7.8%), EBITDA 1,729 to 2,742, EBIT 1,583 to 2,574, PAT 1,006 to 1,572 (+56.2%); H1 PAT 2,036 to 3,271 (+60.6%). Bullion sales were nil in Q2 FY27.
Detailed P&L table with quarter and half-year columns and growth percentages.
Q2 total income 18,837 to 21,430 (+13.8%), including a ₹671 crore fair-value change in the put option liability; gross contribution 25.2% to 30.2%; EBITDA 1,987 to 3,800; EBIT 1,799 to 3,536 (16.7%); PBT 1,522 to 3,000; PAT 1,120 to 2,393 (+114%, 11.3% margin); H1 PAT 2,211 to 4,170 (+88.6%).
Detailed P&L table with quarter and half-year columns and growth percentages.
Mar-26 vs Sep-26: total assets 53,617 to 64,659; inventories 34,980 to 42,686; equity 20,487 to 22,148; borrowings 6,239 to 19,876; gold on loan 14,314 to 10,321.
Single full-width balance sheet table with Mar-26, Sep-26 and change columns, assets listed first then equity and liabilities, with shaded subtotal rows.
Total assets 60,561 to 71,806; inventories 42,743 to 50,861; goodwill 790; equity 15,703 to 18,263; current borrowings 11,285 to 24,191; gold on loan 16,070 to 12,278.
Single full-width balance sheet table with Mar-26, Sep-26 and change columns, assets listed first then equity and liabilities, with shaded subtotal rows.
Closing slide inviting queries to investor-relations@titan.co.in.
Portrait of a model wearing gold jewellery on the left; large blue 'Thank You!' heading and investor-relations email on the right.
이 슬라이드 및 기본 프레젠테이션 콘텐츠에 대한 일반적인 질문.
It covers the quarter and half year ended 30 September 2026. Titan's fiscal year FY27 runs from April 2026 to March 2027, so Q2 FY27 is July to September 2026 and H1 FY27 is April to September 2026.
It is the official earnings presentation of Titan Company Limited (a Tata group company), filed with BSE (500114) and NSE (TITAN) on 5 November 2026. The presentation is in English.
Figures are in ₹ crore (Indian rupees) unless stated otherwise; 1 crore equals 10 million rupees. The Titan at a Glance page uses ₹ bn and no USD conversion is applied.
Consolidated business total income was ₹20,533 crore, up 25.1% YoY, with EBIT of ₹2,865 crore. Reported consolidated PAT was ₹2,393 crore, which includes a ₹671 crore credit from the fair valuation of the Damas option liability.
It covers Jewellery (Tanishq, Mia, Zoya, beYon, CaratLane, Damas), Watches (Titan, Fastrack, Sonata, Raga, Edge, Nebula, Helios), EyeCare (Titan Eye+, Runway), Emerging Businesses (Taneira, Skinn, Irth) and TEAL, with results, retail networks and campaigns for each.
About the Company, Executive Summary, Jewellery, Watches, EyeCare, Emerging Business, TEAL, Financial Performance, Other Updates (dividend, shareholding, awards, ESG) and Annexures with trends, P&L and balance sheets.
Yes. Its structure works as a model for listed-company results decks: agenda-led section dividers, KPI dashboards, YoY bar charts, coloured-header tables, org charts, campaign showcases and reconciliation annexures. Replace the content with your own figures and branding.

Create Your Own Slides
Turn your ideas into professional presentations in seconds with 2slides AI.
전문 디자인을 참조하고, 스타일을 선택하며, 완벽한 텍스트 렌더링으로 슬라이드를 생성하세요. Nano Banana로 구동—지금 프레젠테이션 만들기를 시작하세요.


