
수록 모음: 투자자 발표자료 사례
Seven & i Holdings H1 FY2026 Earnings Presentation (決算説明資料) — the 33-page Japanese-language interim results deck for the six months to August 2026 (fiscal year ending February 2027), released October 8, 2026 on TDnet, the Tokyo Stock Exchange disclosure system. It covers consolidated results on an adjusted basis that strips out the deconsolidation of York Holdings and Seven Bank, the 7-Eleven transformation plan at Seven-Eleven Japan (SEJ) and 7-Eleven, Inc. (SEI), the PayPay / LINE Yahoo / SMBC Card / SoftBank partnership, shareholder returns, and the full-year forecast. Yen figures follow the company's own unit of ¥100 million (億円) unless noted; SEI figures are in US$ millions.
이 프레젠테이션의 표지를 스타일 참고 자료로 사용해 내 콘텐츠로 슬라이드를 만듭니다. 아래에서 원하는 페이지를 골라 그 레이아웃을 참고로 쓸 수도 있습니다.
빠른 탐색
태그
슬라이드 공유
Seven & i Holdings H1 FY2026 Earnings Presentation (決算説明資料) — the 33-page Japanese-language interim results deck for the six months to August 2026 (fiscal year ending February 2027), released October 8, 2026 on TDnet, the Tokyo Stock Exchange disclosure system. It covers consolidated results on an adjusted basis that strips out the deconsolidation of York Holdings and Seven Bank, the 7-Eleven transformation plan at Seven-Eleven Japan (SEJ) and 7-Eleven, Inc. (SEI), the PayPay / LINE Yahoo / SMBC Card / SoftBank partnership, shareholder returns, and the full-year forecast. Yen figures follow the company's own unit of ¥100 million (億円) unless noted; SEI figures are in US$ millions.
레이아웃, 주요 콘텐츠 및 시각적 요소를 포함한 각 슬라이드 페이지의 상세 보기.
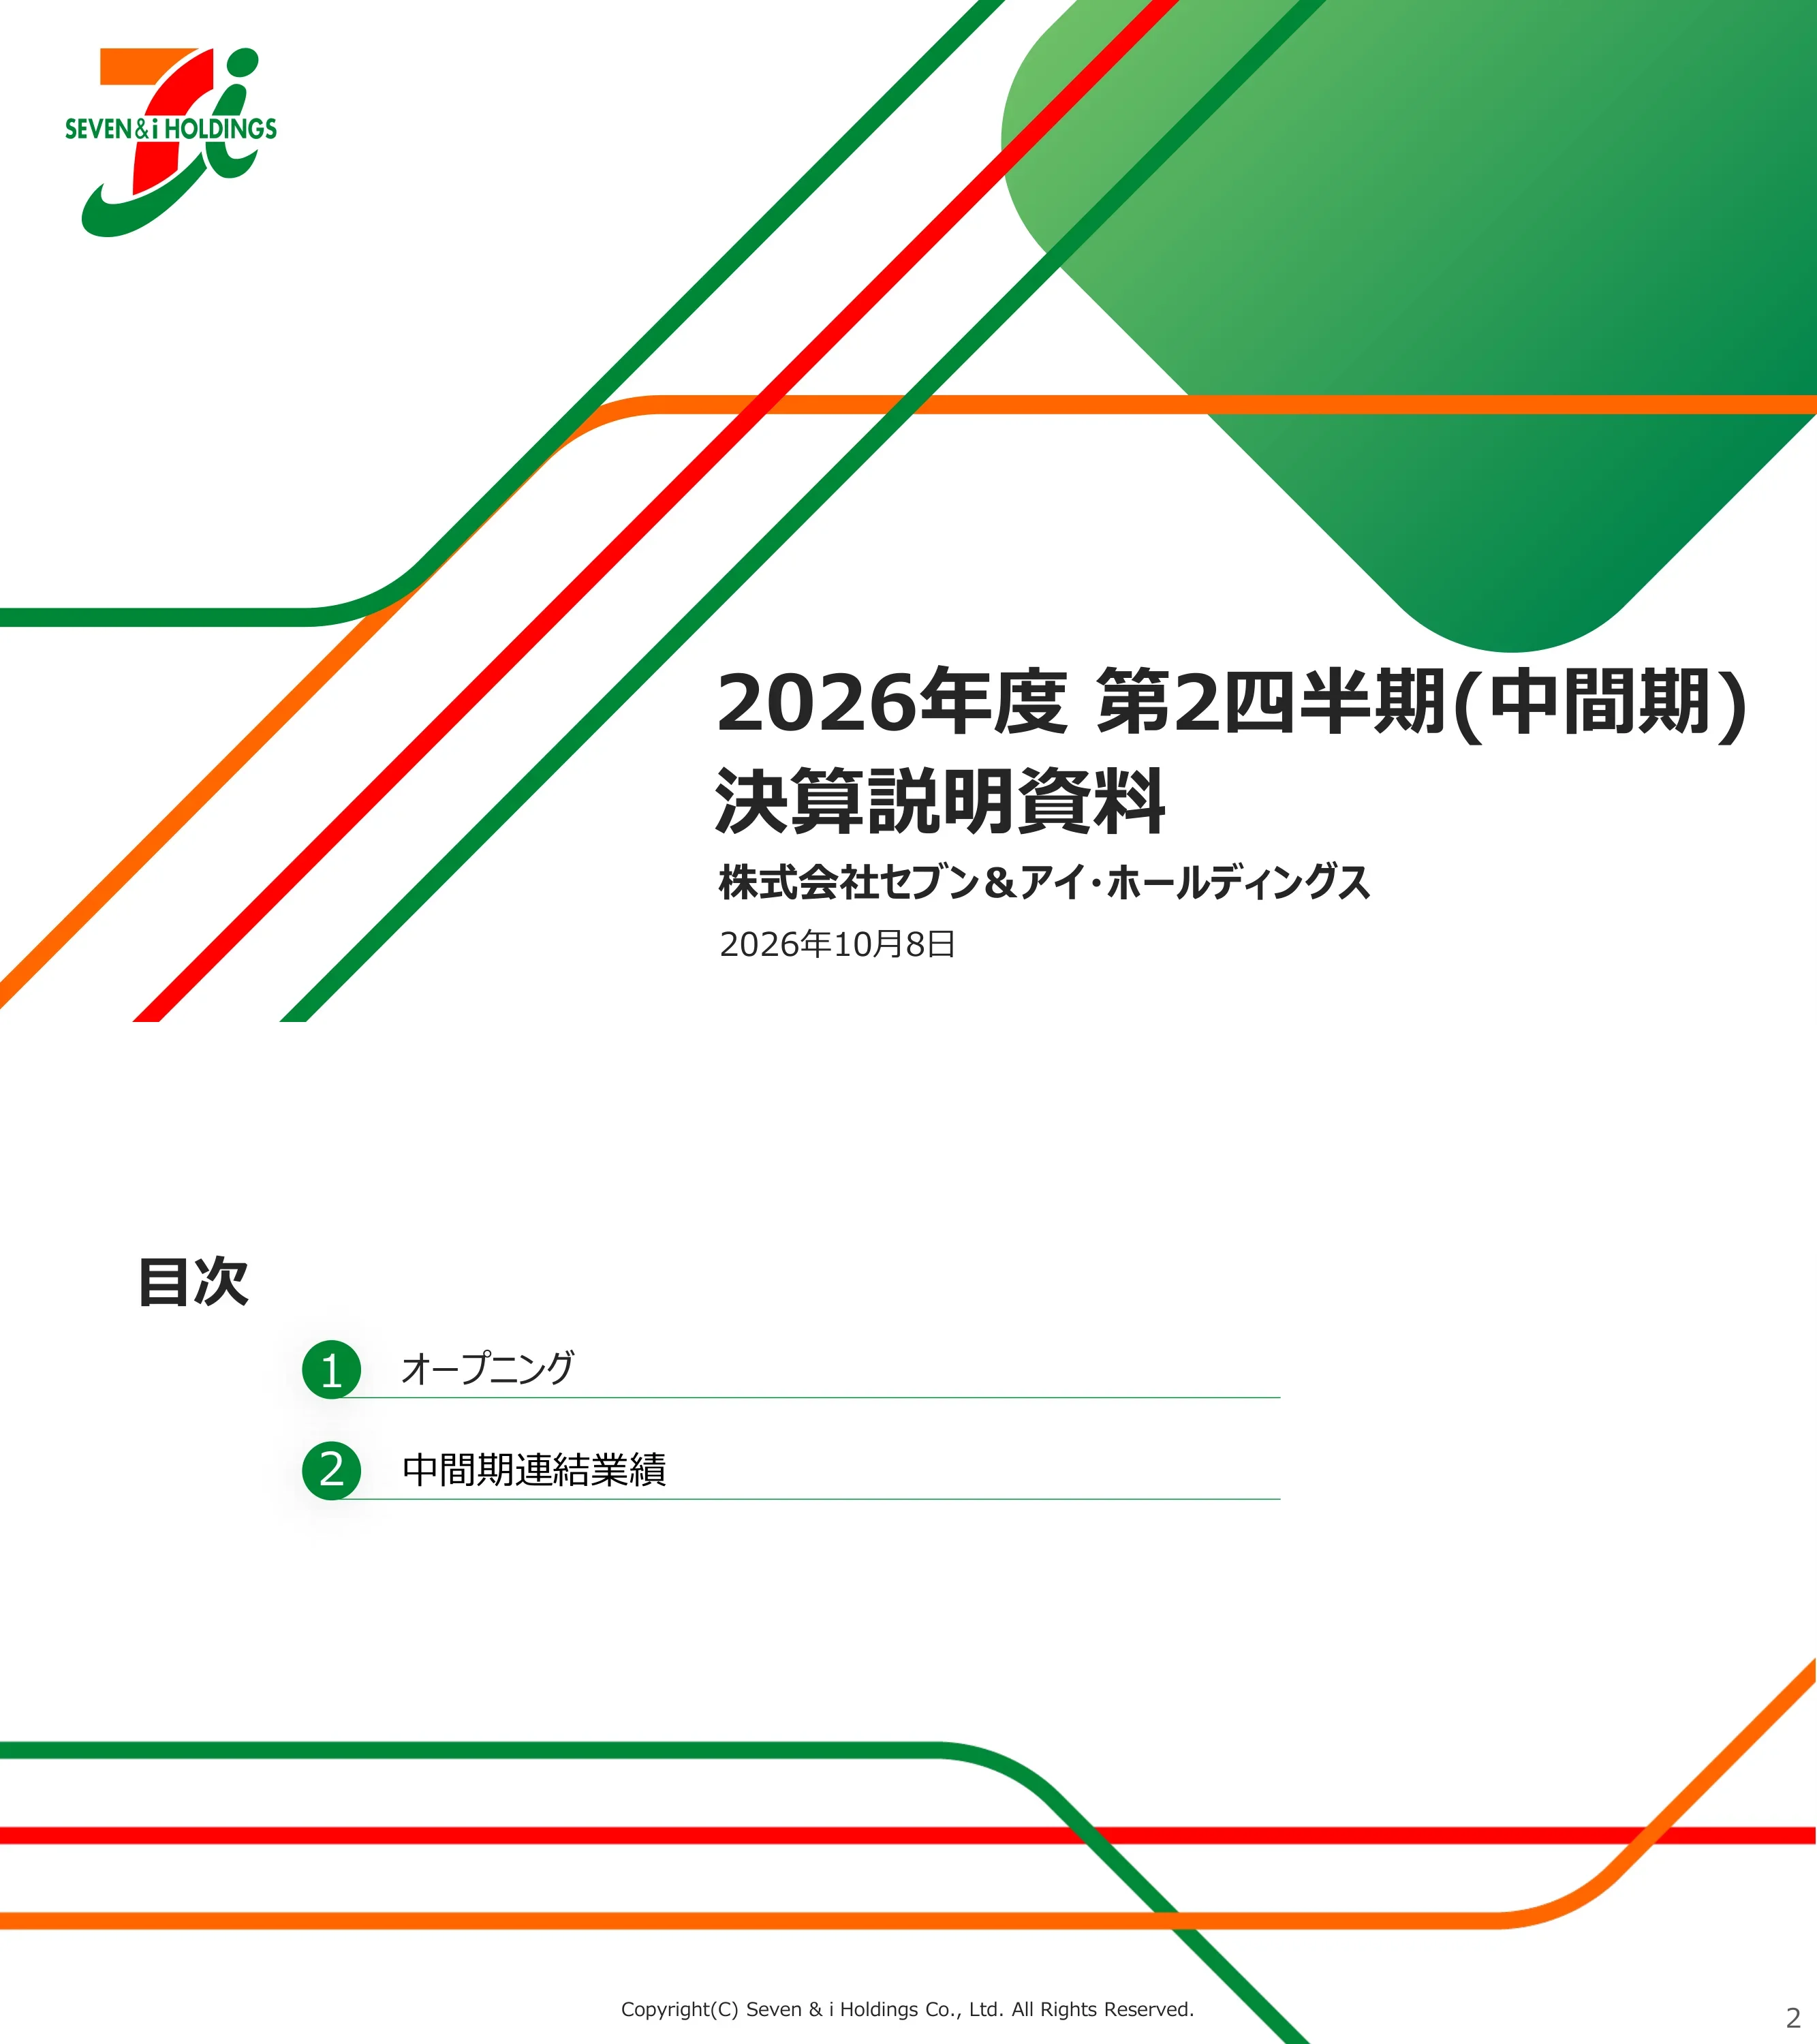
Title slide reading 2026年度 第2四半期(中間期) 決算説明資料 (FY2026 Q2 Interim Earnings Presentation) for Seven & i Holdings Co., Ltd., dated October 8, 2026.
White cover with the Seven & i logo top left, bold title block bottom right, and sweeping diagonal green, red and orange stripes crossing a large green rounded diamond.
Table of contents (目次) with two sections: 1) Opening and 2) Interim consolidated results.
Left-aligned heading with two numbered rows on green circular markers and thin underlines; brand stripes run along the bottom.
Section divider repeating the agenda with item 1, Opening, highlighted and item 2 greyed out.
Same agenda layout with active/inactive states: green marker for the current section, grey for the rest.
On an adjusted basis excluding the deconsolidation of York Holdings and Seven Bank, operating revenue was ¥54,602 hundred million (116.3% YoY), operating income ¥2,322 hundred million (136.6%) and net income ¥1,244 hundred million (117.8%); the banner says steady execution of the transformation plan delivered double-digit revenue and profit growth despite a tough environment.
Three equal cards with grey headers, each a two-bar FY2025 vs FY2026 chart with a red callout bubble for the growth rate; green takeaway banner at the bottom.
Fresh food differentiation: SEJ freshly made counter products lifted existing-store sales by +0.9 pt (total +1.1%), and SEI's hot food expansion shows a growth trend; SEI's 7NOW delivery reached $550M in H1 (+15.6% YoY) with healthy profitability, ahead of the full-year pace; fuel vertical integration captured profit opportunities; store-network optimization via franchise conversion improved sales and gross margin.
Four-panel dashboard: a tall left card split SEJ/SEI, a central 7NOW card with a giant dollar figure, and two stacked right cards with line icons; green conclusion banner.
A strategic partnership with SoftBank, PayPay, LINE Yahoo and SMBC Card (Sumitomo Mitsui Card) creates an unmatched customer touchpoint for a better customer experience and smarter store operations; new SEI CEO Mauricio Leyva brings deep customer understanding, transformation leadership and execution, having more than doubled Grupo Modelo's Mexican convenience-store network and led post-merger transformation at Keurig Dr Pepper.
Two-column split: left orange-header panel with partner logos connected to the Seven & i / 7-Eleven hub; right green-header panel with CEO headshot and three round icons; green banner below.
Section divider highlighting item 2, Interim consolidated results.
Agenda layout with item 2 in green and item 1 greyed out.
Group CVS merchandise sales ¥50,459 hundred million (104.1%); operating revenue ¥54,602 (adjusted 116.3%, reported 97.2%, 99.1% of revised plan); operating income ¥2,322 (136.6% adjusted, 111.5% reported); ordinary income ¥2,219 (137.6%); net income ¥1,244 (117.8%, 105.5% of plan); EBITDA ¥4,906 (119.8%); EPS ¥54.26 and pre-goodwill-amortization EPS ¥78.31; FX $1 = ¥158.29.
Financial table with a solid green highlight column for FY2026 values, then three column groups: adjusted basis, reported basis and revised-plan comparison; footnotes below.
Overseas CVS more than offset the domestic decline: overseas operating income ¥1,504 hundred million (187.7%, +702) including 7-Eleven, Inc. at $1,320M (145.8%), while domestic CVS fell to ¥1,098 (90.2%) with SEJ at ¥1,102 (90.7%); overseas revenue ¥49,666 (117.7%); Others ¥323 revenue / ¥27 income; eliminations and corporate ▲¥307.
Segment table split into revenue and operating income halves, each with a highlighted value cell and two stacked comparison cells (YoY and vs revised plan); green headline banner on top.
Operating income fell ¥112 hundred million from ¥1,214 to ¥1,102: revenue +59, gross margin ▲1.3, SG&A ▲170 (systems ▲87, advertising ▲18); existing-store sales +1.1% with merchandise gross margin 31.8% (flat); quarterly same-store sales ran +2.0% in Q1 but +0.3% in Q2 on summer weather (+1.2% excluding drinks and ice); higher system costs from the next-generation system lap in Q4 and H1 SG&A was on plan.
Left waterfall bridge with callout boxes; right top line chart comparing two series over six quarters with a red callout; right bottom checklist card on SG&A.
Contribution to H1 existing-store sales growth (+1.1%): freshly made counter products +0.9% (margin +0.1 pt), toys +0.4%, drinks/ice ▲0.2%; Live-Meal counter products targeting young and dual-income customers grew daily sales +15.6% (+¥5.9 thousand per store per day), and IP-content toys grew +32.0% (+¥2.9 thousand), driving traffic.
Left contribution table with a dark grey header row and colour-coded categories; arrow into right-side cards showing target × scene tags and large green growth figures; green banner.
Seven Café Bakery in about 12,000 stores (FY plan ~18,000) and Seven Café Tea in about 4,600 (plan ~10,000); counter products' average daily sales +15.6%; 210 new stores and net +26 against a plan of 550 openings / net +200; 7NOW mobile ordering launched April 2026 and total 7NOW sales rose +35.5%.
Left card for fresh food with line icons and big store counts; right cards for store network and 7NOW; green banner 'key initiatives progressing steadily'.
A tie-up of number-one players — 7-Eleven (~21,000 stores, ~20 million customers a day), PayPay (~30 million code payments a day), LINE Yahoo (~100 million users), SMBC Card (¥42 trillion card spending) and SoftBank — to gain customer touchpoints and data; joint promotions from FY2026 H2, customer ID integration, store points and large-scale promotions from FY2027 H2, and AI and robotics for store operations in the mid to long term.
Hub-and-spoke diagram with a 7-Eleven store illustration at the center, orange 'No.1' labels around partner logos, and a right-side roadmap panel with app screenshots; green banner.
Operating income rose $414M from $905M to $1,320M: merchandise +$25M, fuel +$398M (market conditions and vertical integration), SG&A ▲$8M; existing-store sales +0.6% and merchandise gross margin 33.5% (+0.3 pt); quarterly same-store merchandise sales were +1.4% in Q1 and ▲0.1% in Q2; $52M of fuel-related card fees are booked in fuel.
Left waterfall bridge in US$ millions with callout boxes; right line chart of six quarters of same-store sales in orange.
Hot food expansion with new hot sandwiches and restaurant-quality boneless chicken wings; refreshed open cases that are eye-catching, appetizing and easy to shop, with better fresh food and functional drinks; existing-store fresh food sales improved from ▲3.9% in Q1 to ▲0.3% in Q2 and +1.7% in the Q3 flash estimate.
Left column of two cards with food photography and a store open-case photo plus bullets; right card with a three-point line chart (dashed for the flash estimate); green banner.
29 restaurants opened (FY plan 50) and 138 new private-brand items (plan 220); 7NOW sales $550M (+15.6%, FY plan $1.1 billion) with existing-store growth +9.9%; 7NOW available in 7,594 stores at H1-end against a FY2030 target of 8,500.
Left card with icon + big-number blocks; right card with 7NOW sales figure and a two-bar column chart of store counts; green banner on the digital platform.
69 new stores (FY plan 205), 86 franchise conversions (plan 390), 162 unprofitable store closures (plan 200), 79 fuel wholesale conversions (plan 350), and remodels under review to start in H2; the 47 stores converted to franchise in 2025 show low-to-mid single-digit merchandise sales growth and a significant gross margin improvement.
Single wide card: left grid of five plan-vs-actual figures, right summary of franchise-conversion results with growth icons; green banner.
Net share buyback of ¥1,000 hundred million (¥100 billion) in H1 and ¥7,000 hundred million (¥700 billion) cumulative, with ¥1.3 trillion remaining through 2030, funded partly by a ¥300 billion third-party allotment to SoftBank, PayPay and SMBC Card and a ¥400 billion ToSTNeT-3 repurchase; dividend per share (split-adjusted) rises from ¥37.6 in 2022 to ¥50.0 in 2025 and a forecast ¥60.0 for 2026 (¥30 interim + ¥30 year-end).
Two cards: left buyback bullets with a yen coin-stack icon and a dashed-box flow diagram; right stacked bar chart of dividends per share 2022–2026; green banner.
Divider introducing the appendix (補足資料).
Centered bold heading on white with the brand stripes along the bottom.
Total assets ¥94,684 hundred million (+3,254 from February 2026), including current assets ¥16,720 (cash ¥4,402) and non-current assets ¥77,960 (PP&E ¥46,410, intangibles ¥24,762); liabilities ¥57,333 with short-term borrowings down to ¥583, bonds ¥9,573, long-term loans ¥7,854 and lease obligations ¥14,717; net assets ¥37,350 (+868).
Side-by-side assets and liabilities/net assets tables with grey header rows, indented sub-items and three columns (Feb 2026, Aug 2026, change).
Consolidated EBITDA ¥4,906 hundred million (101.1% reported, 119.8% adjusted); domestic CVS EBITDA ¥1,577 (95.2%), overseas CVS ¥3,423 (132.4%, +837), Others ¥107 and corporate ▲¥201; Others' reported revenue fell to ¥323 (3.4%, ▲9,131) because of the deconsolidation, but rose 126.4% on an adjusted basis.
Three orange-header column groups (revenue, operating income, EBITDA), each with a value cell and a YoY cell showing reported and bracketed adjusted figures.
Against the revised plan, consolidated EBITDA came in at 100.9% (+46) while operating income was 99.3% (▲17); domestic CVS EBITDA was 93.9% (▲101), overseas CVS 101.4% (+48) and Others 153.1% (+37).
Same three-group table as the previous slide with green headers and plan-comparison columns.
H1 operating cash flow ¥3,370 hundred million (▲450 YoY), investing ▲¥1,682 (+7,150), free cash flow ¥1,687 (+6,700 after ▲5,012 a year earlier), financing ▲¥1,760 and period-end cash ¥4,271; five years of H1 figures from 2022 to 2026.
Clustered bar chart (orange operating, green investing, red financing) with a navy free-cash-flow line, above a five-year data table.
Quarterly same-store sales growth (+0.6% to +2.0% in FY2025, +2.0% and +0.3% in FY2026) plotted against gross margin change (+0.3 pt in Q1, ▲0.3 pt in Q2); average monthly franchisee profit for H1 at 98.8% of the prior year, after 104.2% (2022), 107.8% (2023), 96.9% (2024) and 95.8% (2025).
Two dual-axis combo charts side by side: bars for margin change or franchisee profit, line for growth rates, with the current period in darker green.
SEJ SG&A was ¥3,278 hundred million (105.5%, +170): advertising ¥236 (+18, stronger promotion), personnel ¥403 (+4.8, higher wage rates), rent ¥1,032 (+16, more stores), depreciation ¥466 (+35, next-generation system and store investment), utilities ¥336 (+2.7) and other ¥802 (+92, system and maintenance costs); the operating income bridge from ¥1,214 to ¥1,102 is repeated.
Left SG&A table with green header and a 'main factors' text column; right waterfall chart with orange negative bars.
Six quarters of SEI same-store merchandise sales (▲1.0% in Q1 FY2025 up to +1.4% in Q1 FY2026, then ▲0.1% in Q2) and merchandise gross margin, which was flat for three quarters before rising +0.7 pt in Q2 FY2026 to around 33.8%.
Left single-line chart; right dual-axis chart with margin-level bars and a margin-change line; current fiscal year in orange/dark green.
Total fuel gallons declined each quarter (▲8.8% in Q1 and ▲1.6% in Q2 FY2026) while cents-per-gallon margin rose +16.2¢ and +4.0¢ year on year; total fuel gross profit, including wholesale, reached its highest level of the six quarters in Q2 FY2026 at about $1.5 billion.
Left dual-axis chart (volume bars, CPG line); right column chart of quarterly fuel gross profit in US$ millions.
SEI SG&A was $4,697M (101.3%, +$60M): advertising $54M (▲23), personnel $1,348M (▲126, reclassification and fewer company-operated stores), rent $648M (+34), depreciation $691M (+5.4), utilities $267M (+3.3) and other $1,686M (+168); in yen, operating income rose ¥746 hundred million from ¥1,344 to ¥2,090 (merchandise +37, fuel +668, SG&A ▲90, FX +130).
Left SG&A table with driver notes; right yen-denominated waterfall with green positive bars and one orange negative bar.
Long-run quarterly view of retail fuel gallons sold per store (left axis, roughly 2,600–4,000 gallons) and retail cents-per-gallon margin (right axis) from Q1 2019 to Q2 2026, with the Speedway acquisition period marked from 2021; Q2 2026 volume per store and CPG sit near the dashed long-term reference line.
Full-width dual-axis chart with 30 quarterly bars (Q2 highlighted in green), a red CPG line, a dashed reference line and a Speedway timeline band.
H1 corporate costs of ▲¥307 hundred million (+41 vs prior year, +37 vs revised plan), of which DX, systems and security ▲¥202 and other ▲¥105; corporate investment was ¥23 hundred million (DX/systems ¥14, other ¥9.1).
Two side-by-side tables, orange 'costs' and green 'investment', each with actual, YoY difference and vs-plan columns.
Full-year guidance: group CVS merchandise sales ¥102,100 hundred million (104.5%), operating revenue ¥104,300 (109.7% adjusted, flat reported), operating income ¥4,250 (110.5%), ordinary income ¥3,900 (110.7%), net income ¥2,780 (109.1% adjusted, 95.0% reported), EBITDA ¥9,280 (107.1%), EPS ¥121.90 and pre-goodwill EPS ¥169.81; assumed FX $1 = ¥157.00.
Forecast table with green highlight column and adjusted vs reported comparison groups; footnotes below.
Domestic CVS revenue ¥9,500 hundred million and operating income ¥2,242 (SEJ ¥9,200 / ¥2,250); overseas CVS ¥94,260 / ¥2,700 (121.5%, +477), with 7-Eleven, Inc. at $55,000M revenue and $2,450M operating income (110.3%); Others ¥760 / ¥49; eliminations and corporate ▲¥220 / ▲¥741.
Segment forecast table split into revenue and operating income, with bracketed adjusted-basis comparisons for consolidated and Others.
Closing slide with the Seven & i Holdings logo and a disclaimer on forward-looking statements, listing risks such as economic conditions, FX and interest rates, competition, transformation-plan execution, input and labour costs, natural disasters, cyber incidents and regulatory changes.
Centered logo above a boxed small-print disclaimer, with the brand stripes along the bottom.
이 슬라이드 및 기본 프레젠테이션 콘텐츠에 대한 일반적인 질문.
The slides are the company's original Japanese-language earnings presentation (決算説明資料), published on TDnet, the Tokyo Stock Exchange's timely disclosure system, on October 8, 2026. This page adds an English page-by-page breakdown of all 33 slides with the key figures translated.
It covers the first half (中間期, six months to August 2026) of the fiscal year the company labels 2026年度 — the year ending February 2027. The company calls it the FY2026 second-quarter (interim) results.
On an adjusted basis that excludes the deconsolidation of York Holdings and Seven Bank, operating revenue was ¥54,602 hundred million (116.3% YoY), operating income ¥2,322 hundred million (136.6%) and net income attributable to owners ¥1,244 hundred million (117.8%). Growth came mainly from 7-Eleven, Inc., whose operating income rose from $905M to $1,320M on stronger fuel margins.
Most yen figures are in 億円, i.e. units of ¥100 million, so ¥54,602 means about ¥5.46 trillion. The ▲ symbol marks a negative number or decrease, 実質ベース means the adjusted basis, 財務会計ベース the reported basis, and 修正計画 the revised plan. 7-Eleven, Inc. figures are shown in US$ millions.
Yes. The deck is available as the original PDF and as an editable PPTX converted from it, so you can reuse the table layouts, waterfall bridges and section dividers in your own presentation.
A net ¥100 billion buyback in H1, ¥700 billion cumulative, and ¥1.3 trillion more planned through 2030, alongside a progressive dividend forecast of ¥60 per share for FY2026 (¥30 interim plus ¥30 year-end), up from ¥50 the year before.
Investors and analysts following Japanese retail, IR teams preparing interim results decks that reconcile adjusted and reported figures, and designers who need a clean reference for dense financial tables, plan-vs-actual comparisons and operating income waterfall charts.
White slides with a deep-green rule under each title, the Seven & i logo top right, grey or green card headers, and a solid green takeaway banner at the bottom of each message slide. Cover, agenda and closing pages use the brand's sweeping green, red and orange stripes.

Create Your Own Slides
Turn your ideas into professional presentations in seconds with 2slides AI.
전문 디자인을 참조하고, 스타일을 선택하며, 완벽한 텍스트 렌더링으로 슬라이드를 생성하세요. Nano Banana로 구동—지금 프레젠테이션 만들기를 시작하세요.


