
수록 모음: 투자자 발표자료 사례 · 일본 기업 IR 자료 예시
Resonac Holdings Q3 FY2026 Earnings Presentation is the 29-slide Japanese-language results deck (2026年12月期 第3四半期 決算説明資料) released on TDnet, the Tokyo Stock Exchange timely-disclosure service, on 11 November 2026 and presented by the CFO. Because Resonac's fiscal year is the calendar year, it covers January-September 2026 cumulative and the July-September quarter, plus a raised full-year 2026 forecast, with amounts in yen using the company's own unit of 100 million yen (億円).
이 프레젠테이션의 표지를 스타일 참고 자료로 사용해 내 콘텐츠로 슬라이드를 만듭니다. 아래에서 원하는 페이지를 골라 그 레이아웃을 참고로 쓸 수도 있습니다.
빠른 탐색
태그
슬라이드 공유
Resonac Holdings Q3 FY2026 Earnings Presentation is the 29-slide Japanese-language results deck (2026年12月期 第3四半期 決算説明資料) released on TDnet, the Tokyo Stock Exchange timely-disclosure service, on 11 November 2026 and presented by the CFO. Because Resonac's fiscal year is the calendar year, it covers January-September 2026 cumulative and the July-September quarter, plus a raised full-year 2026 forecast, with amounts in yen using the company's own unit of 100 million yen (億円).
레이아웃, 주요 콘텐츠 및 시각적 요소를 포함한 각 슬라이드 페이지의 상세 보기.
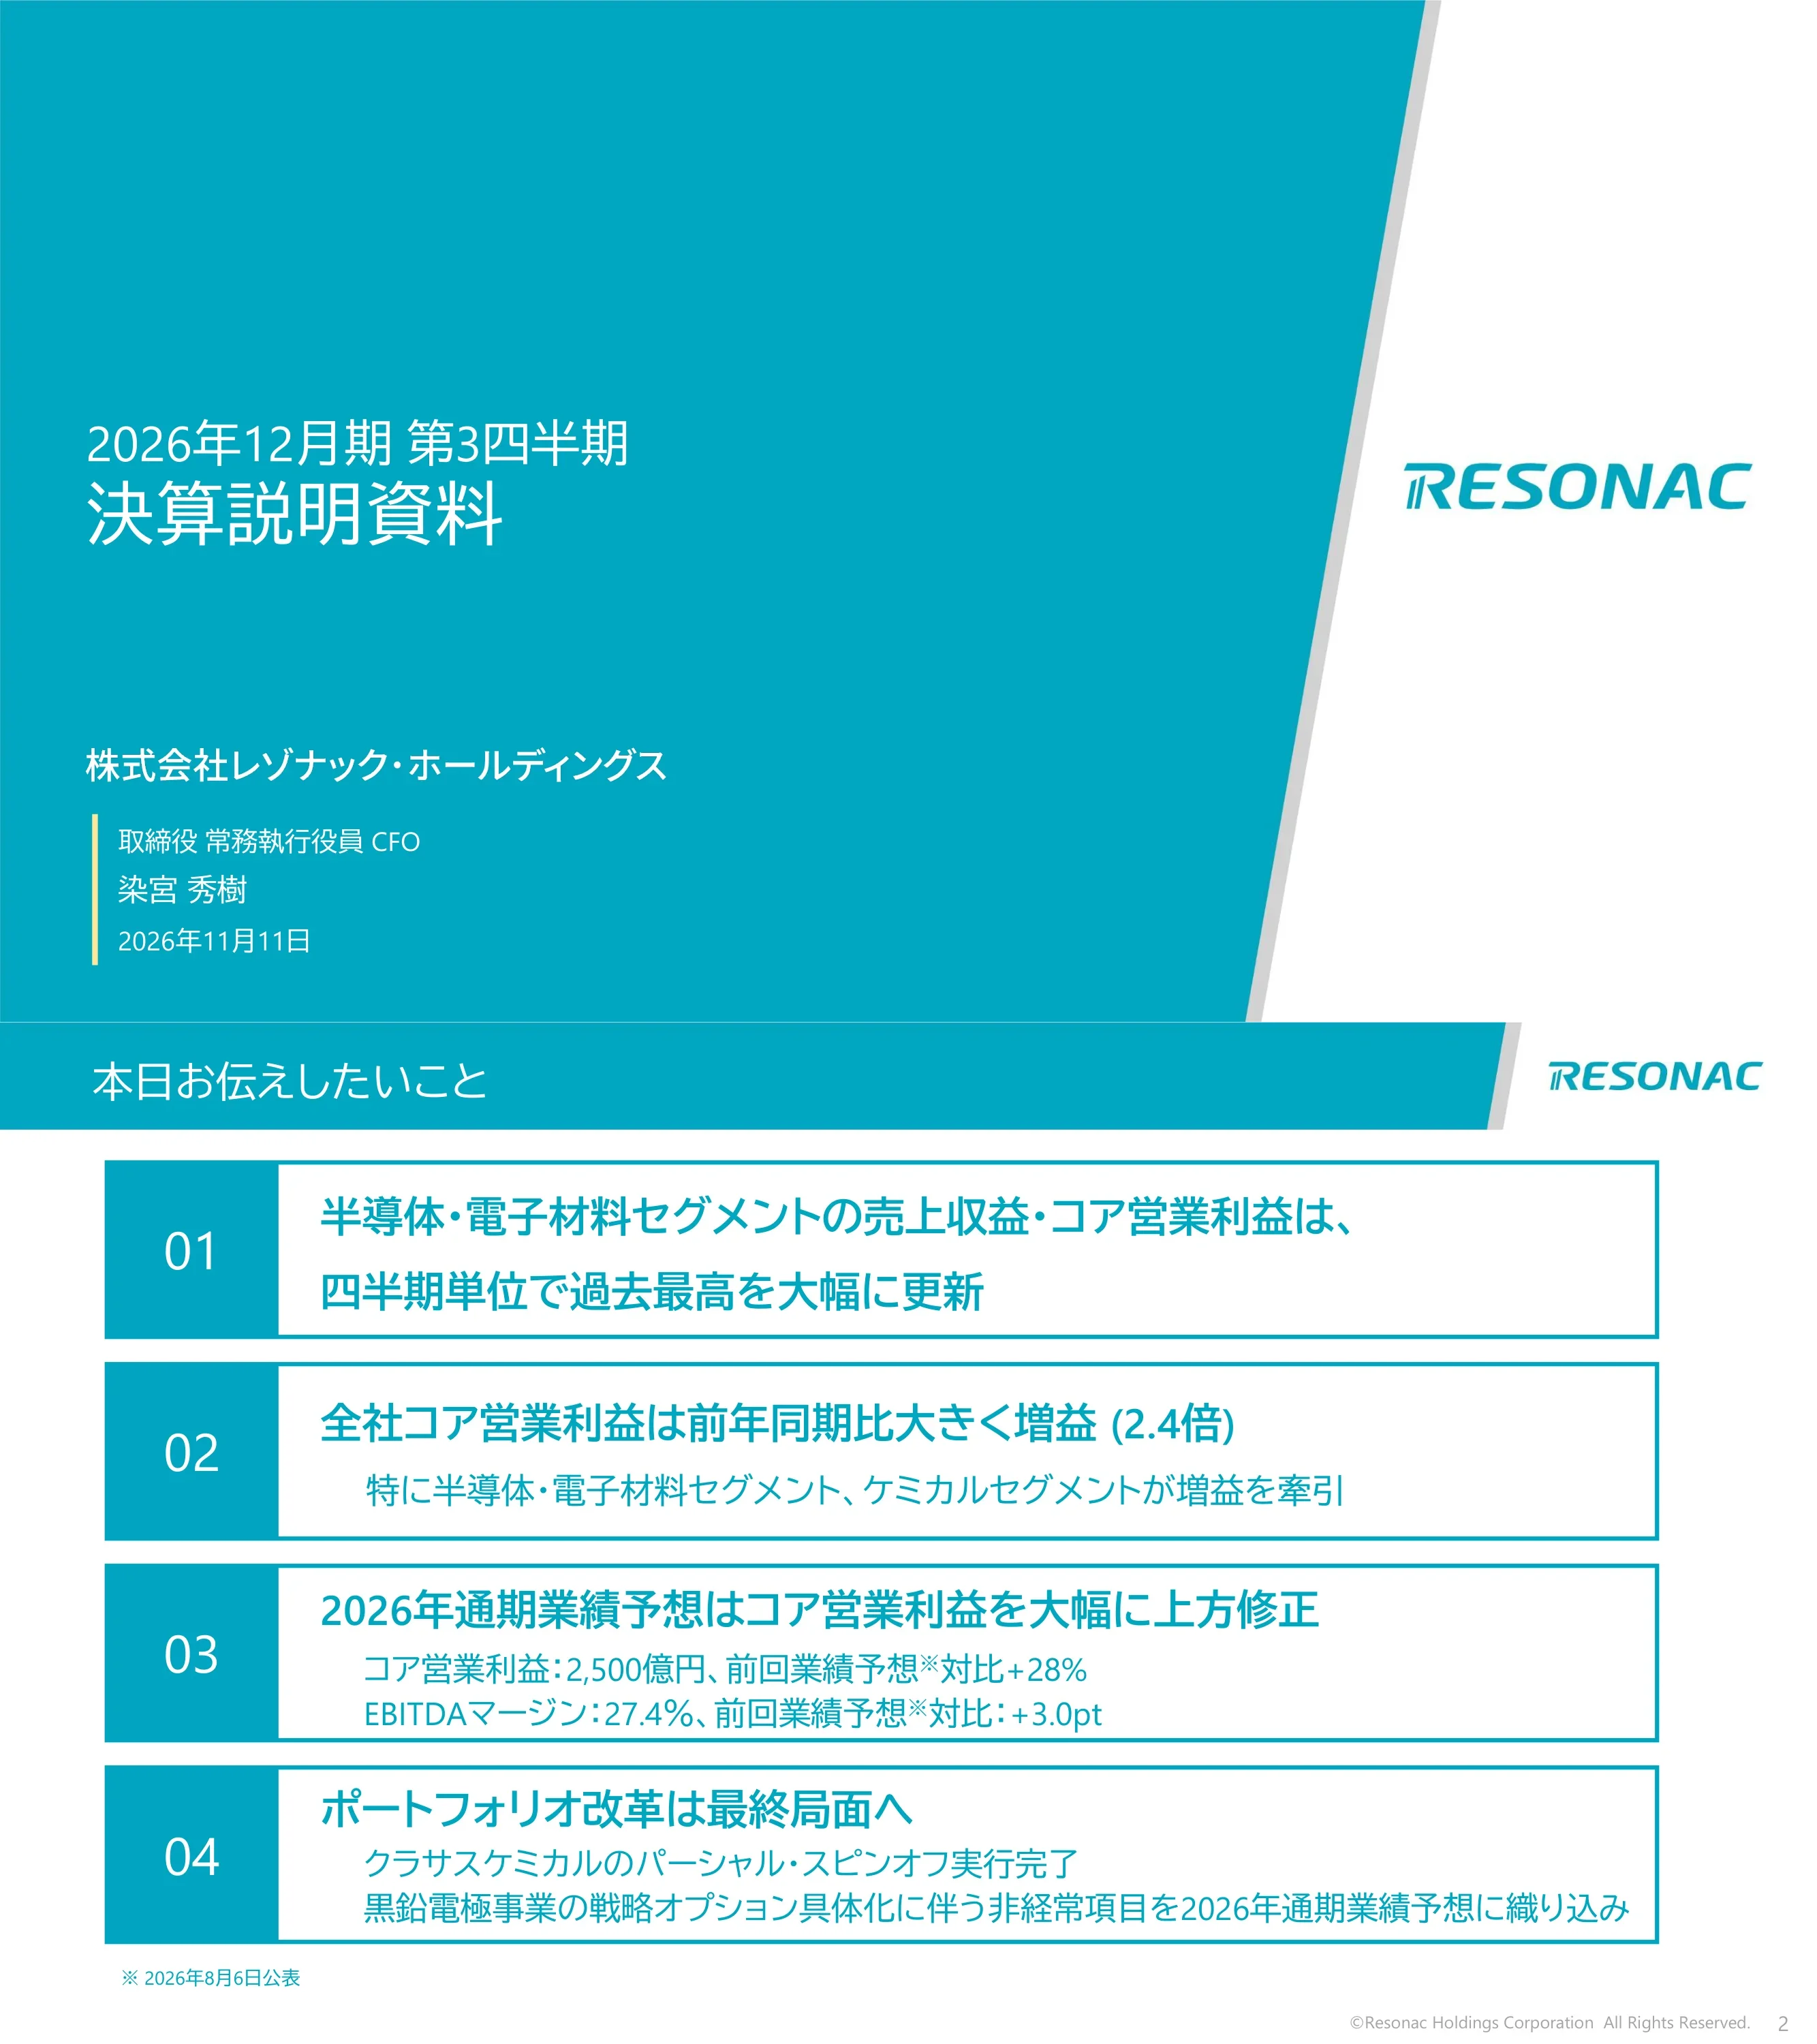
Title slide of Resonac Holdings Corporation's third-quarter results presentation for the fiscal year ending December 2026, dated 11 November 2026. Presenter listed as the Director, Managing Executive Officer and CFO.
Full-bleed teal panel with a diagonal edge on the left carrying title and presenter block; white right side holds the RESONAC logo.
Four messages: (1) Semiconductor & Electronic Materials revenue and core operating profit hit record quarterly highs by a wide margin; (2) company-wide core operating profit is 2.4x the prior-year period, led by Semiconductor & Electronic Materials and Chemicals; (3) full-year 2026 forecast raised, with core operating profit of 2,500 x 100 million yen (+28% vs the 6 August forecast) and EBITDA margin of 27.4% (+3.0pt); (4) portfolio reform enters its final phase, with the partial spin-off of Crasus Chemical (クラサスケミカル, the petrochemicals business) completed and graphite electrode strategic-option charges built into the forecast.
Four numbered boxes stacked vertically, each with a teal number tile and a bold headline plus sub-bullets; footnote notes the previous forecast was published 6 August 2026.
Agenda divider listing two sections: 1. Q3 results for the fiscal year ending December 2026, 2. Full-year 2026 forecast. Section 1 is highlighted and section 2 is greyed out.
Teal diagonal panel with the agenda heading and two numbered items; the active item is white and the inactive one grey.
Headline: revenue grew despite business divestitures, and core operating profit rose on strong semiconductor and electronic materials growth and a smaller graphite loss. January-September 2026 revenue was 8,719 x 100 million yen (+1,084, +14%), core operating profit 1,641 (+946, +136%) and profit attributable to owners of the parent 946 (+886, +1,468%). EBITDA margin was 26.3% vs 17.8% (+8.4pt) and net D/E ratio 0.54x vs 0.83x at end of 2025.
Centered headline over two tables: a year-on-year results table with highlighted current-period column, and a key financial indicators table; footnotes below define the restated base and formulas.
Full IFRS table for January-September 2026 vs 2025 (restated): revenue 8,719 vs 7,635; core operating profit 1,641 vs 695; non-recurring items -158 vs -512; IFRS operating profit 1,484 vs 184; profit before tax 1,445 vs 164; profit from continuing operations 1,043 vs 43; discontinued operations -88 vs +28; profit attributable to owners 946 vs 60; EBITDA 2,290 vs 1,362. Headline notes the partial spin-off of the petrochemicals unit was completed despite a one-off loss in discontinued operations.
Large table on the left with red boxes around core operating profit and net profit changes; definition callouts for core operating profit and pre-tax profit sit on the right with footnotes.
Waterfall from 695 (Jan-Sep 2025) to 1,641 (Jan-Sep 2026): sales volume +597, sales price +251, cost of sales difference -346, FX +106, other +338. Headline says volume in semiconductor and electronic materials drove the gain while higher raw material prices worsened cost differences. The segment table shows Semiconductor & Electronic Materials rising from 740 to 1,586, Mobility 20 to 48, Innovation Materials 81 to 96, Chemicals -74 to 15, and Other/Adjustments -72 to -104.
Waterfall bar chart across the top with teal start/end bars and yellow/grey delta bars; a segment-by-driver table underneath.
Quarterly 2026 actuals for Q1, Q2 and Q3. Semiconductor & Electronic Materials revenue was 1,347 / 1,643 / 2,018 with core operating profit 340 / 475 / 771 and EBITDA margin 34.0% / 36.2% / 44.3%. Total continuing operations revenue was 2,562 / 2,906 / 3,251, core operating profit 342 / 508 / 792 and EBITDA margin 21.6% / 24.9% / 31.2%. Mobility margin eased from 11.2% to 8.1%, while Chemicals improved from 5.0% to 12.2%.
One large table with segments as row groups (revenue, core operating profit, EBITDA margin) and three quarterly columns; the Semiconductor margin row is boxed in red.
Semiconductor & Electronic Materials revenue rose to 5,008 (+1,351, +37%) and core operating profit to 1,586 (+846, +114%). Mobility revenue fell to 1,217 (-8%) but core operating profit rose to 48; Innovation Materials revenue was 753 (+11%) with core operating profit 96. Chemicals revenue was 1,419 (+13%) and core operating profit turned positive at 15 vs -74. EBITDA margins: Semiconductor 38.9% (+9.8pt), Chemicals 9.1% (+6.0pt), total 26.3%.
Two tables side by side: revenue and core operating profit by segment on the left, EBITDA margin by segment on the right; red boxes mark the semiconductor and chemicals highlights.
Demand varied by device and application but grew overall, with volume gains in post-process materials driving a large increase in revenue and profit. Revenue was 5,008 (+37%): pre-process materials 705 (+14%), post-process materials 2,743 (+56%), device solutions 1,047 (+21%), other 513 (+25%). Core operating profit 1,586 (+114%), EBITDA 1,946 and EBITDA margin 38.9%. Commentary cites memory market recovery, AI-related advanced semiconductor volumes, HD media demand from data centers and SiC epitaxial wafers.
Left-hand table with sub-segment breakdown and key profit lines; right-hand panel lists sub-segment trends with upward-arrow icons and short explanations.
Mobility revenue was 1,217 (-104, -8%) with core operating profit 48 (+28, +138%), EBITDA 120 and margin 9.9%; revenue fell due to the April-June divestiture of the automotive molded parts business, but demand from some customers lifted profit. Innovation Materials revenue was 753 (+74, +11%), core operating profit 96 (+15, +18%), EBITDA 140 and margin 18.6%, with steady results despite product-by-product variation.
Two stacked tables, each with a results grid on the left and a text summary cell on the right.
Revenue rose to 1,419 (+160, +13%) mainly on a recovery in graphite volumes, and core operating profit turned positive at 15 vs -74 as structural reform effects emerged. Sub-segments: chemicals 675 (+4%), graphite 703 (+18%), other 41. EBITDA 129 and margin 9.1% (+6.0pt). Commentary says chemicals benefited from price revisions after higher raw material costs, and graphite from volume recovery and cost reductions.
Left-hand results table with sub-segments; right-hand panel with upward arrows and a short explanation for chemicals and graphite.
Non-recurring items improved from -512 to -158 as impairment losses fell from -394 to -9, although a one-time retirement benefit plan revision charge of -95 was booked. Other lines include restructuring gains 2, fixed-asset disposal losses -44 and special retirement allowances -13. Net financial income/expenses was -106 (FX loss -39, net interest -57) and equity-method investment gains were 67, unchanged.
Two tables side by side: breakdown of non-recurring items on the left, financial items and equity-method gains on the right, with total rows shaded.
Total assets were 21,733 at end of September 2026 vs 21,067 at end of 2025; equity totaled 7,921 (+645) with retained earnings up 339 to 3,775 on strong earnings. Interest-bearing debt fell 1,678 to 8,017 and cash was 2,745. Assets held for sale rose to 2,074 and related liabilities to 1,394, reflecting the transfer to distribution-held assets for the partial spin-off.
Assets table on the left and liabilities and equity table on the right, each with change columns and sub-item rows tinted for key lines.
Agenda divider with section 2, the full-year 2026 forecast, highlighted and section 1 greyed out.
Same teal diagonal panel as the first agenda slide with the active item reversed.
Core operating profit forecast raised to 2,500 from 1,960 (+540) on strong semiconductor and electronic materials, while non-recurring items of -1,350 (vs -360) reflect the graphite electrode strategic option. Revenue 12,350 (+700), IFRS operating profit 1,150 (-450), profit attributable to owners 750 (-375), EBITDA 3,384 and EBITDA margin 27.4% (+3.0pt). Highlights: AI-related materials add +670 revenue and +530 core operating profit; graphite losses -990; partial spin-off loss -116 in discontinued operations.
Left-hand table comparing the 6 August forecast, the new forecast and the change, with the core operating profit row boxed in red; right-hand stacked callouts explain the main increases and decreases.
Semiconductor & Electronic Materials is revised sharply upward on AI-related materials: revenue 7,350 (+670) and core operating profit 2,480 (+530), EBITDA margin 40.5% (+3.9pt). Mobility 1,590 revenue / 49 core operating profit, Innovation Materials 1,000 / 126, Chemicals 1,980 / 45, Other and adjustments 430 / -200. Total revenue 12,350 and core operating profit 2,500.
Single table by segment with three rows each (revenue, core operating profit, EBITDA margin) comparing prior forecast, new forecast and change; semiconductor changes are boxed in red.
Quarter-by-quarter 2026 view with actuals for Q1-Q3 and forecast for Q4, first half, second half and full year. Semiconductor & Electronic Materials revenue is 1,347 / 1,643 / 2,018 actual and 2,343 forecast for October-December, with Q4 core operating profit of 894 and full-year 2,480. Total revenue is 5,468 first half and 6,882 second half; total core operating profit is 849 and 1,651, giving 2,500 for the year.
Wide table with seven period columns (Q1, Q2, first half, Q3, Q4, second half, full year) and three metric rows per segment; half-year and full-year columns are shaded.
Full-year P/L split into first-half actual and second-half forecast, giving revenue 12,350 and profit attributable to owners 750. Profitability indicators vs the 6 August forecast: EBITDA 3,384 (+540), EBITDA margin 27.4% (+3.0pt), EPS 404 yen (-202 yen), adjusted EPS 1,131 yen (+331 yen), ROIC 15.0% (+5.2pt). Dividend per share is unchanged at 65 yen.
Left-hand P/L table by period; right-hand tables for profitability indicators and shareholder returns, with footnotes defining EBITDA, adjusted EPS and ROIC.
Section divider introducing the appendix with reference material.
Teal diagonal panel with the word Appendix in white.
Subsidiaries number 94 (-7 vs prior year-end): -3 related to the automotive molded parts divestiture, -2 overseas liquidations, -2 domestic mergers; affiliates number 31 (-2). Average FX rates: 158.5 yen/US$ for January-September 2026 (full-year forecast 158.9; end-September rate 157.4) and 184.1 yen/EUR (forecast 184.5). Domestic naphtha averaged 94,150 yen/kL vs 67,650 a year earlier.
Left text block with a yellow bullet box on subsidiary changes, followed by an assumptions table comparing 2025 and 2026 periods.
Continuing-operations capex for January-September fell to 679 from 864 (-186). Semiconductor & Electronic Materials 399 (-137), Mobility 73, Innovation Materials 37, Chemicals 102 (-32), Other/adjustments 67 (-17).
Single centered table with one row per segment and a shaded total row.
Total depreciation and amortization included in core operating profit was 649 (-18) vs 667, of which PPA amortization was 111 and the rest 538. Semiconductor & Electronic Materials 360 (+37), Mobility 72, Innovation Materials 44, Chemicals 114, Other 59. Including 4 not in core operating profit, total was 653 (-15).
Table with three rows per segment (excluding PPA, PPA amortization, total) and a consolidated block at the bottom.
Quarter-on-quarter comparison: July-September revenue was 3,251 vs 2,906 in April-June (+344); core operating profit 792 vs 508 (+285); IFRS operating profit 780 vs 475; profit from continuing operations 577 vs 306; discontinued operations -114 vs +28; profit attributable to owners 462 vs 332 (+130). EBITDA was 1,013 and EBITDA margin 31.2% (+6.2pt).
Single table with line items down and Q2, Q3 and change columns across; current quarter is tinted.
Restated 2025 quarterly actuals by segment. Total continuing-operations revenue was 2,424 / 2,498 / 2,713 / 2,833 for the four quarters, 10,468 for the year; core operating profit 140 / 214 / 341 / 349, 1,044 for the year; full-year EBITDA margin 18.4%. Semiconductor & Electronic Materials full-year revenue was 5,063 with core operating profit 1,084 and margin 30.2%.
Table mirroring the 2026 quarterly layout, with four quarter columns and a full-year column highlighted.
Explains that under IFRS a business whose sale is decided is classified as discontinued operations and shown separately from continuing operations. Following completion of the partial spin-off of Crasus Chemical, the petrochemicals business (per a 1 October 2026 notice), its revenue and core operating profit are removed from continuing P/L and its result enters as a single line, profit from discontinued operations.
Three bullet points above a before/after diagram: a single P/L box on the left, and on the right a continuing P/L box with an arrow pulling in the discontinued business's profit line, highlighted in red.
From the Q3 2026 results, the unit is consolidated as profit from discontinued operations, applied retroactively to the start of the year and including the comparison year 2025. Q1-Q3 2026 show profit consolidated as one line each; as a reference, Q4 shows no P/L inclusion because shareholding falls below 20%.
Two-row timeline of quarters for 2025 and 2026 with boxes for each quarter, beige bars for retroactive treatment and a dotted reference box for Q4 2026.
Lists main products by segment. Semiconductor & Electronic Materials: pre-process (high-purity gases, CMP slurry), post-process (epoxy molding compounds, die-bonding films, copper-clad laminates, photosensitive films and solder resists, thermal interface materials) and device solutions (HD media, SiC epitaxial wafers). Mobility: resin molded parts, friction materials, powder metallurgy, aluminum functional parts. Innovation Materials: resin materials, functional chemicals, coatings, ceramics. Chemicals: basic chemicals, industrial gases, graphite electrodes, carbon anode materials.
Two-column table with segment names on the left and bold sub-segment labels with product lists on the right.
Links to company news releases: success in developing a 300mm SiC single-crystal substrate (Semiconductor & Electronic Materials); transfer of the adhesives business of Resonac (Japan) and consolidated subsidiaries in Greater China (Innovation Materials); completion of the partial spin-off of the petrochemicals business; and an adjustment to the conversion price of the 2028 euro-yen convertible bonds with stock acquisition rights. A link to the company's news page is provided.
Table of segment and underlined hyperlink topics with a teal news-release banner and URL at the bottom.
Disclaimer stating that forward-looking statements, including forecasts, rely on information available and assumptions on uncertain factors as of the publication date, and that the company has no obligation to update them except as required by law. Factors that may cause actual results to differ include global political and economic conditions, stronger regulation, product demand and market conditions, and exchange rates.
Teal header band with a centered title bar and two plain paragraphs of text on white.
이 슬라이드 및 기본 프레젠테이션 콘텐츠에 대한 일반적인 질문.
It is Resonac Holdings' Q3 FY2026 earnings presentation (決算説明資料), released on TDnet, the Tokyo Stock Exchange timely-disclosure service, on 11 November 2026. The slides are in Japanese; the fiscal year is the calendar year, so the results cover January-September 2026 and the July-September quarter.
For January-September 2026, revenue was 8,719 x 100 million yen (+14%), core operating profit 1,641 (+136%) and profit attributable to owners of the parent 946. EBITDA margin was 26.3% and the net D/E ratio 0.54x.
Full-year 2026 core operating profit is raised to 2,500 x 100 million yen from 1,960 in the 6 August forecast, with revenue of 12,350 and EBITDA margin of 27.4%. Profit attributable to owners is forecast at 750 after large non-recurring items tied to the graphite electrode strategic option.
Semiconductor & Electronic Materials, where January-September revenue was 5,008 (+37%) and core operating profit 1,586 (+114%). Its July-September EBITDA margin was 44.3%, and the slides attribute growth mainly to post-process materials for advanced and AI-related semiconductors.
Tables are in units of 100 million yen (億円), so 8,719 means 871.9 billion yen. Per-share figures such as EPS and the 65 yen dividend are in yen, and a triangle symbol in the original tables marks negative numbers.
It has reference tables on FX and naphtha assumptions, capex, depreciation and amortization, quarter-on-quarter results, 2025 quarterly segment data, main products by segment and linked news topics. It also includes diagrams explaining how the spun-off petrochemicals business is shown as discontinued operations.
Yes. It shows a common Japanese earnings-deck structure: key messages, a section divider agenda, one-line headlines above each table, red boxes on the key numbers, a forecast revision table and a reference appendix. The teal and white palette stays consistent across all 29 slides.

Create Your Own Slides
Turn your ideas into professional presentations in seconds with 2slides AI.
전문 디자인을 참조하고, 스타일을 선택하며, 완벽한 텍스트 렌더링으로 슬라이드를 생성하세요. Nano Banana로 구동—지금 프레젠테이션 만들기를 시작하세요.


