
수록 모음: 투자자 발표자료 사례 · 호주 기업 IR 자료 예시
Predictive Discovery (now trading as PDI Gold Limited, ASX:PDI / TSX:PDI) September 2026 Quarterly Activities Presentation, dated 30 October 2026 and lodged with the ASX. The 16-slide deck reports results for the September 2026 quarter (the calendar quarter from 1 July to 30 September 2026) at the West African gold producer's two operating mines, Kiniero in Guinea and Nampala in Mali, plus progress on the Tier-1 Bankan Gold Project. Headline numbers: 52,865oz gold poured, 66,928oz sold, revenue of US$282.9M at a realised price of US$4,227/oz, Group AISC of US$1,390/oz, cash margin from operations of US$176M, free cash flow of US$128M and cash and bullion of US$405M. All amounts are in US dollars (US$) as written in the deck, and all figures are unaudited.
이 프레젠테이션의 표지를 스타일 참고 자료로 사용해 내 콘텐츠로 슬라이드를 만듭니다. 아래에서 원하는 페이지를 골라 그 레이아웃을 참고로 쓸 수도 있습니다.
빠른 탐색
태그
슬라이드 공유
Predictive Discovery (now trading as PDI Gold Limited, ASX:PDI / TSX:PDI) September 2026 Quarterly Activities Presentation, dated 30 October 2026 and lodged with the ASX. The 16-slide deck reports results for the September 2026 quarter (the calendar quarter from 1 July to 30 September 2026) at the West African gold producer's two operating mines, Kiniero in Guinea and Nampala in Mali, plus progress on the Tier-1 Bankan Gold Project. Headline numbers: 52,865oz gold poured, 66,928oz sold, revenue of US$282.9M at a realised price of US$4,227/oz, Group AISC of US$1,390/oz, cash margin from operations of US$176M, free cash flow of US$128M and cash and bullion of US$405M. All amounts are in US dollars (US$) as written in the deck, and all figures are unaudited.
레이아웃, 주요 콘텐츠 및 시각적 요소를 포함한 각 슬라이드 페이지의 상세 보기.
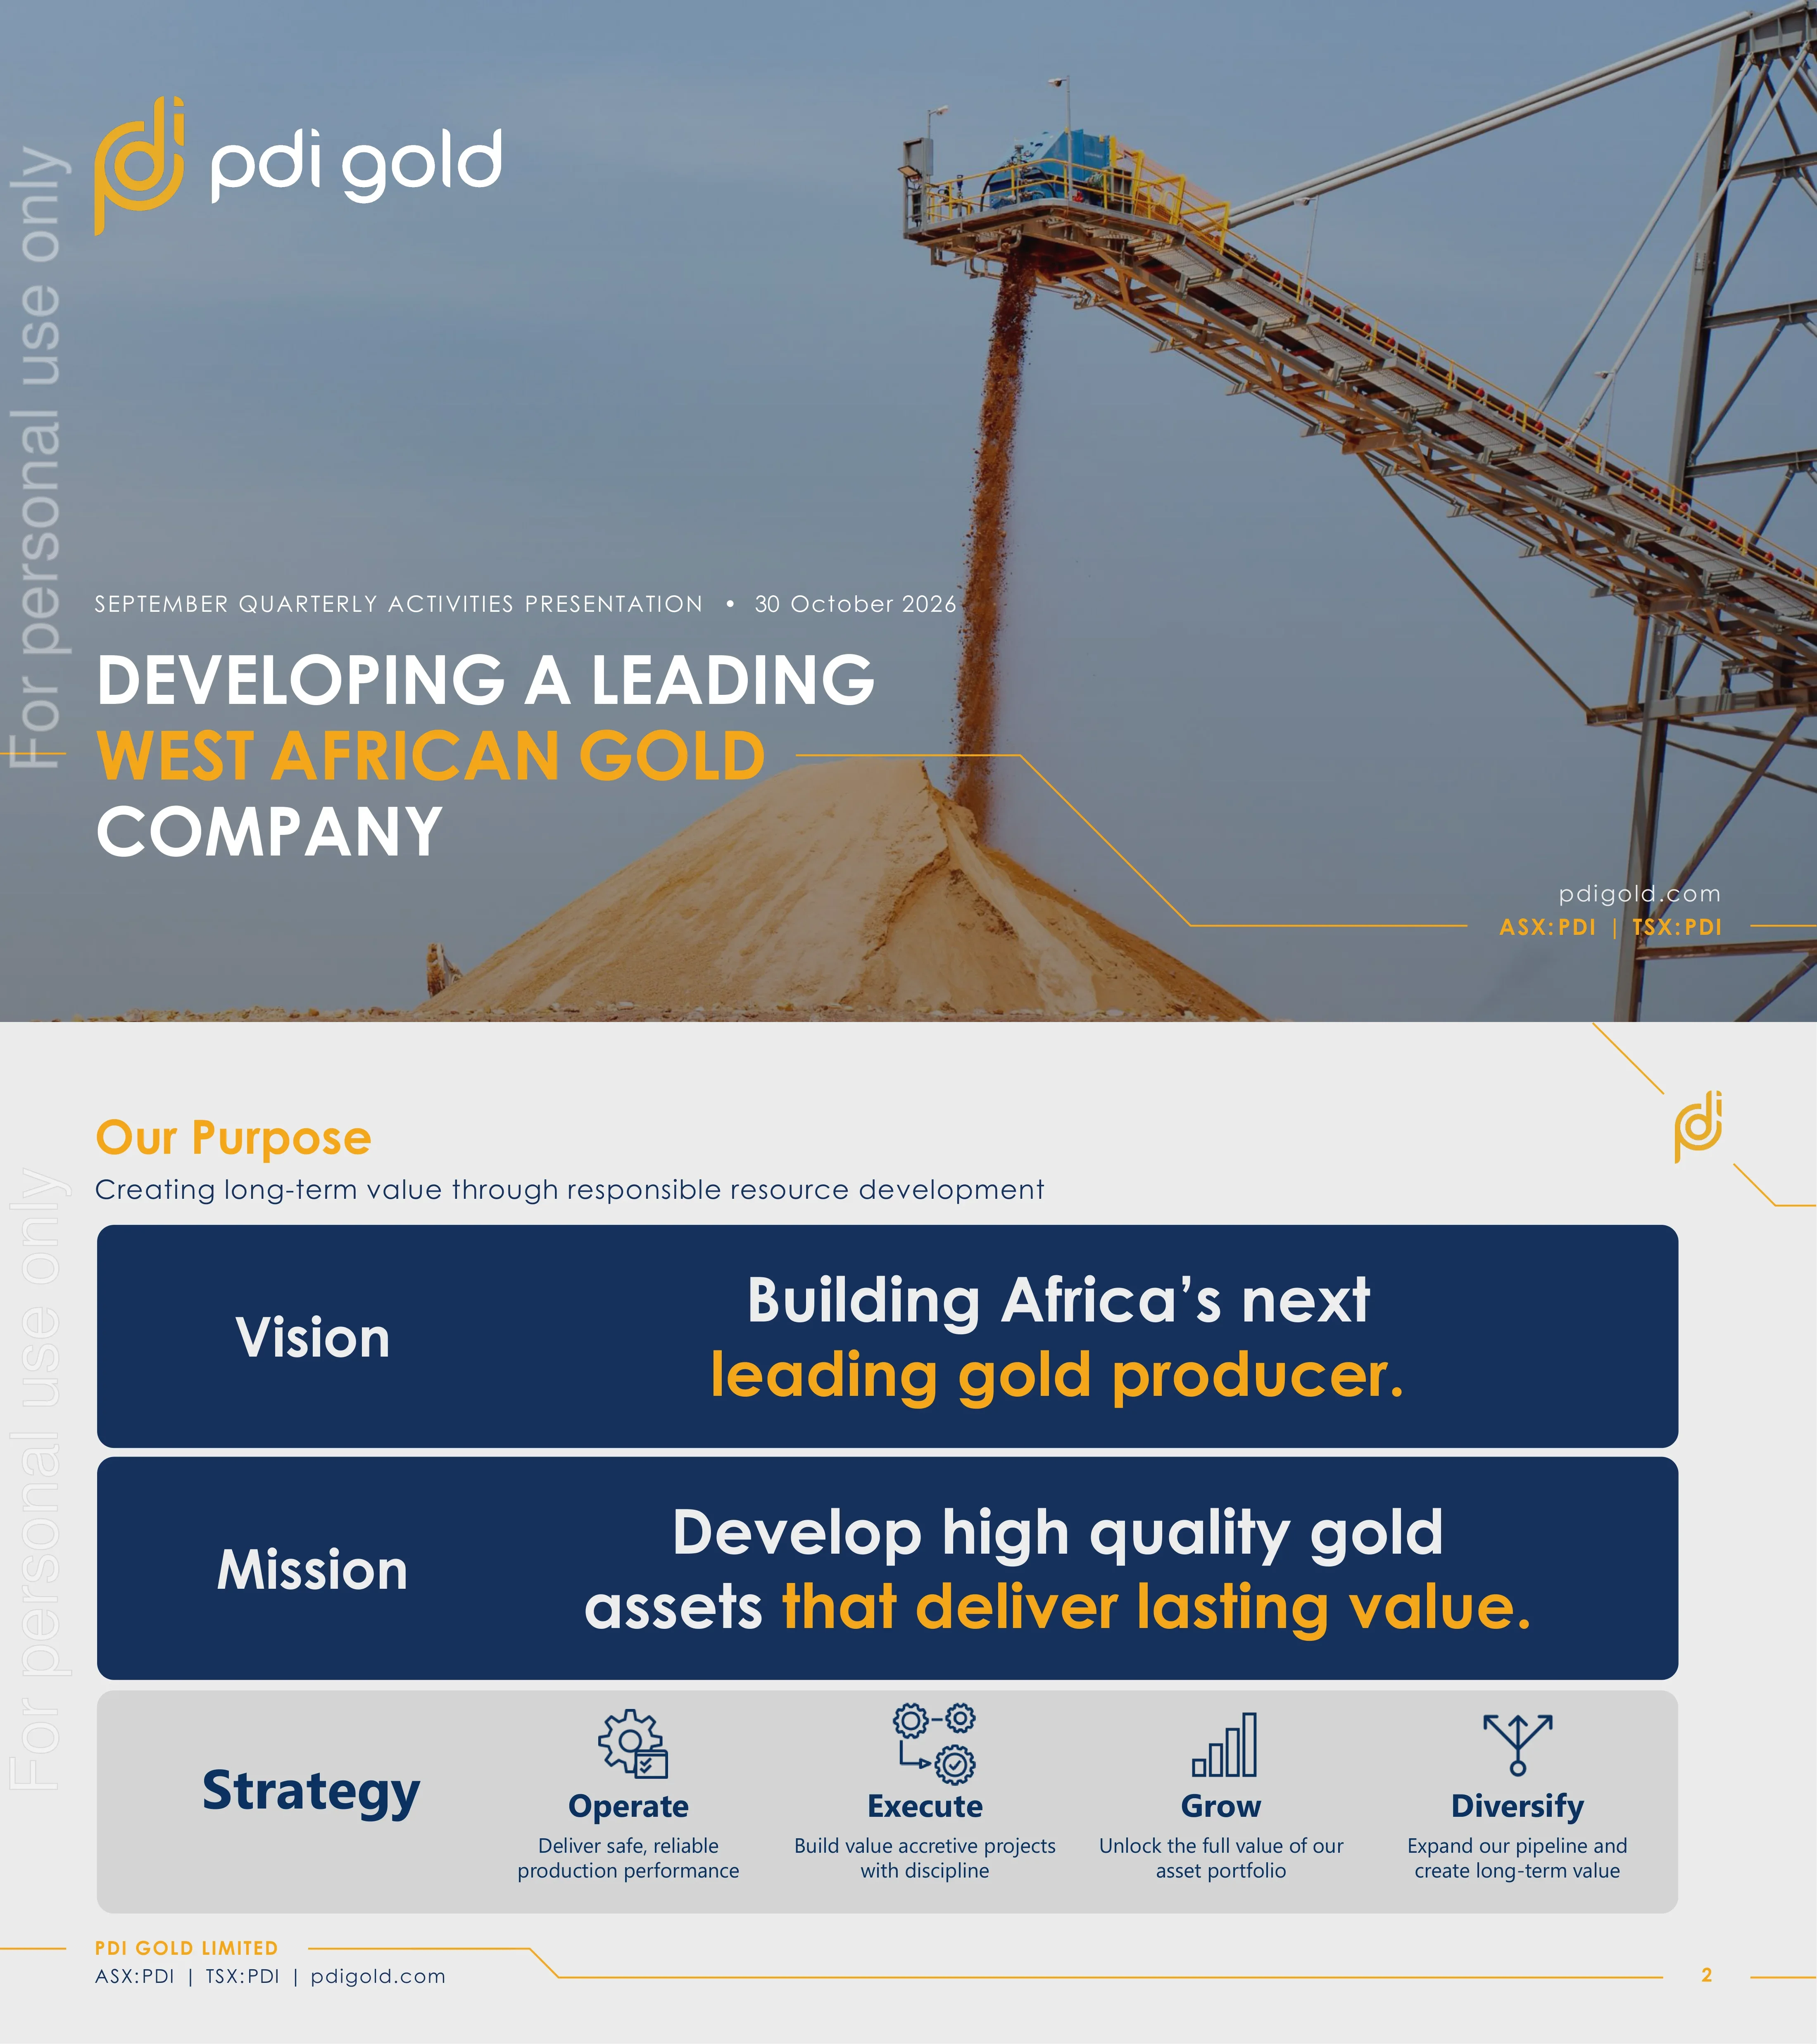
Title slide for the September Quarterly Activities Presentation dated 30 October 2026, with the pdi gold logo, the headline 'Developing a leading West African gold company', the website pdigold.com and dual listing ASX:PDI | TSX:PDI.
Full-bleed photograph with logo top-left, small uppercase subtitle and date line, three-line headline in white and gold-orange lower-left, listing codes bottom-right connected by a thin orange line.
States the company's purpose of creating long-term value through responsible resource development: Vision 'Building Africa's next leading gold producer', Mission 'Develop high quality gold assets that deliver lasting value', and a four-pillar Strategy of Operate (safe, reliable production), Execute (value-accretive projects with discipline), Grow (unlock full value of the portfolio) and Diversify (expand the pipeline).
Two full-width navy banner rows for Vision and Mission with label left and statement right, followed by a light-grey strategy band with four icon columns.
Company snapshot: two producing mines, Kiniero (Guinea) and Nampala (Mali); Tier-1 development project Bankan (Guinea); 2026 guidance of 198-220koz with targeted production of more than 400kozpa by 2029; 10.1Moz Mineral Resources including 4.8Moz Ore Reserves; de-risked funding and construction of Bankan. Map callouts give Bankan at 250kozpa for 12 years, Kiniero at 139kozpa for 9 years with 2026 guidance of 157-174koz, Nampala at 41-46koz for 2026 (extend mine life and/or divest), and an 11.6% stake in Awalé Resources whose Odienne JV hosts 1.7Moz AuEq (Newmont earning 75%). TSX and ASX listings are marked on Canada and Australia.
Six navy KPI pills in a 3x2 grid across the top, with a grey world map below carrying colour-coded asset callout boxes linked by lines to West Africa, plus navy-shaded Canada and Australia for the listings.
Reports safety performance across both mines on a 12-month moving average to 30 September 2026: total recordable injury frequency rate (TRIFR) of 1.99 and lost time injury frequency rate (LTIFR) of 0.11, under the theme of a proactive safety culture protecting people, partners and communities.
Wide rounded photo panel with two semi-transparent navy metric cards overlaid across the middle, each with an orange label, large white number and descriptor.
Six headline numbers for the quarter: 53koz gold poured, revenue of US$283M at a realised price of US$4,227/oz, Group AISC of US$1,390/oz (Kiniero standalone US$1,246/oz), 67koz gold sales, cash and bullion of US$405M, and cash margin from operations of US$176M. Footnotes state all figures are unaudited and that cash and bullion includes US$39.5M of bullion and US$81.5M of restricted cash.
3x2 grid of large rounded tiles alternating navy and light grey, each with an orange uppercase label, oversized figure and short descriptor.
Progress on one of West Africa's largest undeveloped gold projects: process plant detailed engineering about 20% complete with completion targeted for Q2 2027; mechanical equipment procurement substantially complete with US$18M of down payments for the Ball/SAG mills and power station; first mill supply package expected December 2026 and first power station delivery in Q2 2027; power station detailed design awarded; tailings storage facility and water storage dam specifications finalised; concrete, structural steel and platework packages in final evaluation. Bankan will be funded from existing cash reserves and operating cash flow.
Text-heavy left half with orange title, two-line navy subtitle and eight dash bullets; right half holds two stacked rounded photographs.
Summary metrics table: gold poured 52,865oz vs 64,026oz in the June quarter (down 17%, wet season) and 165,068oz YTD CY26; gold sales 66,928oz, up 37%; realised price US$4,227/oz, down 5%; revenue US$282.9M, up 30% (YTD US$701.0M); royalties US$19.6M; AISC US$1,390/oz vs US$1,408/oz; cash and bullion US$404.6M vs US$364.3M. 2026 guidance is maintained: Group 198-220koz at AISC of US$1,300-1,500/oz, Kiniero 157-174koz at US$1,100-1,300/oz and Nampala 41-46koz at US$2,000-2,200/oz.
Left side holds two navy-header data tables (quarterly metrics with a separate YTD CY26 column, and guidance by mine); right column carries bolded-lead dash bullets explaining each line.
Waterfall chart from cash of US$364M (US$274M cash plus bullion) at 30 June 2026 to US$405M (US$365M cash plus bullion) at 30 September 2026: receipts from customers +284, operating cost payments -108, other operating costs -5, capital expenditure -43, other investing -10, financing -18, other financing -5 and FX -4 (US$M). Highlights cash margin from operations of US$176M and free cash flow of US$128M; capex included US$18M of Bankan long-lead down payments, other investing was the US$10M Awalé investment on 29 July, and financing covered US$18M of Sprott facility payments plus US$5M of annual dividends to the Mali Government for Nampala.
Waterfall bar chart across the left two-thirds with shaded bands grouping operating, investing and financing flows and rotated category labels; commentary bullets on the right.
Kiniero revenue rose 51% to US$258.1M as gold sales jumped 59% to 61,149oz while gold poured fell 16% to 45,599oz. Cash operating costs were US$69.3M, sustaining capital US$6.9M and AISC US$1,246/oz (vs US$1,254/oz). Ore mined fell 42% to 1.25Mt and total material mined fell 23% to 3.42Mt with the wet season, while milling rose 3% to 2.28Mt; head grade dropped 20% to 0.69g/t on lower-grade stockpile feed and recovery eased to 88.3% from 90.5%.
Large navy-header table on the left split into Financial Summary and Production Summary sections with Sep-26, Jun-26 and Var % columns; bold-led dash bullets on the right.
Nampala revenue fell 47% to US$24.8M as gold sales dropped 45% to 5,779oz, partly because a 2,712oz shipment slipped into October; gold poured was 7,266oz, down 26%. AISC rose to US$2,914/oz from US$1,974/oz. Total material mined rose 6% to 2.57Mt as waste stripping for cutbacks increased 17% while ore mined fell 43% to 0.26Mt; milling fell 16% to 0.42Mt, head grade fell 11% to 0.63g/t and recovery improved to 87.0% from 86.5%.
Same template as the Kiniero slide: two-section financial and production table on the left, bold-led commentary bullets on the right.
PDI paid US$10M for an 11.6% stake in Awalé Resources (TSXV: ARIC), an emerging gold and copper explorer in Côte d'Ivoire, with anti-dilution and information rights and no impact on Bankan funding. Awalé's 2,346km² Odienne Project lies on the same craton-scale structural trend as Kiniero and Bankan; the Odienne East and West permits are in a JV in which Newmont is earning 75%. The maiden inferred Mineral Resource is 32.4Mt at 1.64g/t AuEq for 1.71Moz AuEq (1,389koz Au and 93kt Cu), from the BBM, Charger and Empire deposits.
Rounded-outline text box with bullets on the left; regional geology map with an inset tenement map on the right; navy-header resource estimate table across the bottom right.
Section divider introducing the appendix (disclaimers and reserve and resource tables).
Full-bleed aerial photograph with logo top-left, large white 'APPENDIX' label lower-left and listing codes bottom-right.
Full legal notice covering forward-looking statements, historical information, summary information, not investment advice, not an offer (including US securities law restrictions), non-IFRS measures such as cash margin and AISC, sources of the Mineral Resource and Ore Reserve estimates and production targets (including the 28 September 2026 resources update and the 25 June 2025 Bankan DFS), JORC Code and CIM definition equivalence, and a general disclaimer. Authorised for release by Matthew Wilcox, CEO and Managing Director.
Dense two-column small-print text under a single orange title, with bold run-in subheadings.
Kiniero Probable Reserves total 55.6Mt at 0.99g/t for 1.77Moz, with Indicated Resources of 80.3Mt at 0.96g/t for 2.47Moz and Inferred Resources of 66.0Mt at 0.85g/t for 1.81Moz, broken down by deposit (SGA, SGD, Jean, Sabali South, Sabali North & Central, Mansounia Central, West Balan, Banfara, stockpiles). Nampala Probable Reserves are 3.7Mt at 0.54g/t for 0.06Moz, Indicated 12.0Mt at 0.67g/t for 0.26Moz and Inferred 1.9Mt at 0.64g/t for 0.04Moz. Estimates are as at 30 June 2026, with cut-off grades given in the footnotes.
Two side-by-side navy-header tables (Kiniero left, Nampala right) grouped by Probable, Indicated and Inferred with grey total rows; footnotes under the Nampala table.
Bankan Probable Ore Reserves total 51.6Mt at 1.78g/t for 2.95Moz, comprising 43.7Mt open pit at 1.39g/t (NEB and BC) and 7.9Mt NEB underground at 3.95g/t for 1.00Moz. Bankan Indicated Mineral Resources are 83.7Mt at 1.54g/t for 4.14Moz and Inferred Resources 19.9Mt at 2.16g/t for 1.38Moz, including 6.8Mt NEB underground at 4.07g/t. Footnotes note PDI intends to appeal the Argo and Bokoro permit revocations affecting the Fouwagbe and Sounsoun deposits.
Two side-by-side navy-header tables (Bankan Ore Reserves left, Bankan Mineral Resources right) split into open pit and underground subtotals, with footnotes beneath the left table.
Closing slide listing investor enquiries (Matthew Wilcox, CEO & Managing Director) and media enquiries (Nathan Ryan, NWR Communications), with the company website and listing codes.
Full-bleed open-pit photograph with logo top-left, 'For further information please contact' heading and two contact columns in orange and white lower-left.
이 슬라이드 및 기본 프레젠테이션 콘텐츠에 대한 일반적인 질문.
It is a 16-slide investor presentation dated 30 October 2026 from Predictive Discovery, which now presents itself as PDI Gold Limited (ASX:PDI, TSX:PDI). It was lodged with the ASX alongside the quarterly activities report and covers September-quarter production, costs and cash flow at the Kiniero and Nampala mines, progress on the Bankan Gold Project, the Awalé Resources investment, and reserve and resource tables.
The company reports on calendar quarters, so the September 2026 quarter runs from 1 July to 30 September 2026. Comparisons are against the June 2026 quarter (April to June), and the 'YTD CY26' column covers January to September of calendar year 2026. Annual guidance is also set for calendar 2026, not an Australian July-June financial year.
All financial figures are in US dollars (US$), as written in the deck, not Australian dollars, even though the company is ASX-listed. Gold quantities are in troy ounces (oz or koz) and tonnages in tonnes or million tonnes (Mt). The deck states that all figures are unaudited.
Gold poured was 52,865oz and gold sold 66,928oz. Revenue was US$282.9M at a realised price of US$4,227/oz, Group AISC was US$1,390/oz, cash margin from operations was US$176M, free cash flow was US$128M, and cash and bullion rose to US$405M at 30 September 2026. Full-year 2026 guidance of 198-220koz at an AISC of US$1,300-1,500/oz was maintained.
At Kiniero, bullion poured in the June 2026 quarter was sold in the September quarter, lifting Kiniero sales 59% to 61,149oz while production fell 16% because of the wet season. That partly offset a 45% drop in Nampala sales, where a 2,712oz shipment slipped into October.
Yes. The gallery page provides the original PDF plus an editable PPTX converted from it. The PPTX is a machine conversion, so check fonts, tables and chart layouts before reusing slides. The KPI tile grid, mine-level data tables, cash flow waterfall and reserve tables work well as templates for mining and resources quarterly reports.
It suits investors and analysts tracking ASX and TSX gold producers, IR teams at mining companies building quarterly activities presentations, and anyone learning how gold miners report gold poured versus sold, AISC, head grade, recovery and JORC reserves. The deck is for information only and is not investment advice.
The presentation and the accompanying quarterly activities report were lodged with the ASX under the code PDI and are available on the ASX announcements platform and the company website, pdigold.com. Canadian disclosure is filed on SEDAR+.
Official company site listed on every slide; investor materials and ASX announcements.
The source document as lodged with the Australian Securities Exchange.

Create Your Own Slides
Turn your ideas into professional presentations in seconds with 2slides AI.
전문 디자인을 참조하고, 스타일을 선택하며, 완벽한 텍스트 렌더링으로 슬라이드를 생성하세요. Nano Banana로 구동—지금 프레젠테이션 만들기를 시작하세요.


