
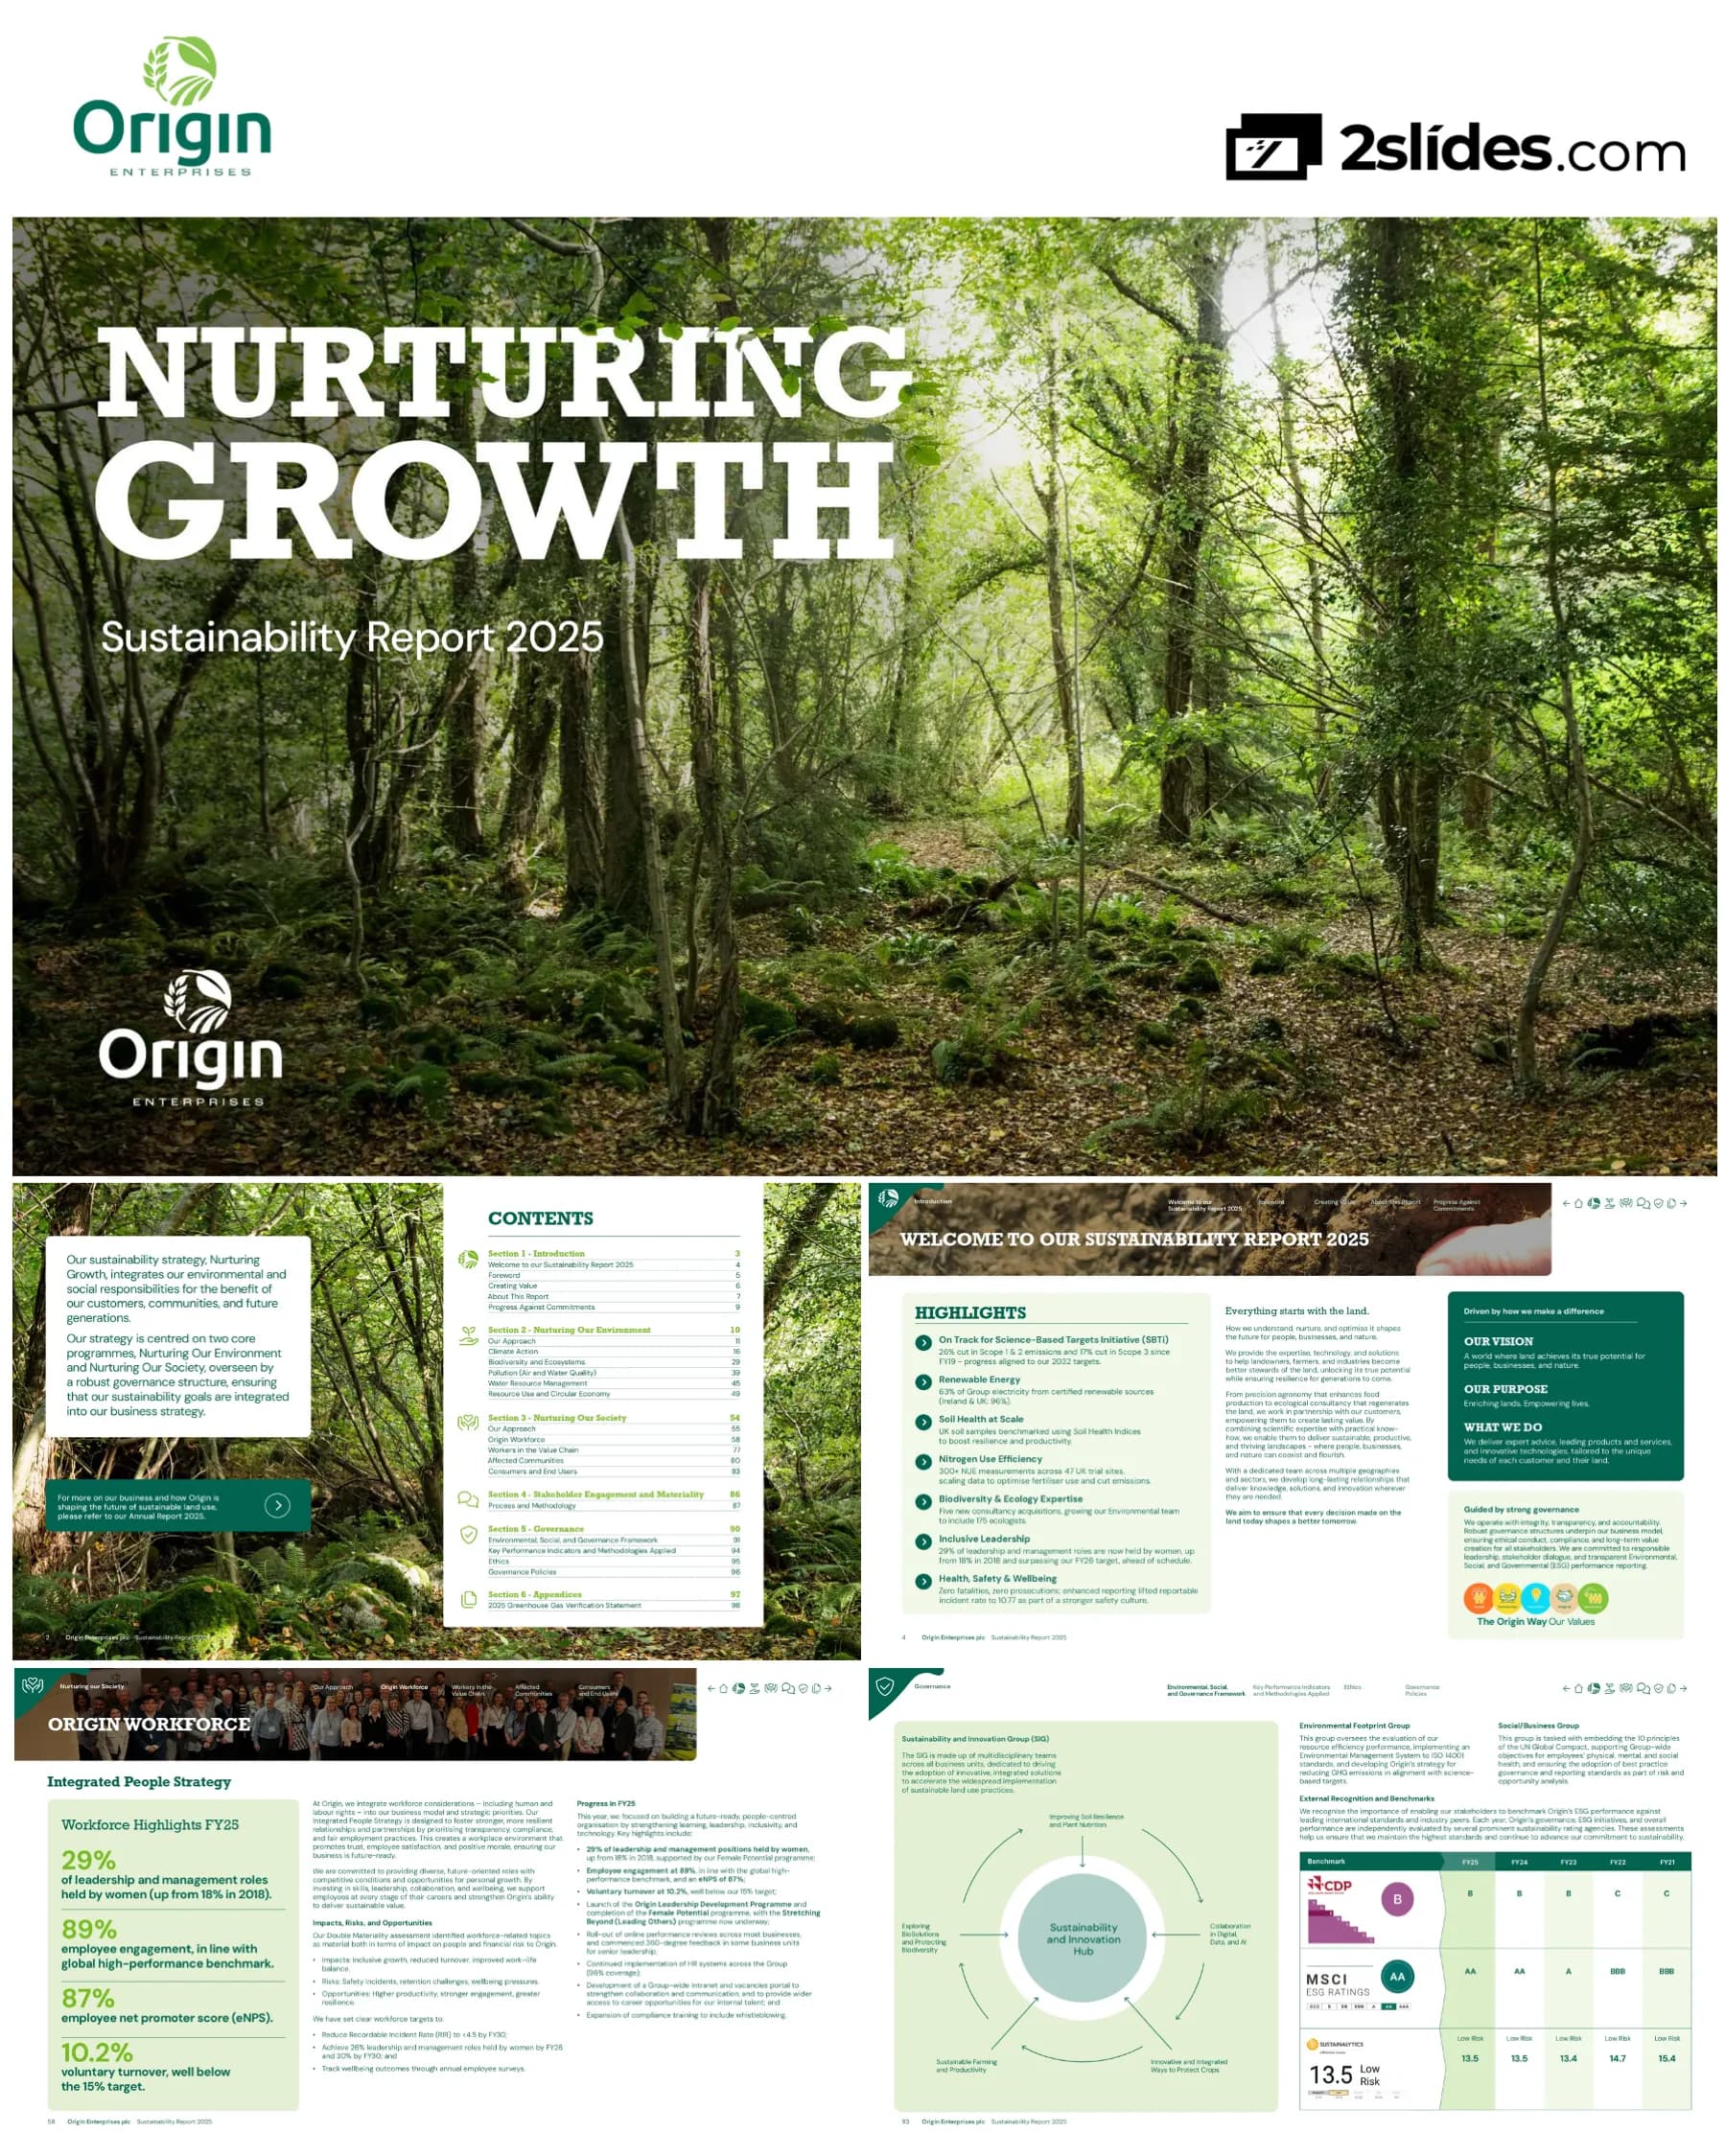
Origin Enterprises Sustainability Report 2025 – 'Nurturing Growth' Strategy
빠른 탐색
태그
슬라이드 공유
Origin Enterprises Sustainability Report 2025 – 'Nurturing Growth' Strategy
레이아웃, 주요 콘텐츠 및 시각적 요소를 포함한 각 슬라이드 페이지의 상세 보기.
Title slide introducing the report: 'Sustainability Report 2025' with the central theme 'Nurturing Growth'. Features the company name 'Origin' and a stylized leaf/growth graphic.
Minimalist, impactful cover. Large central theme text, company logo, and thematic graphic. Dark background with green accent.
Introduces the 'Nurturing Growth' strategy, centered on two core programmes: Nurturing Our Environment and Nurturing Our Society. Provides the full table of contents for the report.
Two-column layout. Left side: strategy explanation. Right side: detailed contents list with page numbers.
Page introducing the 'Introduction' section with a mini-table of contents for that chapter (Welcome, Foreword, Creating Value, etc.).
Simple layout with section title and a list of sub-sections with page references.
Formal welcome to the 2025 report. Features a 'Highlights' section with key FY25 achievements (SBTi progress, renewable energy, soil health, female leadership, safety). Includes company vision, purpose, and description of what they do.
Multi-panel layout. Top: 'Welcome' and 'Highlights' list. Bottom: narrative sections on company philosophy ('Everything starts with the land'), vision, purpose, and governance.
Personal message from CEO Sean Coyle. Discusses pressures on land, climate change impacts, regulatory evolution (CBAM, CSRD), FY25 progress on climate, biodiversity, circularity, and people. Sets tone for responsible growth.
Full-text page with a header image/background. Structured as a letter with a signature block.
Detailed explanation of the two-pillar strategy: 'Nurturing Our Environment' (climate, biodiversity, circular economy) and 'Nurturing Our Society' (workforce, value chain, communities). Emphasizes governance and oversight.
Central graphic showing the two pillars supporting 'Nurturing Growth'. Text blocks describe each pillar and governance.
Explains the report's approach: voluntary reporting since FY21, guided by GRI, informed by ESRS, preparing for CSRD. Covers reporting scope, frameworks (GRI, SDGs), materiality, risk management, and continuous improvement in systems.
Text-heavy page with clear sub-headings and call-out boxes summarizing key points (e.g., 'Voluntary Reporting since FY21').
Details how sustainability priorities are shaped by stakeholder dialogue and Double Materiality assessment. Includes a comprehensive table mapping stakeholder groups, engagement methods, their key concerns, and where these are addressed in the report.
Top: explanatory text on the process. Bottom: large, detailed stakeholder mapping table.
Summary table of FY25 performance on material ESG topics (Climate Change, Energy Efficiency, Sustainable Food Systems, Soil Health, Biodiversity, Human Rights). Shows targets and FY25 performance updates.
Table format with columns for Material Issue, Impacts, Target, and FY25 Performance Update.
Introduces the 'Nurturing Our Environment' section with a roadmap/agenda listing sub-chapters: Our Approach, Climate Action, Biodiversity, Pollution, Water Management, Circular Economy.
Clean list format with page numbers for each sub-topic.
Describes Origin's environmental sustainability vision and integrated land management approach. Mentions alignment with CSRD, ESRS, SBTi, and SDGs. Discusses Gap Analysis and the five key environmental topics identified.
Full-page narrative text with strategic focus.
Covers expanded risk assessment, climate scenario planning, science-based targets, supplier codes. Details key enablers: Environmental Management System (EMS), automated carbon data collection, soil resilience strategy, and agronomist advisory services.
Multi-column/text-block layout. Top banner with section title. Body divided into thematic areas with descriptions.
Focuses on innovation through digital platforms and strategic partnerships. Highlights the 'Living Landscapes' division and a strategic partnership with BioGains for Biodiversity Net Gain (BNG) market.
Combination of narrative text and a highlighted partnership case study.
First part of a detailed roadmap table. Covers material issues: Climate Action/Resilience, Air and Water Quality, and Water Resource Management. For each, shows ESRS theme, impact, risks & opportunities, and near-term actions to 2032.
Multi-column table with color-coded rows for each material issue.
Continuation of the roadmap table, covering Biodiversity and Ecosystems, and Resource Use/Circular Economy. Details targets and actions for these areas up to 2032.
Continuation of the multi-column table format from page 14.
Deep dive into Climate Action. Discusses governance (Board oversight), strategy integration, Climate Transition Plan (CTP), and assessing business model resilience through scenario planning aligned with IPCC/IEA.
Text-based page with structured sub-sections: Governance, Strategy, Climate Transition Plan, Resilience Assessment.
Visual representation of the Climate Transition Plan process, showing stages: Measurement, Targets, Engagement, Innovation, Verification, and Reporting.
Central process diagram (likely circular or linear flow) with icons and labels for each stage.
Analyzes Origin's climate impacts (Scope 3 emissions from products, Scope 1&2 from operations), climate-related risks (transition and physical), and opportunities (growth in low-carbon products, adaptation services).
Balanced layout with text blocks for Impacts, Risks, and Opportunities, each with bullet points.
Presents targets and tracks progress with a KPI table. Includes SBTi commitment, Scope 1, 2, and 3 emissions data from FY19 to FY25 against 2032 targets. Features an explanatory note on methodology improvement.
Top: statement of targets. Main: a large table with rows for each KPI and columns for fiscal years. Bottom: footnote.
Continuation of the KPI table, focusing on Soil Health benchmarking and Nitrogen Use Efficiency (NUE) progress, tracking from FY21 to FY25 against 2030 targets.
Continuation of the table format from page 19, with new rows for soil health and NUE KPIs.
Detailed analysis of Scope 1 & 2 emissions in FY25. Discusses performance (26% reduction vs. FY19), reasons for year-on-year increase, intensity metrics, and alignment with SBTi target. Includes a bar chart visualizing trends.
Mix of explanatory text and a bar chart (Stacked column for Scope 1 & 2 from FY19-FY25). Key statistics are called out.
Focuses on Scope 1 emissions sources, FY25 performance drivers (fleet, manufacturing), data quality improvements, and strategic focus on fleet decarbonization. Includes a case study on 'Electric HGV Deployment' at Agrii UK.
Main text on Scope 1 analysis with a sidebar or breakout box featuring the Electric HGV case study.
Analyzes Scope 2 emissions (market-based vs. location-based), drivers of increased consumption, and progress on renewable electricity sourcing (63% Group-wide). Includes a case study on 'Fortgreen, Brazil' transitioning to 100% renewable energy.
Main text on Scope 2 performance and renewable energy, accompanied by a case study box.
Highlights that Scope 3 dominates Origin's footprint (>99.8%). Shows the 2032 reduction target via a bar chart. Provides a pie chart breaking down Scope 3 sources (Purchased Goods 55%, Use of Sold Products 37%, etc.) and discusses performance trends.
Combination of a target bar chart, a source breakdown pie chart, and explanatory text on trends and data quality.
Details the strategic approach to reducing Scope 3: focus on NUE, enhanced efficiency fertilizers, supplier collaboration, portfolio balancing. Discusses policy impacts (EU CBAM). Features a case study on the 'Contour Grass' digital tool driving reductions.
Strategic narrative text combined with a highlighted digital innovation case study.
Focuses on the NUE target (20% improvement by 2030). Defines NUE, outlines FY25 progress (300+ measurements, glasshouse trials), and presents an 'On-Farm Actions' table linking soil management, nutrition plans, and specific products/services.
Top: target and definition. Middle: progress update. Bottom: a table mapping on-farm actions to Origin's tools/products.
Describes the strategic delivery pathway for NUE (carbon-efficient growth, knowledge transfer, digital enablement). Features an extensive case study on the 'NUE-Leg' project, a DEFRA-backed collaboration to improve NUE in grassland via legumes.
Top: strategic pathway text. Bottom: large, detailed case study box on the NUE-Leg project.
Details the soil health target (benchmarking with Soil Health Indices). Reports FY25 progress: integration into UK agronomy, data insights on nutrient deficiencies/pH, and plans for expansion into Central Europe. Highlights connection to NUE and emissions reduction.
Text-based progress report with key findings called out within the narrative.
Introduces Origin's dual-track biodiversity strategy: 1) Embedding within agricultural systems (IPM, BioSolutions, NUE), and 2) Scaling nature-based solutions through the Living Landscapes division. Aligns with CSRD (ESRS E4) and TNFD.
Full-page narrative outlining the strategy and ambition.
Balanced analysis of material risks (input dependency, policy compliance, reputational, supply chain disruption) and opportunities (agronomic, business growth in Living Landscapes, innovation, access to green finance, investor alignment).
Two-column or two-section layout, one for Risks (with sub-points) and one for Opportunities (with sub-points).
KPI table tracking progress on three biodiversity targets: Fast-tracking BioSolutions, developing Living Landscapes division (>30% op profit by FY26), and creating 1,000 miles of wildlife corridor by 2030. Shows yearly progress from FY21-FY25.
Table format with rows for each KPI and yearly columns showing milestones. Includes 'Innovation Examples' for each KPI.
Explains how Origin works with farmers to embed biodiversity through four pillars: Integrated Pest Management (IPM), BioSolutions, Field-Level Interventions, and the Climate Transition Plan/NUE. Highlights scale (54,000+ farmers).
Text introducing the approach, likely with a graphic suggesting the four interconnected pillars.
Detailed explanation of IPM as a foundational practice. Covers components (cultural, mechanical, biological, chemical controls), its application in agriculture and extension to managed landscapes (sports turf), and role of digital tools and BioSolutions.
Text-heavy page with structured paragraphs explaining IPM concepts and applications.
Describes Origin's evidence-led approach to BioSolutions (biopesticides, biostimulants). Details FY25 activities (85,000+ trial plots, new glasshouse, compatibility protocols). Includes bar charts showing growth in number of BioSolutions under test (2022-2025).
Combination of narrative text and data visualization (bar charts).
Articulates the environmental and agronomic benefits of BioSolutions (lower toxicity, resistance management, plant resilience). Emphasizes Origin's role in bridging innovation and practical application. May include a trial photo.
Text-based page summarizing the value proposition of BioSolutions.
Describes practical on-farm biodiversity actions Origin supports: wildflower margins, hedge rows, wetland creation. Discusses aligning biodiversity with farm economics via funding schemes (e.g., Countryside Stewardship) and environmental markets (BNG). Covers measurement approaches.
Text describing interventions, economic alignment, and measurement.
Highlights the Living Landscapes division's role in delivering biodiversity services (ecology, habitat creation) and products (trees, seed). Reports FY25 operating profit contribution (18.4%). Details expansion via five ecological consultancy acquisitions and the strategic partnership with BioGains (BNG).
Text on division structure and performance, with a highlighted 'Strategic Partnership' box on BioGains.
Showcases two specific initiatives: 1) The 1,000-mile wildlife corridor project (piloting at Throws Farm), and 2) A pilot Biodiversity Action Plan (BAP) at the Alconbury Hill logistics site as a blueprint for Group-wide action.
Likely uses two panels or sections to describe each initiative separately.
Introduces Origin's approach to managing pollution risks through site assessments (COMAH), recognizing dual materiality (environmental/financial), and addressing impacts from operations and products.
Brief introductory page setting the stage for the pollution topic.
Details specific impacts and risks: microplastics, nutrient enrichment of water, air pollution from N2O and PPPs. Lists opportunities through targeted nutrient delivery, BioSolutions, R&D for biodegradable alternatives, sprayer training, and microplastics phase-out.
Structured with 'Impacts and Risks' and 'Opportunities' sections, each with sub-points.
KPI table tracking progress on pollution-related targets: eliminating microplastics (roadmap by FY28, seed treatments by 2030), training spray operators (75% in CE by 2030), and ensuring SVHC compliance.
Table with rows for each KPI and columns for FY22-FY25 and 2030 target.
Describes Origin's agronomy-led approach to protecting water quality through IPM, precision agriculture, nature-based buffers (vegetation strips), catchment-sensitive initiatives, and farmer training.
Text-based page outlining the comprehensive approach.
Focuses on reducing pollution via precise spraying. Discusses Origin's large contract spraying fleet, operator training programmes in UK, Romania, Poland, and the use of adjuvants. Includes a specific case study on improving spray practices in Romania.
General approach description plus a focused case study box on Romania.
Details actions to phase out microplastics from seed treatments and fertiliser coatings. Discusses transition to biodegradable alternatives, progress in Romania and UK, alignment with EU regulations (REACH, FPR), and integration with broader water strategy.
Text on Group-wide approach plus a specific case study box on 'Phasing Out Microplastics in Seed Treatments in Romania'.
Introduces water as a fundamental resource. Outlines the three-dimensional stewardship approach: Direct Operations, Value Chain (advice/products), and Ecosystems (partnerships). Mentions governance and use of WWF Water Risk Filter.
Text page explaining the management approach and governance.
Analyzes water impacts across operations and customer base. Provides regional context for key geographies (Ireland/UK, Continental Europe, Latin America). Discusses risks (physical scarcity, regulation) and opportunities (water-efficient solutions). Notes marine resources as non-material.
Combination of regional analysis and a summary of risks/opportunities.
Presents water targets (20% reduction by 2032, spray operator training). KPI table tracks spray training and water usage. Explains FY25 baseline establishment and data quality (94% actual measurement). Discusses operational drivers.
Target statement, KPI table, and explanatory text on data and drivers.
Summarizes progress to date (data quality, target setting). Details how Origin supports customers with water efficiency: digital irrigation, training, innovative inputs (controlled-release fertilisers), and resilient landscape solutions. Features a case study on adjuvants.
Progress summary followed by a 'Supporting Customers' section with sub-points and a case study on adjuvants.
Introduces circular economy as material to value creation and risk management. Outlines governance structure (business unit responsibility, Group Sustainability coordination, Board oversight).
Brief introductory page on approach and governance.
Identifies material impacts (packaging, manufacturing waste, landscaping products). Analyzes risks (operational constraints, regulatory change, integration of acquisitions) and opportunities (product innovation, cost reduction, customer value, data capability).
Structured with 'Impacts', 'Risks', and 'Opportunities' sections, each with bullet points.
Presents updated 2028 targets (landfill diversion, recycling programmes, recycled packaging content). KPI table tracks waste to landfill and recycled content. Discusses challenges in achieving zero landfill and FY25 waste/recycling data.
Target statement, KPI table with historical and target data, and explanatory text on challenges and progress.
Details operational progress in UK/Ireland and Rest of World (e.g., Brazil's reverse logistics). Outlines sustainable packaging initiatives across regions (UK Green Tractor Scheme, Ireland's Repak, Brazil's Eureciclo partnership). Briefly covers responsible timber use.
Regional breakdown of operational and packaging initiatives, likely with sub-headers for each region.
Presents a graphical roadmap for embedding circularity, structured around three levers: 1) Product Design & Packaging, 2) Operational Efficiency, 3) Customer Solutions. Includes a specific case study on 'Brazil: Reverse Logistics with Eureciclo'.
Graphic showing the three-lever roadmap, accompanied by a detailed case study box.
Introduces the 'Nurturing Our Society' section with a roadmap/agenda listing sub-chapters: Our Approach, Origin Workforce, Workers in Value Chain, Affected Communities, Consumers/End Users.
Clean list format with page numbers for each sub-topic.
Explains the social responsibility approach, structured around the four ESRS Social categories (S1-S4). Lists key priorities: Inclusive Growth, Human Rights, Community Wellbeing, Future Generations. Describes impact/risk assessment process.
Text page outlining the framework, priorities, and assessment methodology.
Details the strengthened 2025 social strategy. Covers governance and oversight (Board, ESG Committee, Head of Sustainability, Chief People Officer, etc.), performance-driven culture, alignment with global standards (UN SDGs), and guiding policies.
Comprehensive text on governance roles, performance metrics, standards alignment, and policies.
Presents a roadmap matrix for social topics (Protecting Human Rights, Health & Safety, Fair & Inclusive Work Environment, etc.). For each, outlines Impacts, Risks & Opportunities, and the Strategic Response.
Table or matrix format with rows for each material social issue and columns for Impacts, Risks/Opportunities, and Response.
Highlights workforce statistics (29% female leadership, 89% engagement, 10.2% voluntary turnover). Introduces the Integrated People Strategy, its six pillars, and FY25 progress highlights (leadership programmes, HR systems, intranet).
Top: key stat highlights. Middle: strategy introduction. Bottom: list of six workforce pillars.
Details the six pillars of the People Strategy: Social Dialogue (Let's Talk), Learning & Skills, Health & Safety, Equality/Diversity/Inclusion, Community Action, and Working Conditions. Mentions continuous improvement and a leadership conference in Lisbon.
Likely uses icons or graphics to represent the six pillars, with brief descriptions for each.
Dashboard-style table summarizing key workforce KPIs, their targets, and FY25 status. Covers female leadership, diversity data capture, inclusion index, engagement, training scores, and voluntary turnover.
Table with columns for Ambition, KPI, Target, and Status (FY25).
Presents detailed FY25 workforce demographics in table format: total employees, gender split, age distribution, regional breakdown, new starters, turnover rates, and flexible working eligibility.
Multi-row data table with demographic categories.
Describes the 'Let's Talk' engagement programme, its goals (connect, engage, dialogue), and how it integrates new acquisitions. Includes a KPI table tracking survey response rate, engagement index, and eNPS from FY21-FY25. Features a case study on Agrii Polska improving communication.
Description of programme, data table, and a case study box.
Summarizes the FY25 Group Employee Engagement survey methodology (2,243 employees, 74% response rate, 13 categories). Highlights overall strengths (working relationships, team spirit, management support, flexibility) and highest-scoring questions.
Summary text with key data points and a list of strengths/highlights.
Presents data visualization of survey results: a line chart showing year-on-year engagement scores (FY19-FY25) and bar charts comparing Origin's scores to external benchmarks (Global High-Performance norm, Agriculture norm).
Primarily chart-based page with explanatory captions.
Outlines the ambition and approach to learning. Highlights FY25 initiatives (Group Leadership Development Programme, performance reviews). Includes a detailed table of training statistics by gender, region, and function (participants, hours). Lists local programme highlights.
Text on strategy, a large data table, and bullet points of key achievements.
Spotlights three specific learning and development initiatives: Agrii UK's 'Culture Shift' resilience programme, developing the next generation of agronomists (BASIS qualifications), and a mentoring programme in Agrii Romania.
Three distinct case study boxes or sections, each describing a different initiative.
Focuses on management development. Shows improvement in employee survey scores related to managers (developing abilities, teamwork, feedback). Details the Group Leadership Development Programme (GLDP) and related training metrics.
Comparison of survey scores (FY24 vs FY25), description of GLDP, and training metrics.
Introduces the HSW strategy ('Protecting our people. Protecting our business. Protecting our future.'). Outlines governance (Board, Audit & Risk Committee, Group Head of H&S). Presents a KPI table with safety metrics (RIR, LTIR, etc.) from FY21-FY25.
Strategy and governance text, followed by a comprehensive KPI table.
Covers product safety & compliance framework (Seveso, BASIS, FIAS). Discusses continuous improvement and collaboration. Analyzes safety performance: no fatalities, increased reportable incidents (contextualized), lost time injuries, and high-potential incidents (with a pie chart of causes).
Text on product safety and performance analysis, including charts for LTIs and incident causes.
Lists FY25 H&S achievements (Driving Standards, forklift rules, improvement plans, EcoOnline rollout). Visualizes the increase in safety observations/near-miss reports. Includes case studies on Fortgreen's reduction in musculoskeletal absences and internal audit score improvements.
List of achievements, a bar chart on reporting culture, and two smaller case study boxes.
Details the wellbeing strategy across mental, physical, social, and financial dimensions. Presents a KPI table with FY25 baseline wellbeing metrics from the survey (Wellbeing Index 83%, etc.). Highlights survey results on work-life balance, resources, and leadership interest.
Description of focus areas, a KPI table, and highlighted survey results.
Discusses the importance of work-life balance and flexible working (available to 49%). Notes employee volunteering through Community Action Days (50 in FY25) and its contribution to wellbeing.
Brief text on working conditions and employee volunteering.
Outlines Origin's D&I commitment, governance, and targets (30% female leadership by 2030). Presents a KPI table tracking D&I index, gender balance, board membership, and new training completion metrics for FY25.
Approach and governance text, followed by a D&I KPI table.
Summarizes FY25 D&I performance: stable 84% index, 89% feel accepting environment, 29% women in leadership. Lists D&I initiatives (training completion, gender pay gap reporting). Outlines strategic priorities for 2024-2026.
Performance snapshot, list of initiatives, and future strategic priorities.
Spotlights specific D&I initiatives: the launch of a Neurodiversity Hub and Cafe, engagement with the Young Farmers' Club to explore inclusivity, and the addition of whistleblowing to mandatory compliance training.
Three distinct sections or boxes, each describing a different initiative.
Summarizes the overall impacts (high engagement, leadership diversity, wellbeing), risks (safety incidents, retention, integration challenges), and opportunities (leadership pipeline, innovation, resilience, employer brand) related to the workforce.
Structured with clear 'Impacts', 'Risks', and 'Opportunities' sections using bullet points.
Defines direct vs. indirect workers in the value chain. Details FY25 progress: issuing Supplier Code of Conduct, initiating human rights 'hotspotting' exercise, laying groundwork for due diligence. Presents a KPI table on Code compliance and engagement.
Definition, progress update, and a small KPI table with roadmap.
Outlines three key focus areas: 1) Human Rights & Ethical Standards (via Code of Conduct), 2) Supplier Engagement & Capacity-Building, and 3) Industry Collaboration.
Simple list or three text blocks describing each focus area.
Analyzes the impacts (promoting rights, raising standards), risks (supplier non-compliance, hidden labour risks, climate pressures), and opportunities (strengthening resilience through monitoring, technology, collaboration) in the value chain.
Three-section analysis (Impacts, Risks, Opportunities) with bullet points.
States Origin's commitment to community impact. Presents a vision focused on resilient food systems, sustainable agronomy, food security, environmental stewardship, and the nature economy. Includes a KPI table tracking engagement, investment, food security, and stewardship.
Vision statement and a KPI table with FY24, FY25, and 2030 roadmap columns.
Details three key areas: 1) Addressing Environmental Impacts, 2) Supporting Local Communities via dialogue, 3) Supporting Farmers' Mental Health and Wellbeing. Features a case study on Farmer Wellbeing Partnerships (FSF & FCN).
Three focus areas described, with an expanded case study on wellbeing partnerships.
Summarizes positive impacts (sustainable agronomy, mental health support, biodiversity). Lists risks (local environmental impacts, climate adaptation failure, engagement gaps, logistical challenges). Highlights opportunities through partnership and scaling programmes.
Three-section analysis (Impacts, Risks, Opportunities) with bullet points.
Defines the consumer/end-user base (farmers, food processors, urban planners, contractors, public). Describes how Origin integrates responsible practices (trials, digital platforms, ecological services). Presents a roadmap table of targets and FY25 progress across quality, sustainability, affordability, and compliance.
Definition of users, description of practices, and a roadmap/progress table.
Presents two case studies: 1) 'Linking Farm Practice with Consumer Confidence' on the Bunge sustainable grain programme with premiums and digital data. 2) 'Living Landscapes – Supporting Biodiversity and Community Wellbeing' on partnerships with authorities for habitat creation and ecological services.
Two distinct case study sections, each with a descriptive title and details.
Summarizes impacts (quality products, sustainable solutions, affordability). Lists risks (regulatory non-compliance, input costs, weak communication). Highlights opportunities to scale sustainable programmes, leverage digital platforms, expand partnerships, and innovate.
Three-section analysis (Impacts, Risks, Opportunities) with bullet points.
Minimalist page introducing the 'Stakeholder Engagement and Materiality' chapter with page references for 'Process and Methodology' and 'FY25 Stakeholder Engagement'.
Simple title page with page number references.
Details the governance, stakeholder mapping, engagement channels, Double Materiality methodology (2023 assessment, 2024 ESRS Gap Analysis), and the resulting 2025 materiality themes (farmer resilience, pollution, human rights, climate/biodiversity).
Structured text with sub-headers for each component of the process.
Explains how engagement informs strategic actions. Features the 'Origin Materiality Matrix' – a quadrant chart plotting topics by their impact on people/environment and financial impact. High-priority topics (upper right) guide the report.
Text on strategic response and a central visual of the Materiality Matrix chart.
Presents a detailed, multi-column table summarizing engagement with each key stakeholder group (Employees, Customers, Policymakers, etc.). For each, describes 'Our Stakeholders', 'Our Approach', and 'Engagement in FY25'.
Large table with rows for each stakeholder group and three descriptive columns.
Introduces the 'Governance' section with a list of sub-chapters: Environmental, Social, and Governance Framework; KPIs and Methodologies; Ethics; Governance Policies.
Simple list format with page numbers.
Details the ESG governance structure: ultimate Board responsibility, empowered ESG Committee (members listed), their duties. Describes Executive Director roles (CEO, CFO) and links executive compensation to sustainability.
Text on governance bodies, their roles, and executive accountability.
Explains that sustainability responsibility now rests with the Central Executive, supported by three sub-committees: Sustainability and Innovation, Environmental Footprint, and Social/Business. Includes an organizational chart graphic.
Text description and a visual governance chart showing the structure from Board down to sub-committees and business units.
Describes the focus of the three sub-committees (SIG, Environmental Footprint, Social/Business). Presents a table of external ESG ratings/benchmarks (CDP, MSCI, Sustainalytics, ISS) showing improvement from FY21-FY25.
Description of sub-committees and a table of external ratings.
Explains Board oversight of KPIs. Provides a table with examples of Environmental KPIs (GHG Emissions, Renewable Energy, NUE) and Social KPIs (Health & Safety, Diversity), alongside their calculation methodologies. Notes independent assurance of emissions.
Text on KPI oversight and a two-column table pairing example KPIs with their methodologies.
States Origin's commitment to the highest ethical standards, guided by the UN Universal Declaration of Human Rights, UN Global Compact, UN Guiding Principles, and ILO Declaration. Links the Code of Conduct to the company's five core values, with 'integrity' at the center.
Text on ethical commitment and a graphic showcasing the five core values ('The Origin Way').
Summarizes key governance policies: Anti-Bribery, People (inclusive environment), Human Rights & Labour, Wages, Non-Discrimination, Freedom of Association, Data Protection, Community Relations. Also details the Supplier Code of Conduct expectations and the 'Confide' whistleblowing service.
List or brief descriptions of each internal policy, followed by a section on the Supplier Code of Conduct.
Title page for the Appendices section, indicating the content within (2025 Greenhouse Gas Verification Statement).
Simple title page.
Presents the independent assurance statement from Goodbody Clearstream for Scope 1, 2, & 3 emissions. Includes verification details (period, standards, level of assurance) and a detailed table breaking down verified emissions by scope and category.
Formal assurance statement text and a comprehensive data table with emission figures.
Final page with company logo, address, contact information (phone, fax), registration details, and website.
Clean back cover with essential contact and legal information.
이 슬라이드 및 기본 프레젠테이션 콘텐츠에 대한 일반적인 질문.
This template is uniquely tailored for sectors at the intersection of agriculture, environment, and community. It includes dedicated deep-dive sections on critical agri-ESG topics like Nitrogen Use Efficiency (NUE), soil health, Integrated Pest Management (IPM), BioSolutions, and water stewardship in an agricultural context. The 'Living Landscapes' business model example is also highly relevant for companies involved in environmental services, ecology, and biodiversity net gain.
The report explicitly structures its content around ESRS themes (E1-E5 for environment, S1-S4 for social) and details a Double Materiality assessment process. It demonstrates how to disclose governance, strategy, impacts, risks & opportunities, and metrics in line with these standards. The template shows practical application, from gap analysis to defining material topics (like pollution from microplastics) and setting corresponding KPIs, providing a roadmap for CSRD readiness.
Absolutely. While Origin showcases its validated SBTi targets, the template provides an excellent framework for presenting any climate or environmental targets. It demonstrates how to structure a Climate Transition Plan, report Scope 1, 2, and 3 emissions with methodological notes, and track progress over time. You can adapt the sections to feature your own carbon reduction goals, energy efficiency programmes, or renewable energy sourcing strategies.
The template dedicates a full chapter to this crucial process. It provides a clear methodology summary, a visual Materiality Matrix (quadrant chart) to plot priority topics, and a highly detailed stakeholder table. This table maps each stakeholder group (employees, customers, investors, etc.) to their key concerns, engagement methods, and where these are addressed in the report, offering a transparent and structured approach that builds credibility.
The template uses a consistent and sophisticated visual identity with a nature-inspired color palette. It effectively blends narrative text with data visualization: bar charts for emissions, pie charts for Scope 3 breakdown, roadmap tables, KPI dashboards, and process diagrams (e.g., Climate Transition Plan). Strategic use of pull-quotes, iconography, case study boxes, and clear section navigation creates a dynamic and readable flow, transforming complex data into a compelling story.
It seamlessly integrates all three ESG pillars under the overarching 'Nurturing Growth' strategy. The 'Nurturing Our Society' section is as detailed as the environmental one, covering workforce diversity, health & safety, wellbeing, value chain human rights, and community impact with robust KPIs. The governance chapter clearly outlines board-level oversight, committee structures, ethical frameworks, and policy commitments, demonstrating that sustainability is embedded at the highest level of the business.
Yes, it serves as an excellent educational and structural guide. The comprehensive page-by-page breakdown shows what information needs to be gathered and how to present it logically—from defining strategy and material topics to reporting data and telling case studies. It helps identify key data points (e.g., energy consumption, training hours, waste volumes) that need to be tracked internally, providing a clear checklist for building a reporting system over time.
The template itself provides the model: key condensed summaries exist on pages like the 'Highlights' (p4), 'Progress Against Commitments' table (p9), 'Performance Snapshot' (p60), and the 'Materiality Matrix' (p88). You can extract these high-impact pages, along with the strategy overview (p6) and key charts (e.g., emissions reduction p21, engagement trend p64), to create a powerful 10-15 slide executive summary that retains the core narrative and data integrity.

Create Your Own Slides
Turn your ideas into professional presentations in seconds with 2slides AI.
전문 디자인을 참조하고, 스타일을 선택하며, 완벽한 텍스트 렌더링으로 슬라이드를 생성하세요. Nano Banana로 구동—지금 프레젠테이션 만들기를 시작하세요.



