
수록 모음: 투자자 발표자료 사례 · 반도체 기업 IR 자료 예시
onsemi Q3 2026 Investor Presentation — onsemi's (ON Semiconductor) quarterly investor deck for the third quarter of 2026, released November 2, 2026 alongside its Q3 earnings release. It covers Q3'26 non-GAAP results ($1.72B revenue, 41.2% gross margin, $0.90 EPS), revenue by end market including $180m from AI data center, Q4'26 guidance, the new Embedded Power Platform (EPP), vertical GaN, the AI data center power tree opportunity, automotive and industrial content, capital allocation, the 2030 target model and full GAAP to non-GAAP reconciliations.
이 프레젠테이션의 표지를 스타일 참고 자료로 사용해 내 콘텐츠로 슬라이드를 만듭니다. 아래에서 원하는 페이지를 골라 그 레이아웃을 참고로 쓸 수도 있습니다.
빠른 탐색
태그
슬라이드 공유
onsemi Q3 2026 Investor Presentation — onsemi's (ON Semiconductor) quarterly investor deck for the third quarter of 2026, released November 2, 2026 alongside its Q3 earnings release. It covers Q3'26 non-GAAP results ($1.72B revenue, 41.2% gross margin, $0.90 EPS), revenue by end market including $180m from AI data center, Q4'26 guidance, the new Embedded Power Platform (EPP), vertical GaN, the AI data center power tree opportunity, automotive and industrial content, capital allocation, the 2030 target model and full GAAP to non-GAAP reconciliations.
레이아웃, 주요 콘텐츠 및 시각적 요소를 포함한 각 슬라이드 페이지의 상세 보기.
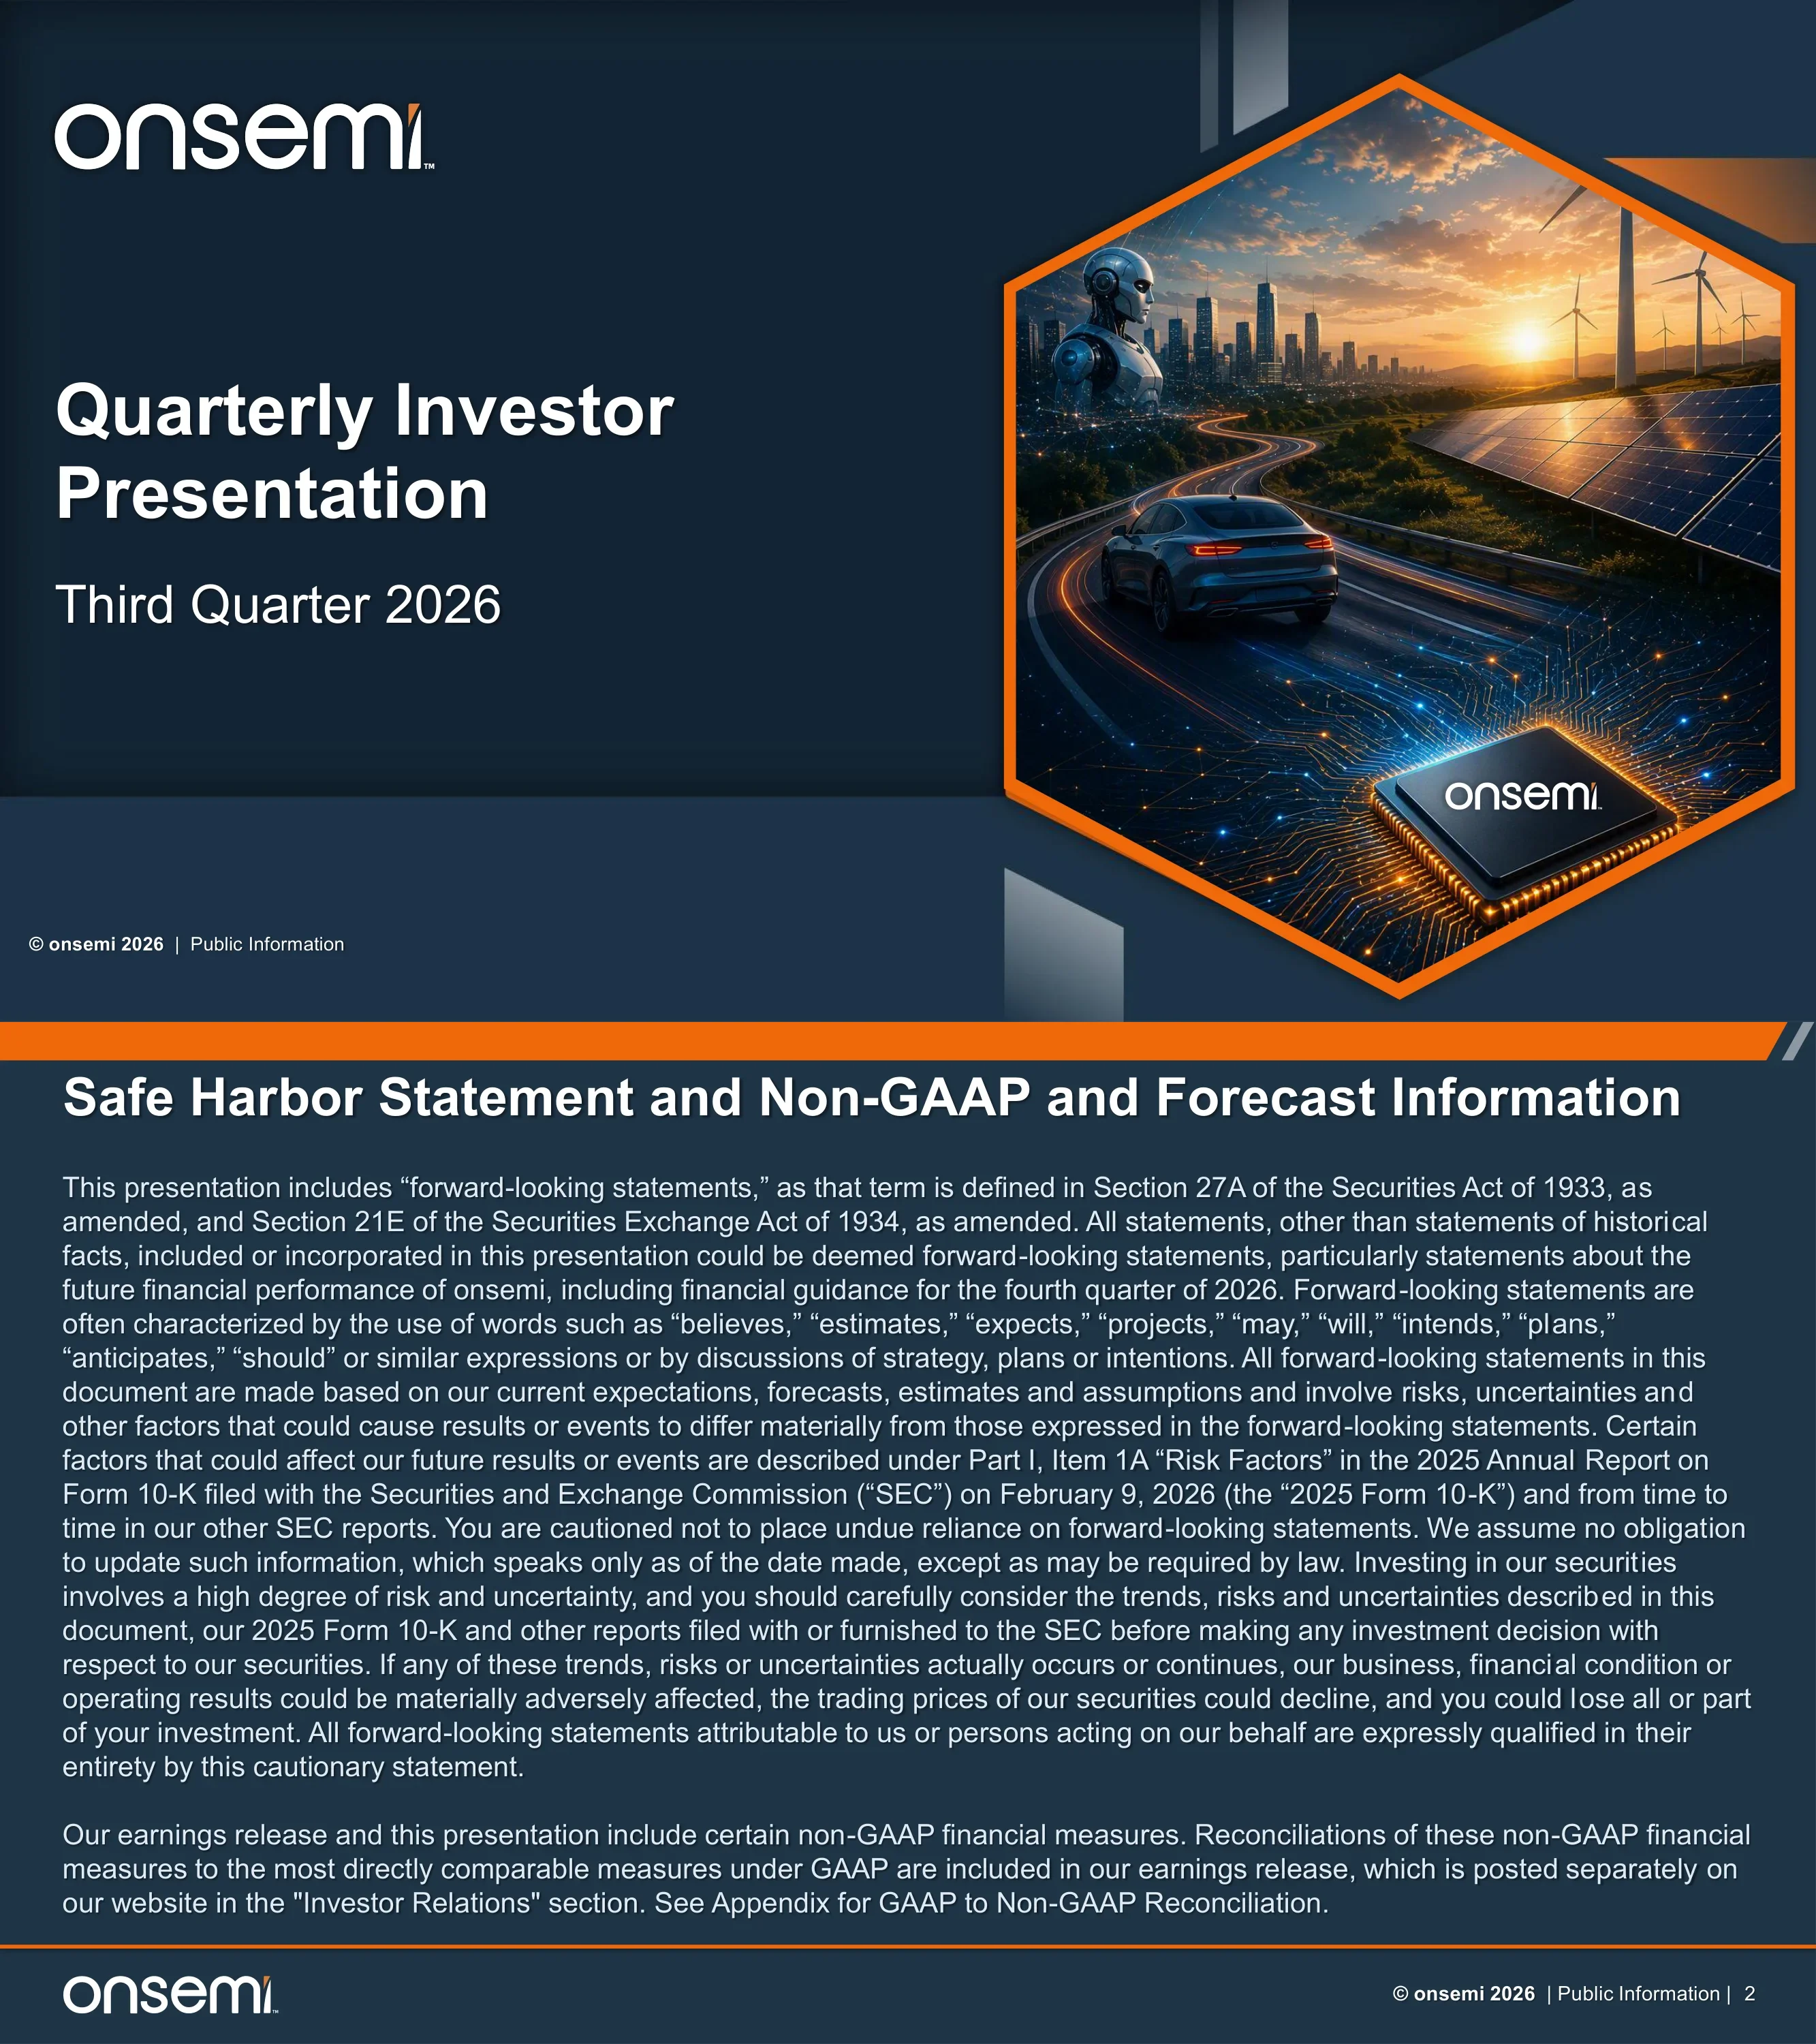
Cover slide with the onsemi logo, the title 'Quarterly Investor Presentation' and subtitle 'Third Quarter 2026', marked Public Information.
Left-aligned title block on dark navy background; right side holds a large orange-outlined hexagon image frame.
Forward-looking statements disclaimer under Section 27A of the Securities Act and Section 21E of the Exchange Act, covering Q4 2026 guidance and referring to risk factors in the 2025 Form 10-K filed February 9, 2026; notes that non-GAAP reconciliations are in the earnings release and the appendix.
Full-width text slide with orange top bar, heading and two paragraphs of legal copy; footer with logo and page number.
Six highlights: exceeded the midpoint of guidance for revenue, non-GAAP gross margin and EPS; EPS grew four times faster than revenue year over year for the third consecutive quarter; revised Synaptics merger terms to deliver immediate EPS accretion upon close; fifth consecutive quarter of non-GAAP gross margin expansion; AI data center revenue up 39% sequentially and 175% year over year; introduced the Embedded Power Platform (EPP) with 3-5x higher power density.
Honeycomb of orange-outlined hexagons, text hexagons interleaved with image hexagons (satellite network, EV cutaway, server racks).
Q3'26 non-GAAP results: revenue $1.72B (+7% Q/Q), gross margin 41.2% (+190 bps Q/Q), operating margin 23.2% (+240 bps Q/Q), diluted EPS $0.90 (+$0.16 Q/Q), LTM FCF margin 25.4% (+350 bps Y/Y). Revenue by end market: Automotive $777m (-1% Q/Q), Industrial $467m (+10% Q/Q), AI Data Center $180m (+39% Q/Q), Other $299m (+11% Q/Q).
Top row of five KPI tiles with value and orange change label; bottom row of four color-coded end-market cards (blue, green, red, grey).
Three press announcements: onsemi and Synaptics announce a revised merger agreement; onsemi introduces the Embedded Power Platform, a breakthrough architecture for the AI era; Subaru to evaluate onsemi's Embedded Power Platform for future EVs. Links to onsemi.com press announcements.
Three equal columns, each an image card framed by orange bars above a bold headline with an orange accent mark.
Q4'26 guidance at a glance (midpoints non-GAAP): revenue $1,765m (GAAP and non-GAAP $1,715m-$1,815m); gross margin 42.5% (GAAP 41.4%-43.4%, non-GAAP 41.5%-43.5%); opex $311m (GAAP $331m-$346m, non-GAAP $303m-$318m); EPS $1.01 (GAAP $0.88-$1.00, non-GAAP $0.95-$1.07).
Wide banner image across the top labeled 'Guidance at a Glance', above four rounded guidance cards with a large midpoint figure and GAAP/non-GAAP ranges.
Section divider introducing the company overview and strategy section.
Diagonal split layout: logo and grey stripes on the left, angled orange line, circuit-board image on the right, section title in a dark band.
Contrasts 'the power of yesterday' (electrical components: more watts, bigger, centralized) with 'the power of today' (multi-physics systems: more watts, smaller, distributed) across four dimensions: electrical, thermal, mechanical and physical. Tagline: more power, less space, higher efficiency, unmatched reliability; 'We solved power, now we solve power density'.
Blue-framed left panel and orange-framed right panel bracketing four icon columns; bottom gradient arrow banner from blue to orange.
Three capability pillars: HV 'the device' (IGBT, SiC MOSFET/JFET, GaN and vertical GaN across a cost/density map); Treo 'the intelligence' (analog and mixed-signal platform with power, AFE, compute and communications subsystems); EPP 'the integration' (silicon as the system). The onsemi advantage: power across silicon, SiC and GaN for the full 0.8V-800V power tree; vertical GaN Syracuse-built with 180+ patents and 700V and 1200V sampling; Treo on a BCD 65nm process; EPP built on a Si wafer with mixed dies.
Three framed columns (device chart, block diagram, wafer image) above a full-width 'onsemi Advantage' summary strip with four entries.
EPP positioned as 'the silicon becomes the system' and a new category of power systems: it uses the silicon wafer itself as the package, embedding heterogeneous die for electrical, mechanical and thermal performance. Stats: 3-5x power density, 30% highest system value, 12-inch standard manufacturing, 4-month time to market, plus best-in-class inductance and superior thermal performance. 'Not a product. A platform.'
Large hero headline with orange emphasis on the left, a stat bar of four figures plus two check items, explanatory paragraph with orange rule; wafer and magnified die image on the right.
Vertical GaN applications: AI data centers (smaller 800V converters, higher rack compute density), renewable energy, electric vehicles (faster charging, smaller inverters) and aerospace, defense and security. GaN-on-GaN vertical current flow gives higher current density, voltage handling and faster switching than silicon and SiC; built in a 66K sq ft facility in Syracuse, NY with a 20K sq ft cleanroom; onsemi is first to scale vertical GaN with 700V/1,200V devices sampling and volume production targeted for late 2026.
Chevron-shaped photo strip of four application images with captions, above three text cards (Breakthrough, Manufacturing Excellence, Leading in Scale).
Two power-tree diagrams: today's 54V DC architecture (120kW rack, onsemi opportunity ~$15K per rack) and the 2030 800V HVDC architecture (600kW-1MW rack, ~$115K per rack) opening wide-bandgap content (SiC MOSFET, SiC JFET, GaN). onsemi expects AI data center revenue to more than double year over year in 2026 and double again in 2027, with the full 0.8V-800V portfolio across Si, SiC FET, SiC JFET, GaN and vGaN. Source: onsemi estimates.
Two stacked block-flow diagrams from utility grid to GPU, each with an orange 'Today' / '2030' arrow panel and rack-value callout; four bullets below.
Automotive content map with up to $2,000 of onsemi content per vehicle: vehicle electrification (EPP, EliteSiC FET, SiC current controller; 48V transition with HV Si FET, GaN/SiC gate drivers, SmartFET/eFuse), zonal electronics (LED drivers, 10BASE-T1S Ethernet, CAN/LIN, LDOs, protection) and ADAS (8Mp and 3Mp image sensors, iToF, SWIR, ultrasonic, inductive, rain and light sensing). Recently added products are highlighted in orange.
Left column of three color-coded product lists; right side a transparent X-ray car rendering with highlighted modules; orange banner for the per-vehicle content claim.
Six industrial segments: AI halo (grid upgrades and high-voltage energy storage), energy infrastructure (power generation and EV charging), traditional industrial (power tools, HVAC, building automation, motor control), factory automation (robotics, warehouse automation, humanoids), AD&S (satellites, space, weapon systems, commercial aviation) and medical (CGMs, hearing health, imaging, diagnostics).
Two-by-three grid of rounded cards with glowing colored borders, each with a photo header, segment label, tagline and examples.
Four-step capital allocation framework: reinvest in differentiated products, R&D and capacity; strategic M&A to expand TAM with clear financial merit; maintain a strong balance sheet, liquidity and leverage profile; return 100% of free cash flow through share repurchases, with $5.3B remaining under the existing authorization as of Q3 2026.
Four interlocking chevron panels in blue, teal, yellow and orange, each with an icon, heading, subheading and description.
Non-GAAP long-term model, 2025A vs 2030 target: revenue $6.0B to +12-14% CAGR; gross margin 38.4% to 53%; operating expenses 19.8% to 15%; operating margin 18.6% to 38% (operating income grows more than 2x revenue); capex 5.7% to ~5%; free cash flow 23.7% to 30-35%, with 100% of FCF returned through buybacks. Non-GAAP tax rate stays at 15% through 2030.
Six-row table with metric, 2025 actual, orange 2030 target and a bullet explanation per row.
Section divider opening the appendix of financial detail and reconciliations.
Same diagonal split divider as page 7 with a data-visualization image on the right.
Five-period table (2025 actual, Q1'26, Q2'26, Q3'26 actual, Q4'26 guide, long-term target): revenue $5,995.4m / $1,513.3m / $1,603.5m / $1,722.3m / $1,715-1,815m / +12-14% CAGR; gross margin 38.4% / 38.5% / 39.3% / 41.2% / 41.5-43.5% / 53%; opex $1,185.4m / $293.7m / $296.8m / $309.5m / $303-318m / 15%; operating margin 18.6% / 19.1% / 20.8% / 23.2% / 38%; capex $341.2m / $21.9m / $34.3m / $27.8m / $40-50m / ~5%; LTM FCF 23.7% / 19.5% / 24.2% / 25.4% / 30-35%; EPS $2.35 / $0.64 / $0.74 / $0.90 / $0.95-1.07.
Banded financial table with a dashed orange outline around the guidance column and a commentary column in orange text.
GAAP to non-GAAP bridge for Q4'26 guidance: revenue $1,715-1,815 million; gross margin 41.4-43.4% GAAP plus 0.1% special items equals 41.5-43.5%; opex $331-346 million less $29 million equals $303-318 million; other income and expense ($27 million); diluted EPS $0.88-1.00 plus $0.07 equals $0.95-1.07; diluted shares 397 million GAAP and 392 million non-GAAP.
Three-column table (GAAP, Special Items, Non-GAAP) with six metric rows.
Footnotes on diluted share count and convertible note hedge and warrant thresholds for the 0% notes due 2027, 0.50% notes due 2029 and 0% notes due 2031; list of special items excluded from non-GAAP; and the rationale for using non-GAAP measures.
Full-width text slide with three asterisk-marked footnote paragraphs.
Reconciliations for FY2025, Q1'26, Q2'26 and Q3'26: GAAP gross margin 41.4% to non-GAAP 41.2% in Q3; GAAP opex $334.7m to non-GAAP $309.5m; GAAP operating income $378.3m to non-GAAP $399.8m; GAAP operating margin 22.0% to non-GAAP 23.2%; LTM free cash flow $1,616.6m on LTM revenue $6,369.2m for a 25.4% margin.
Single large spreadsheet-style table with orange header row, blue section bands and dotted row lines.
Net income and EPS reconciliation: Q3'26 GAAP net income $313.9m to non-GAAP $354.0m; non-GAAP diluted shares 392.2m; non-GAAP diluted EPS $0.90 (FY2025 $2.35, Q1'26 $0.64, Q2'26 $0.74). The last column header reads 'Q2'26' twice in the original slide, but its figures are the Q3'26 values.
Spreadsheet-style table with orange header, adjustment lines a) to i), share-count and EPS sections.
onsemi logo with the tagline 'Intelligent Technology. Better Future.', a 'Follow us @onsemi' prompt with LinkedIn, X and Facebook icons, and onsemi.com.
Centered logo and tagline on navy hexagon-pattern background with a diagonal white and orange edge on the left.
이 슬라이드 및 기본 프레젠테이션 콘텐츠에 대한 일반적인 질문.
It is onsemi's official 23-slide quarterly investor deck for the third quarter of 2026, released November 2, 2026 with its Q3 earnings release and published by onsemi Investor Relations. It covers Q3 results, Q4 2026 guidance, technology strategy (EPP, vertical GaN), end markets, the 2030 financial model and GAAP to non-GAAP reconciliations.
On a non-GAAP basis, onsemi reported revenue of $1.72 billion (+7% quarter over quarter), gross margin of 41.2% (+190 bps), operating margin of 23.2%, diluted EPS of $0.90 and an LTM free cash flow margin of 25.4%. AI data center revenue was $180 million, up 39% sequentially and 175% year over year.
onsemi guided Q4 2026 revenue to $1,715-$1,815 million (midpoint $1,765 million), non-GAAP gross margin to 41.5%-43.5%, non-GAAP opex to $303-$318 million and non-GAAP diluted EPS to $0.95-$1.07, with a midpoint of $1.01.
The deck targets a +12-14% revenue CAGR from $6.0 billion in 2025, a 53% non-GAAP gross margin, opex at 15% of revenue, a 38% operating margin, capex around 5% and a 30-35% free cash flow margin, with 100% of free cash flow returned through share repurchases.
Yes. The original PDF is available to download from this page and every slide is previewed and summarized. Use it as a reference for structure and layout (KPI tiles, guidance cards, power-tree diagrams, long-term model table, reconciliation tables) when building your own earnings deck; the content and branding belong to onsemi.
This listing offers the original PDF published by onsemi Investor Relations. No PPTX is attached for this deck; you can recreate any layout in your own slides or generate a similar presentation with 2Slides.
Semiconductor investors and analysts tracking onsemi, IR and finance teams designing quarterly earnings decks, and anyone researching power semiconductors, silicon carbide, vertical GaN or AI data center power delivery.
onsemi publishes its quarterly investor presentations, earnings releases and SEC filings on its investor relations site at investor.onsemi.com, and the earnings materials are also available on SEC EDGAR.
Official source for onsemi quarterly investor presentations, earnings releases and SEC filings.

Create Your Own Slides
Turn your ideas into professional presentations in seconds with 2slides AI.
전문 디자인을 참조하고, 스타일을 선택하며, 완벽한 텍스트 렌더링으로 슬라이드를 생성하세요. Nano Banana로 구동—지금 프레젠테이션 만들기를 시작하세요.


