
onsemi Q2 2026 Investor Presentation
빠른 탐색
태그
슬라이드 공유
onsemi Q2 2026 Investor Presentation
레이아웃, 주요 콘텐츠 및 시각적 요소를 포함한 각 슬라이드 페이지의 상세 보기.
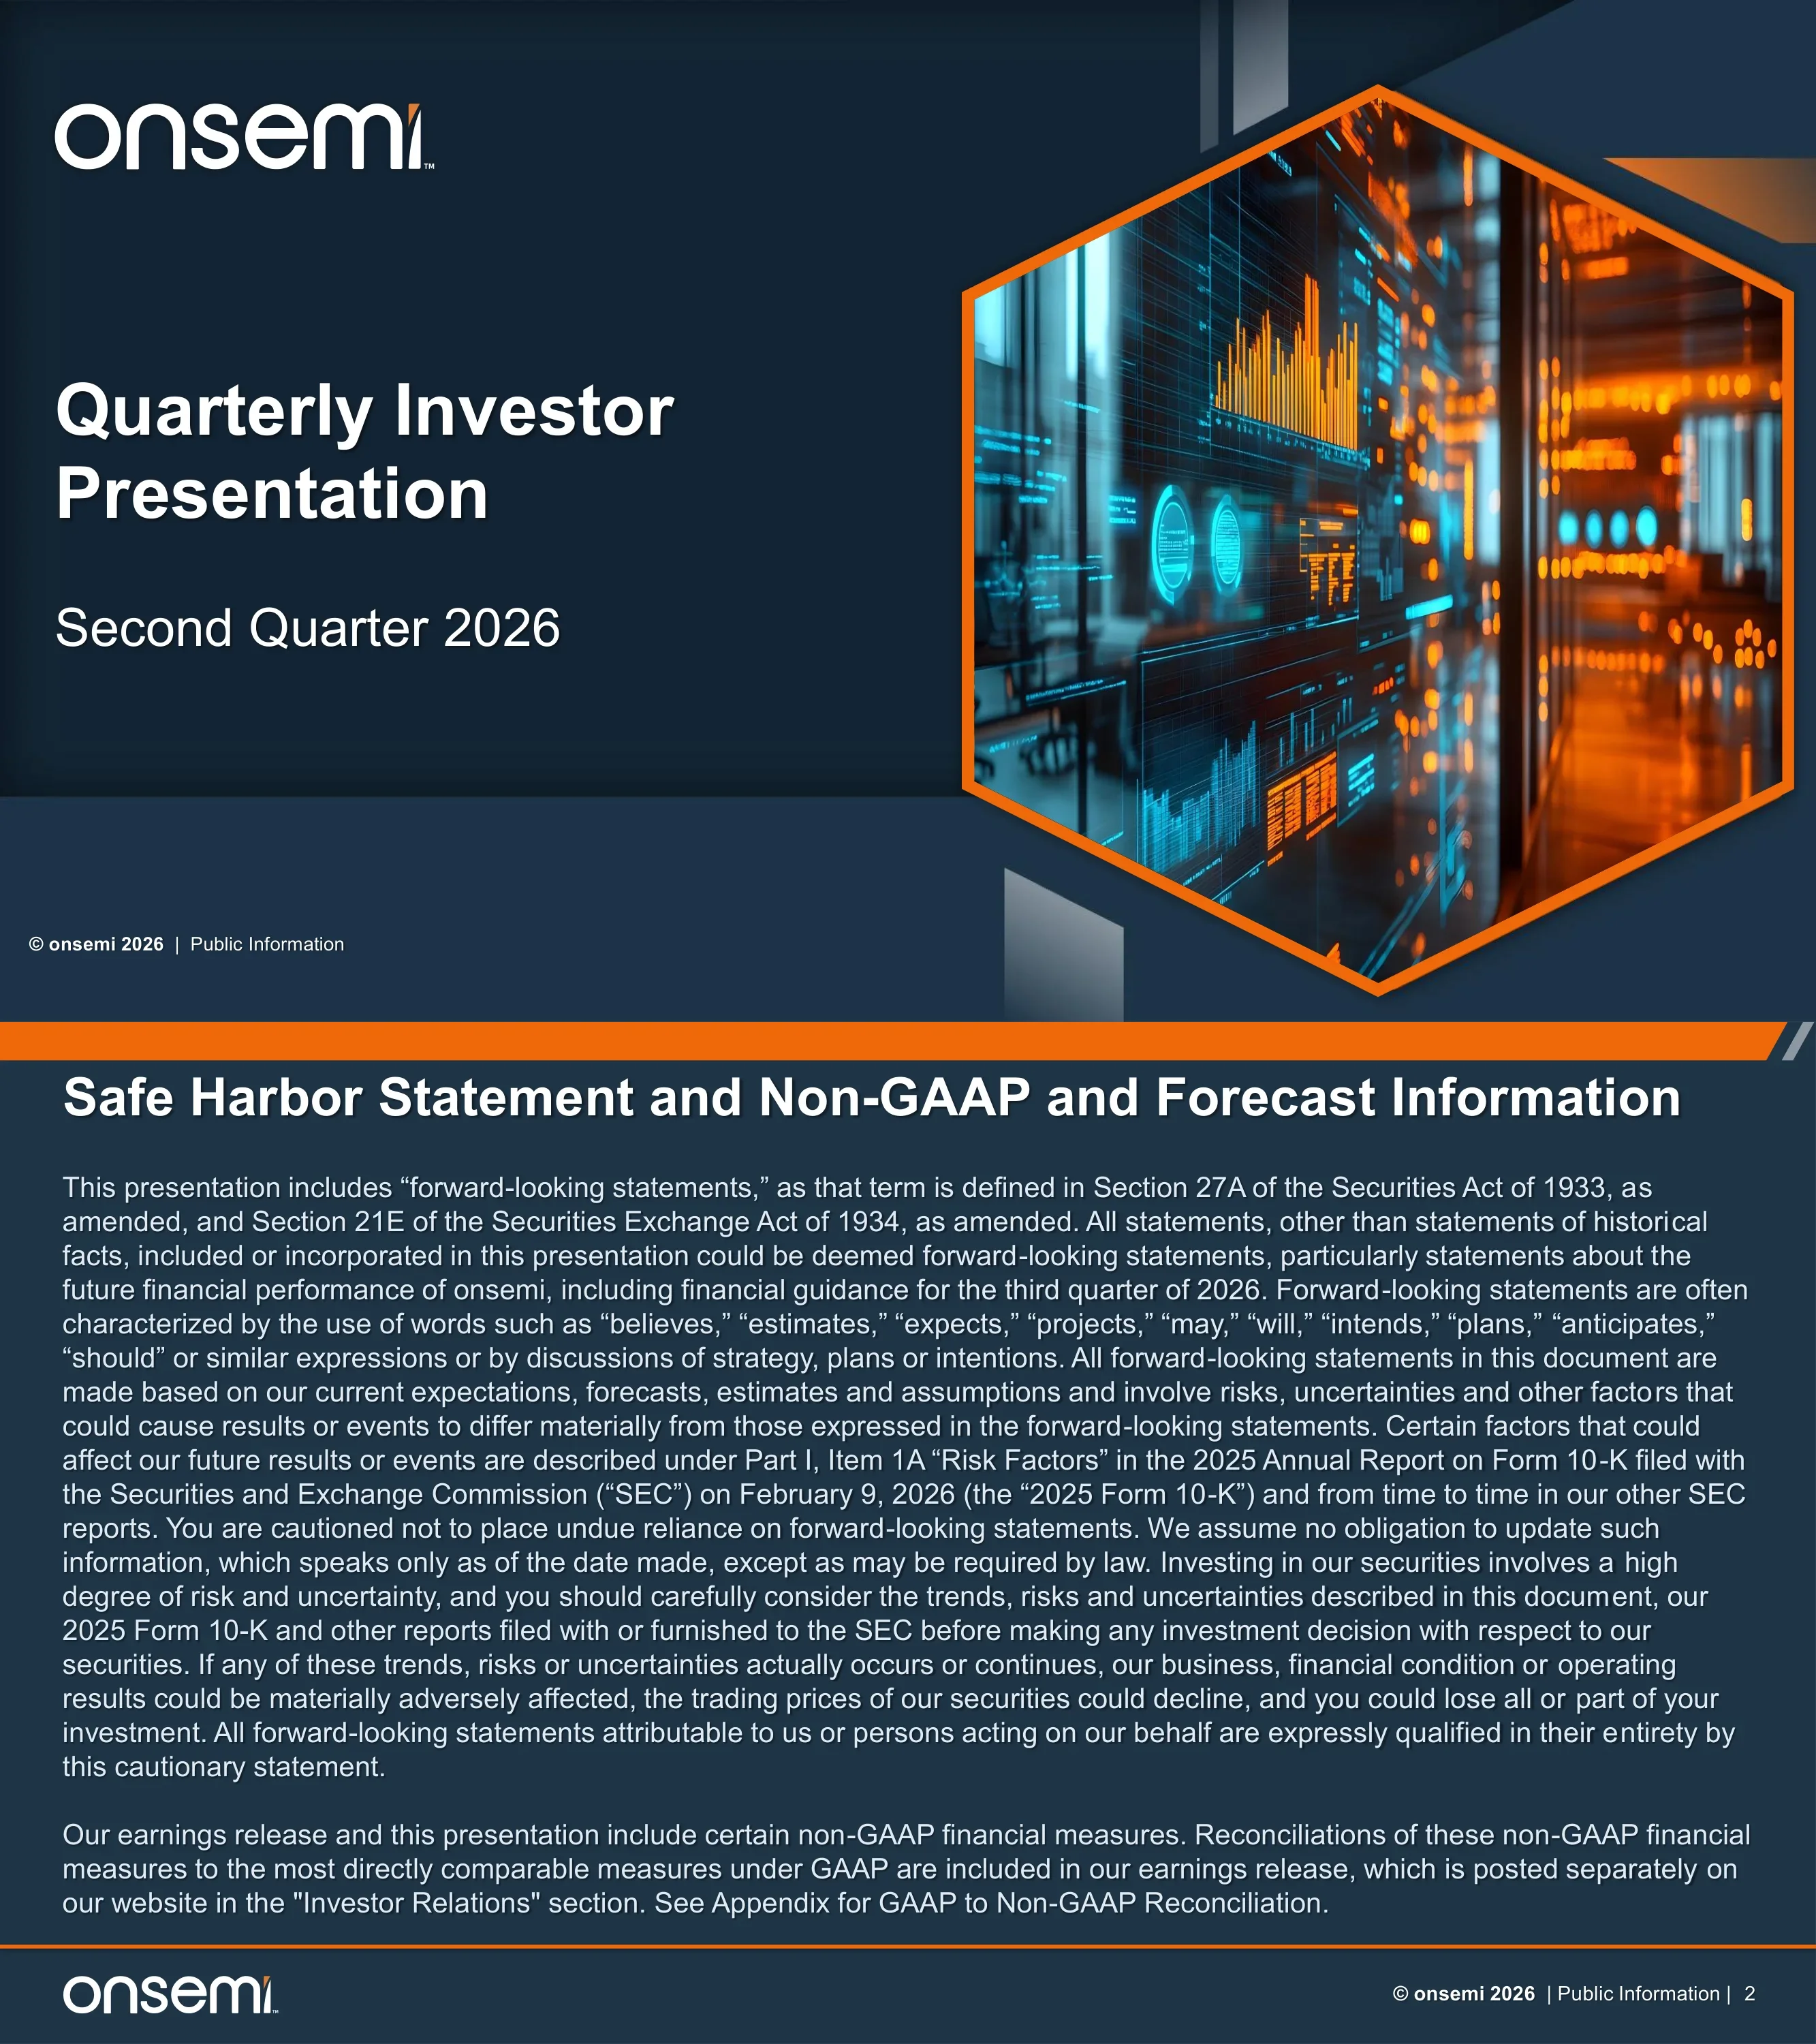
Cover slide announcing onsemi's Quarterly Investor Presentation for the Second Quarter 2026, marked Public Information.
Left-aligned white onsemi wordmark and large bold title on a dark navy background; right half holds a large orange-outlined hexagon framing a glowing blue-and-orange data-center/analytics photo; lighter navy band along the bottom with the copyright line.
Standard forward-looking statements disclaimer referencing Q3 2026 guidance and the 2025 Form 10-K filed with the SEC on February 9, 2026, plus a note that non-GAAP reconciliations are in the earnings release and appendix.
Full-width text slide: orange header bar, white bold title, two dense justified paragraphs in light grey on navy, orange footer rule with logo and page number.
Section divider opening the Q2 2026 financial and business update portion of the deck.
Diagonal split layout: navy left panel with logo and grey speed stripes, orange diagonal edge, right side photo of holographic orange bar charts and blue dials; a dark slanted banner across the bottom carries the section title.
Six highlights: beat the guidance midpoint for revenue, non-GAAP gross margin and EPS; non-GAAP EPS growth outpaced revenue growth 4x Y/Y; Q2 FCF up 3x Y/Y to ~27% of revenue; agreement to acquire Synaptics; AI data center revenue expected to more than double in 2026; 105% of YTD FCF returned via buybacks.
Hub-and-spoke: central hexagonal 'Sustainable Ecosystem' wheel with eight end-market segments (Industrial Automation, Energy Infrastructure, Zonal Architecture, Advanced Safety, EV, AI Data Center, Charging, Medical) ringed by Intelligent Sensing / Intelligent Power arcs; six orange-outlined text boxes (three per side) connected by orange lines.
Revenue $1.60B (+6% Q/Q), gross margin 39.3% (+80 bps Q/Q), operating margin 20.8% (+170 bps Q/Q), diluted EPS $0.74 (+$0.10 Q/Q), LTM FCF margin 24.2% (+410 bps Y/Y). Segment revenue: Automotive $781m (down 2% Q/Q), Industrial $423m (up 1%), Other $400m (up 34%).
Five vertical KPI columns with orange line icons over trapezoid spotlight headers and black value panels; a row of three grey-headed blue segment cards below with up/down arrow indicators.
Three announcements: agreement to acquire Synaptics adding connected compute at accretive gross margins; a private offering of $1.3 billion of 0% convertible senior notes; and the GaNEXUS gallium nitride power portfolio. Links to onsemi's press announcements page.
Three equal columns, each an image card framed by orange bars top and bottom (Physical AI circle graphic, glowing financial line chart, GaNEXUS product packages) with a bold headline and orange accent marker beneath.
Q3'26 guidance: revenue $1,650-1,750m (GAAP and non-GAAP), gross margin 39.9-41.9% GAAP / 40.0-42.0% non-GAAP, OPEX $318-333m GAAP / $303-318m non-GAAP, EPS $0.79-0.91 GAAP / $0.81-0.93 non-GAAP.
Wide chevron-shaped banner image of glowing 3D bar charts across the top; four large solid-orange tiles below with huge white metric labels (Revenue, GM, OPEX, EPS) and GAAP/non-GAAP ranges.
Section divider introducing the company overview portion of the deck.
Same diagonal split divider template as slide 3, with a circuit-board image featuring glowing chips labelled with solar, AI, car and robot-arm icons.
Mission to create intelligent power and sensing technologies; key facts: $6.0B 2025 revenue, 24% FCF margin, 8.6x increase in FCF and 1.4x operating income growth (2019-2025), >9K customers, ~23K employees, 25K+ SKUs and 18 manufacturing sites in 9 countries.
Top half: orange dotted globe graphic at left and mission statement at right with orange keyword highlights; bottom band: large $6.0B hexagon plus seven outlined hexagon stat tiles in a staggered honeycomb with orange numbers.
Three power pillars: Wide Bandgap (SiC, GaN, VGaN; EliteSiC, package technology, SmartFET), Silicon Power (IGBT, FET; growing share, AI data center tray/rack/UPS), and Analog & Mixed-Signal ICs ($36B TAM with >70% gross margin). The onsemi Advantage: Supply, Superior Technology, Scale and Scope.
Three columns, each with an orange title bar, a photo (EV chassis, server racks, glowing tree on a circuit board) and bullets; below, an orange-outlined 'onsemi Advantage' band with four large italic orange numerals 1-4.
Image-sensor strengths: Automotive & Industrial focus as market leader in high-performance image sensors; Superior Technology (High Dynamic Range, industry-leading 8 megapixel); Solution Enablement (Devware, reference designs, ecosystem); Decades of Innovation with >600m automotive sensors installed.
Honeycomb cluster of seven hexagons: four solid orange text hexes interlocked with four orange-outlined photo hexes (traffic sensing, battery icon, robotic factory, digital hand/robot).
onsemi content across the vehicle: In-Cabin (DMS, OMS), Viewing (SVS, CMS e-mirror), ADAS & autonomous driving, vehicle electrification (on-board charger, traction inverter, DC-DC), 48V transition, and body electronics/lighting/safety including 10BASE-T1S networking; >500 devices at $1,600+ per vehicle.
Centered cutaway render of an electric SUV with orange leader lines to five dark, orange-bordered callout boxes (three left, two right); large bold stat '>500 devices at $1,600+ per vehicle' at bottom center.
Five industrial sub-markets: Factory Automation (robotics, humanoids), Aerospace, Defense & Security, Traditional Industrial (power tools, HVAC, motor control), Medical (CGM, hearing health, imaging) and Energy Infrastructure (generation, storage, EV charging).
Honeycomb layout mirroring slide 11: five orange text hexagons and three photo hexagons (factory conveyor, satellite over Earth, connected hospital).
Compares today's 120kW rack on a 54V DC bus (onsemi opportunity ~$15K per rack) with a 2030 600kW-1MW rack on 800V HVDC (~$115K per rack), opening WBG content such as SiC MOSFET, SiC JFET and GaN; onsemi addresses the full power tree from 0.8V to 800V.
Two stacked orange-framed block diagrams tracing power flow from utility grid through UPS/SST, PDU, PSU, bus bar, hot swap, IBC and VCore to GPU, with blue arrows and labelled voltages; orange chevron tabs 'Today' and '2030' at right with rack power and dollar opportunity; three bullets beneath.
Treo addresses a $36B market across automotive, industrial automation, AI data center power, advanced sensing and AD&S; built on a 65nm BCD process with 1-90V range, spec-to-silicon in 6-9 months, with multiple Treo-based products already sampling.
Large orange 'Treo' wordmark top left; left strip of four staggered orange-bordered hexagon photos; center column listing target segments; right column with three orange-marked headings and bullets, key phrases highlighted in orange.
Vertical GaN-on-GaN offers higher current density, voltage handling and faster switching than silicon and SiC; built in a 66K sq ft Syracuse, NY facility with 20K sq ft cleanroom; 700V/1,200V devices sampling with volume production targeted for late 2026. Applications: AI data centers, renewable energy, EVs and AD&S.
Chevron photo strip of four application images (server racks, energy containers with wind turbines, EV charger, fighter jet) with orange captions; three dark text cards below with orange left borders (Breakthrough, Manufacturing Excellence, Leading in Scale).
$213B TAM by 2030: Electric Vehicles $63.5B (12% CAGR), AI Data Center $47.5B (72% CAGR), Advanced Safety $19.4B (16%), AD&S $14.0B (9%), Factory Automation $13.7B (9%) and Energy Infrastructure $11.4B (24%), 2026-2030 projections.
Symmetric layout around a large central orange circle stating '$213B TAM by 2030'; three segment stat panels on each side, each paired with an orange-framed hexagon photo on the outer edge.
Four value levers: revenue growth aligned to automotive, industrial and AI data center trends; gross margin expansion to 53% via Fab Right and new products; FCF margin expansion to 25-30%; and returning 100% of FCF through buybacks under a $6.0B repurchase authorization.
Four stacked horizontal rows, each with an orange label block at left and dark gradient bullet panel with orange square markers; right side has a chevron-cut photo of stacked coins overlaid with financial lines.
2025 actuals vs long-term targets: revenue $6.0B vs 10-12% CAGR (~3x the semiconductor industry), gross margin 38.4% vs 53%, OPEX 19.8% vs 13%, operating margin 18.6% vs 40%, CapEx 5.7% vs mid-single digits, FCF 23.7% vs 25-30%.
Table with row labels at left, an orange '2025 Actuals' column, a teal 'Long-Term Target' column and a wide teal commentary column with bullets; alternating dark/teal row shading.
Section divider opening the appendix of supporting financial tables.
Diagonal split divider template with an image of glowing orange and blue 3D bar charts on a grid.
Five-period table: revenue $5,995.4m (2025), $1,513.3m (Q1'26), $1,603.5m (Q2'26), $1,650-1,750m (Q3 guide); gross margin 38.4%/38.5%/39.3%/40.0-42.0%; OPEX $1,185.4m/$293.7m/$296.8m; CapEx $341.2m/$21.9m/$34.3m; EPS $2.35/$0.64/$0.74/$0.81-0.93. Commentary notes the fourth consecutive quarter of gross margin expansion.
Grid table with blue column headers (2025 Actual, Q1'26, Q2'26, Q3'26 Guide, Long-Term Target); the Q3 guide column is outlined with a dashed orange box and orange figures; right-hand column of orange commentary bullets.
GAAP to non-GAAP bridge for Q3'26 guidance: gross margin 39.9-41.9% plus 0.1% special items = 40.0-42.0%; OPEX $318-333m less $15m = $303-318m; other income and expense ($18m); EPS $0.79-0.91 plus $0.02 = $0.81-0.93; diluted shares 402m vs 395m non-GAAP.
Clean four-column table (metric, GAAP, Special Items, Non-GAAP) with blue header cells and alternating dark navy/blue rows, generous whitespace.
Footnotes on diluted share count mechanics for the 0%, 0.50% and 2031 0% convertible notes (hedge and warrant thresholds such as $52.97, $103.87 and $161.30), the list of possible special items, and why non-GAAP measures are provided.
Text-only slide with three asterisk-marked paragraphs in light grey on navy under the standard orange header bar.
Reconciles gross margin, OPEX, operating income and operating margin for FY2025, Q1'26 and Q2'26; e.g. Q2'26 GAAP operating income $258.6m to non-GAAP $334.1m and GAAP operating margin 16.1% to 20.8%; LTM FCF $1,500.4m on LTM revenue $6,197.8m (24.2%).
Single dense spreadsheet-style table with an orange title row, blue sub-section bands, dotted row separators and right-aligned numbers in three period columns.
Bridges GAAP net income ($121.0m FY2025, ($33.4m) Q1'26, $226.8m Q2'26) to non-GAAP net income ($966.4m, $253.1m, $293.8m), reconciles diluted shares (Q2'26 404.4m GAAP to 397.0m non-GAAP) and derives non-GAAP EPS of $2.35, $0.64 and $0.74.
Same spreadsheet table style as slide 24: orange header row, blue section bands for net income, diluted shares and EPS, bold total rows.
Sources for slides 10, 11 and 17: onsemi estimates, IHS-Omdia, and Omdia reports (Power Semiconductors in Automotive 2026, Electronics Equipment & Semiconductor Forecast 2Q26, Industrial Semiconductor Market Tracker 4Q25), plus definitions of the AI data center, energy infrastructure and factory automation TAMs.
Text-only slide with bold sub-headings referencing slide numbers and bulleted source lines, left-aligned on navy.
Closing slide with the onsemi logo, tagline 'Intelligent Technology. Better Future.', 'Follow us @onsemi' with LinkedIn, X and Facebook icons, and onsemi.com.
Centered large white wordmark and tagline on navy with a faint hexagon pattern; white wedge and orange diagonal stripe on the left edge; social icons and URL centered below.
이 슬라이드 및 기본 프레젠테이션 콘텐츠에 대한 일반적인 질문.
The 27-slide deck has three parts: a Q2 2026 Financial & Business Update (highlights, non-GAAP KPIs, strategic announcements, Q3'26 guidance), an About onsemi section (company at a glance, power and sensing solutions, automotive, industrial, AI data center power tree, Treo platform, vertical GaN, $213B TAM, shareholder value and long-term financial model), and an Appendix with guidance tables, GAAP to non-GAAP reconciliations and sources.
On a non-GAAP basis the deck reports revenue of $1.60B (+6% Q/Q), gross margin of 39.3% (+80 bps), operating margin of 20.8% (+170 bps), diluted EPS of $0.74 (+$0.10 Q/Q) and an LTM free cash flow margin of 24.2% (+410 bps Y/Y). Automotive revenue was $781m, Industrial $423m and Other $400m.
Revenue of $1,650 to $1,750 million, non-GAAP gross margin of 40.0% to 42.0%, non-GAAP operating expenses of $303 to $318 million and non-GAAP diluted EPS of $0.81 to $0.93, with GAAP equivalents and a special-items bridge shown on slide 22.
Slide 19 compares 2025 actuals with long-term targets: 10-12% revenue CAGR, 53% gross margin (from 38.4%), 13% operating expenses (from 19.8%), 40% operating margin (from 18.6%), mid-single-digit CapEx and 25-30% free cash flow margin, with a target to return 100% of free cash flow through share repurchases.
Slide 14 uses two power-delivery block diagrams: today's roughly 120kW rack on a 54V DC bus, with an onsemi opportunity of about $15K per rack, and a 2030 rack of 600kW to 1MW on 800V HVDC, with about $115K per rack. Slide 17 puts the AI data center TAM at $47.5B with a 72% CAGR, and slide 4 says AI data center revenue is expected to more than double in 2026.
It uses a strict two-color system (dark navy with vivid orange, plus teal and blue for tables), the same orange header bar and footer on every content slide, and hexagons throughout for photo frames, stat tiles and the ecosystem wheel. It also shows useful financial layouts: KPI columns with Q/Q deltas, orange guidance tiles, an 'actual vs. long-term target' table, and a dashed box that marks guidance inside a multi-period table.
Yes. The gallery page offers the original PDF and an editable PPTX. The PPTX was machine-converted from the PDF, so check the layout and fonts before you reuse it as a template. The original deck comes from the onsemi investor relations site.
Financial figures are onsemi's reported and guided results, with non-GAAP measures reconciled in the appendix. Market sizes and TAM figures are based on onsemi estimates and IHS-Omdia/Omdia reports listed on slide 26. The deck is informational and is not investment advice.
Official investor relations site where onsemi publishes its quarterly investor presentations, earnings releases and GAAP to non-GAAP reconciliations, including this Q2 2026 deck.

Create Your Own Slides
Turn your ideas into professional presentations in seconds with 2slides AI.
전문 디자인을 참조하고, 스타일을 선택하며, 완벽한 텍스트 렌더링으로 슬라이드를 생성하세요. Nano Banana로 구동—지금 프레젠테이션 만들기를 시작하세요.
Your AI Agent for slides. Save time, shine faster with intelligent presentation creation.




© 2026 2slides. All rights reserved.